
Key Insights
The global medical dynamometer market, valued at $501.02 million in 2025, is projected to experience robust growth, driven by a compound annual growth rate (CAGR) of 6.54% from 2025 to 2033. This expansion is fueled by several key factors. Firstly, the rising prevalence of musculoskeletal disorders, neurological conditions, and cardiovascular diseases necessitates accurate and reliable assessment of muscle strength and function, increasing demand for dynamometers in hospitals, clinics, and rehabilitation centers. Technological advancements leading to the development of more portable, user-friendly, and digitally integrated dynamometers are further boosting market growth. The incorporation of features like wireless connectivity, data analysis software, and objective performance metrics enhances diagnostic capabilities and facilitates better patient care. Furthermore, the aging global population, coupled with an increase in sports-related injuries and a growing awareness of the importance of physical rehabilitation, are creating significant opportunities for market expansion. The market is segmented by usage (hospitals/clinics, rehabilitation centers, others), product type (chest, hand, push-pull, squeeze dynamometers, and other devices), and application (orthopedic, neurology, cardiology, medical trauma, and others), reflecting the diverse applications of this technology across various medical specialties. Competition is fierce amongst established players like North Coast Medical, KERN and SOHN GmbH, and Biodex Medical Systems Inc., spurring innovation and driving down costs, making this technology more accessible globally.
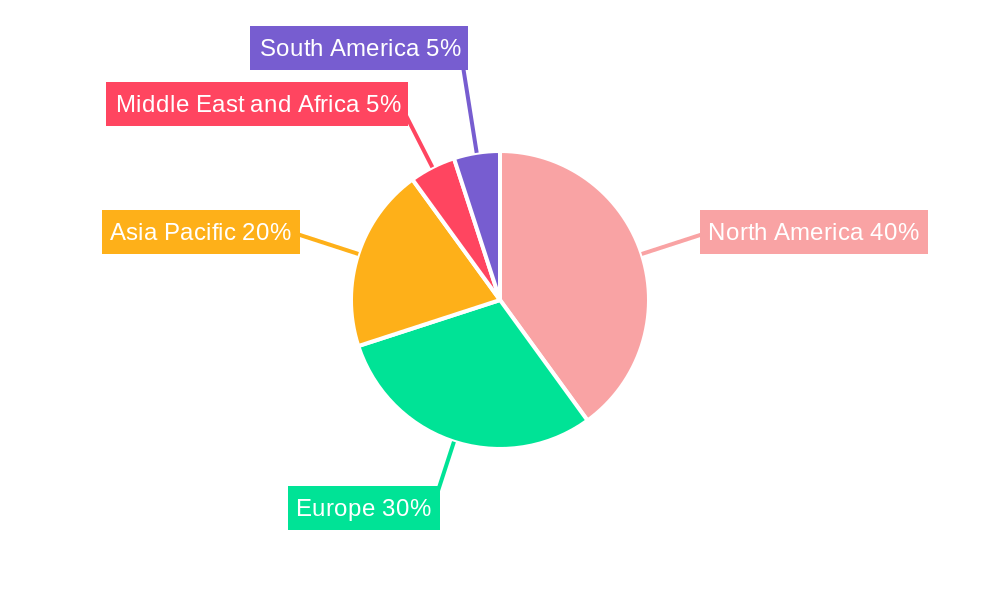
The geographical distribution of the market reveals significant regional variations in growth potential. North America, driven by high healthcare expenditure and technological advancements, currently holds a substantial market share. However, Asia-Pacific is projected to witness the fastest growth rate due to the increasing prevalence of chronic diseases, rising healthcare infrastructure development, and a growing focus on preventive healthcare. Europe and other regions are expected to contribute steadily to overall market growth, influenced by factors such as improving healthcare infrastructure and increasing awareness of rehabilitative care. While regulatory hurdles and high initial investment costs pose some challenges, the long-term benefits of improved patient outcomes and enhanced diagnostic precision are likely to outweigh these obstacles, ensuring the continued expansion of the medical dynamometer market in the coming years.

Medical Dynamometer Market: A Comprehensive Market Report (2019-2033)
This in-depth report provides a comprehensive analysis of the global Medical Dynamometer Market, offering valuable insights for industry stakeholders, investors, and researchers. The report covers the period from 2019 to 2033, with 2025 serving as the base year and the forecast period spanning 2025-2033. The historical period analyzed is 2019-2024. The market is segmented by usage, product type, and application, offering a granular understanding of market dynamics and future trends. Key players like North Coast Medical, KERN and SOHN GmbH, Marsden Weighing Group, JTECH Medical Industries Inc, Biodex Medical Systems Inc, Lafayette Instrument, Fabrication Enterprises, and Charder Electronic Co Ltd are profiled, providing a competitive landscape analysis.
Medical Dynamometer Market Concentration & Innovation
The Medical Dynamometer market exhibits a moderately concentrated landscape, with a few key players holding significant market share. The exact market share distribution for each company is xx% for 2025. Innovation in the sector is driven by advancements in sensor technology, miniaturization, wireless connectivity, and data analytics. Regulatory frameworks, particularly those related to medical device approvals (e.g., FDA in the US and CE marking in Europe), significantly influence market dynamics. Product substitutes, while limited, include manual strength assessment methods; however, the accuracy and efficiency of dynamometers continue to drive their preference. End-user trends show a growing demand for portable and user-friendly devices with digital readout and data storage capabilities. M&A activities have been relatively limited in recent years, with xx Million in total deal value recorded between 2019 and 2024. Future M&A activity is expected to increase in the forecast period due to increased market competition and innovation.
- Market Concentration: Moderately concentrated with top 5 players holding approximately xx% market share (2025).
- Innovation Drivers: Advanced sensor technology, miniaturization, wireless connectivity, data analytics.
- Regulatory Landscape: FDA (US), CE marking (Europe), and other regional regulations.
- Product Substitutes: Manual strength assessment methods.
- End-User Trends: Preference for portable, user-friendly devices with digital features.
- M&A Activity: Total deal value of xx Million between 2019-2024.
Medical Dynamometer Market Industry Trends & Insights
The Medical Dynamometer market is poised for significant growth, projected to experience a robust CAGR of [Insert Updated CAGR]% during the forecast period (2025-2033). This expansion is driven by a confluence of factors, including the escalating prevalence of chronic diseases such as musculoskeletal disorders, neurological conditions, and cardiovascular diseases, all of which necessitate regular and precise strength assessment. The increasing emphasis on evidence-based rehabilitation practices within healthcare systems is further fueling market demand. Healthcare professionals are increasingly recognizing the critical role of accurate and reliable diagnostic tools like dynamometers in optimizing patient care and treatment outcomes. This demand is amplified by the growing need for objective measurements to track progress and tailor rehabilitation programs effectively.
Technological advancements are fundamentally reshaping the market landscape. The integration of smart sensors, sophisticated data analytics powered by Artificial Intelligence (AI), and seamless cloud connectivity is enhancing the functionality, accuracy, and efficiency of dynamometers. This trend is complemented by a strong preference for devices offering streamlined data integration with Electronic Health Records (EHR) systems, enhancing workflow efficiency and improving data management for healthcare providers. The competitive landscape is dynamic, characterized by continuous product innovation, strategic partnerships aimed at expanding market reach, and a relentless focus on improving user experience. Market penetration is anticipated to increase from [Insert Updated 2025 Penetration]% in 2025 to [Insert Updated 2033 Penetration]% by 2033, driven by heightened awareness and wider adoption amongst healthcare professionals and a growing understanding of the clinical value proposition of dynamometers.
Dominant Markets & Segments in Medical Dynamometer Market
The Hospitals/Clinics segment dominates the Medical Dynamometer market by usage, driven by high patient volumes and the need for precise diagnostic assessments. Geographically, North America currently holds a leading position, attributed to factors such as advanced healthcare infrastructure, high adoption rates, and favorable reimbursement policies. The Hand Dynamometer segment leads by product type due to its widespread use in evaluating hand strength across various applications. Within applications, the Orthopedic segment commands a significant share driven by the high prevalence of musculoskeletal disorders requiring assessment and rehabilitation.
- Key Drivers for Hospitals/Clinics Segment: High patient volume, need for precise diagnostics.
- Key Drivers for North American Market: Advanced healthcare infrastructure, high adoption rates, favorable reimbursement policies.
- Key Drivers for Hand Dynamometer Segment: Wide application in evaluating hand strength.
- Key Drivers for Orthopedic Application: High prevalence of musculoskeletal disorders.
Dominance Analysis: The detailed dominance analysis reveals that the Hospitals/Clinics segment by usage, the Hand Dynamometer segment by product, and the Orthopedic segment by application show the highest market share and growth potential due to their inherent characteristics. The combination of these factors shows considerable growth and market potential in North America.
Medical Dynamometer Market Product Developments
Recent product developments include the integration of advanced sensors, wireless capabilities, and user-friendly interfaces. New applications are emerging in sports medicine, ergonomics, and home healthcare settings. The key competitive advantages lie in enhanced accuracy, portability, data analysis features, and seamless integration with existing healthcare IT infrastructure. Miniaturization and improved ergonomics are driving adoption. These advancements cater to the increasing need for efficient, portable, and data-driven assessment tools.
Report Scope & Segmentation Analysis
The report provides a comprehensive segmentation of the Medical Dynamometer market based on:
- By Usage: Hospitals/Clinics (projected growth [Insert Updated Growth]% ), Rehabilitation Centers (projected growth [Insert Updated Growth]% ), Others (projected growth [Insert Updated Growth]% ). Hospitals/Clinics currently hold the largest market share, reflecting the high volume of patient assessments conducted in these settings.
- By Product: Chest Dynamometer (projected market size [Insert Updated Market Size] Million), Hand Dynamometer (projected market size [Insert Updated Market Size] Million), Push Pull Dynamometer (projected market size [Insert Updated Market Size] Million), Squeeze Dynamometer (projected market size [Insert Updated Market Size] Million), Other Devices (projected market size [Insert Updated Market Size] Million). Hand Dynamometers currently command the largest market share due to their versatility and widespread applications.
- By Application: Orthopedic (projected growth [Insert Updated Growth]% ), Neurology (projected growth [Insert Updated Growth]% ), Cardiology (projected growth [Insert Updated Growth]% ), Medical Trauma (projected growth [Insert Updated Growth]% ), Others (projected growth [Insert Updated Growth]% ). The Orthopedic segment holds the largest market share, reflecting the high prevalence of musculoskeletal disorders and the crucial role of strength assessment in orthopedic rehabilitation.
The growth trajectory of each segment is intricately linked to specific factors such as technological advancements, disease prevalence rates, evolving clinical practices, and regulatory landscape changes. The competitive dynamics also vary across segments, with differing levels of competition and market concentration amongst key players.
Key Drivers of Medical Dynamometer Market Growth
Several key factors are propelling the growth of the Medical Dynamometer market. Significant technological advancements, such as the development of more accurate and sensitive sensors and sophisticated data analysis capabilities, are enhancing the diagnostic capabilities and clinical utility of these devices. The rising prevalence of chronic diseases necessitating regular strength assessments, particularly amongst aging populations, is a major driver of market demand. The widespread adoption of evidence-based rehabilitation strategies and the increasing availability of favorable reimbursement policies in developed economies are further contributing to market expansion. Moreover, stringent regulatory frameworks that ensure product quality, safety, and efficacy are promoting market growth and building trust amongst healthcare providers and patients alike.
Challenges in the Medical Dynamometer Market Sector
Despite the significant growth potential, the Medical Dynamometer market faces several challenges. High initial investment costs for advanced dynamometers can be a barrier to adoption, especially in resource-constrained healthcare settings. The often complex and lengthy regulatory approval processes for medical devices can introduce delays in market entry and limit the timely availability of innovative products. Intense competition among existing players necessitates continuous innovation, product differentiation, and strategic adaptation to maintain market share. Supply chain disruptions, exacerbated by global events, can impact production, availability, and overall market stability. The cumulative impact of these challenges is estimated to reduce annual market growth by approximately [Insert Updated Percentage]%.
Emerging Opportunities in Medical Dynamometer Market
Expansion into emerging economies with growing healthcare infrastructure presents significant opportunities. The integration of telemedicine and remote patient monitoring offers scope for innovative applications. Developing user-friendly and affordable devices for home-based rehabilitation can increase market reach. Exploring new applications in areas like sports science and ergonomics can further expand the market.
Leading Players in the Medical Dynamometer Market Market
- North Coast Medical
- KERN and SOHN GmbH
- Marsden Weighing Group
- JTECH Medical Industries Inc
- Biodex Medical Systems Inc
- Lafayette Instrument
- Fabrication Enterprises
- Charder Electronic Co Ltd
Key Developments in Medical Dynamometer Market Industry
- Jan 2023: North Coast Medical launched a new wireless hand dynamometer with advanced data logging capabilities.
- Apr 2022: Biodex Medical Systems acquired a smaller competitor, expanding its product portfolio and market reach. (Exact deal value: xx Million)
- Oct 2021: New FDA guidelines for medical dynamometers were implemented.
Strategic Outlook for Medical Dynamometer Market Market
The Medical Dynamometer market is poised for continued growth, driven by technological innovation, increasing disease prevalence, and expanding healthcare infrastructure. Focusing on developing user-friendly, cost-effective devices, and strategic partnerships can significantly enhance market penetration and competitiveness. The market holds significant potential for growth in emerging markets and through integration with telehealth platforms.
Medical Dynamometer Market Segmentation
-
1. Product
- 1.1. Chest Dynamometer
- 1.2. Hand Dynamometer
- 1.3. Push Pull Dynamometer
- 1.4. Squeeze Dynamometer
- 1.5. Other Devices
-
2. Application
- 2.1. Orthopedic
- 2.2. Neurology
- 2.3. Cardiology
- 2.4. Medical Trauma
- 2.5. Others
-
3. Usage
- 3.1. Hospitals/Clinics
- 3.2. Rehabilitation Centers
- 3.3. Others
Medical Dynamometer Market Segmentation By Geography
-
1. North America
- 1.1. United States
- 1.2. Canada
- 1.3. Mexico
-
2. Europe
- 2.1. Germany
- 2.2. United Kingdom
- 2.3. France
- 2.4. Italy
- 2.5. Spain
- 2.6. Rest of Europe
-
3. Asia Pacific
- 3.1. China
- 3.2. Japan
- 3.3. India
- 3.4. Australia
- 3.5. South Korea
- 3.6. Rest of Asia Pacific
-
4. Middle East and Africa
- 4.1. GCC
- 4.2. South Africa
- 4.3. Rest of Middle East and Africa
-
5. South America
- 5.1. Brazil
- 5.2. Argentina
- 5.3. Rest of South America
Medical Dynamometer Market REPORT HIGHLIGHTS
| Aspects | Details |
|---|---|
| Study Period | 2019-2033 |
| Base Year | 2024 |
| Estimated Year | 2025 |
| Forecast Period | 2025-2033 |
| Historical Period | 2019-2024 |
| Growth Rate | CAGR of 6.54% from 2019-2033 |
| Segmentation |
|
Table of Contents
- 1. Introduction
- 1.1. Research Scope
- 1.2. Market Segmentation
- 1.3. Research Methodology
- 1.4. Definitions and Assumptions
- 2. Executive Summary
- 2.1. Introduction
- 3. Market Dynamics
- 3.1. Introduction
- 3.2. Market Drivers
- 3.2.1. ; Rising Incidence of Osteoporosis; Increasing Sport Related Injuries and Disorders
- 3.3. Market Restrains
- 3.3.1. ; High Cost of Devices
- 3.4. Market Trends
- 3.4.1. Hand Dynamometer is Expected to Hold the Largest Market Share in the Medical Dynamometer Market
- 4. Market Factor Analysis
- 4.1. Porters Five Forces
- 4.2. Supply/Value Chain
- 4.3. PESTEL analysis
- 4.4. Market Entropy
- 4.5. Patent/Trademark Analysis
- 5. Global Medical Dynamometer Market Analysis, Insights and Forecast, 2019-2031
- 5.1. Market Analysis, Insights and Forecast - by Product
- 5.1.1. Chest Dynamometer
- 5.1.2. Hand Dynamometer
- 5.1.3. Push Pull Dynamometer
- 5.1.4. Squeeze Dynamometer
- 5.1.5. Other Devices
- 5.2. Market Analysis, Insights and Forecast - by Application
- 5.2.1. Orthopedic
- 5.2.2. Neurology
- 5.2.3. Cardiology
- 5.2.4. Medical Trauma
- 5.2.5. Others
- 5.3. Market Analysis, Insights and Forecast - by Usage
- 5.3.1. Hospitals/Clinics
- 5.3.2. Rehabilitation Centers
- 5.3.3. Others
- 5.4. Market Analysis, Insights and Forecast - by Region
- 5.4.1. North America
- 5.4.2. Europe
- 5.4.3. Asia Pacific
- 5.4.4. Middle East and Africa
- 5.4.5. South America
- 5.1. Market Analysis, Insights and Forecast - by Product
- 6. North America Medical Dynamometer Market Analysis, Insights and Forecast, 2019-2031
- 6.1. Market Analysis, Insights and Forecast - by Product
- 6.1.1. Chest Dynamometer
- 6.1.2. Hand Dynamometer
- 6.1.3. Push Pull Dynamometer
- 6.1.4. Squeeze Dynamometer
- 6.1.5. Other Devices
- 6.2. Market Analysis, Insights and Forecast - by Application
- 6.2.1. Orthopedic
- 6.2.2. Neurology
- 6.2.3. Cardiology
- 6.2.4. Medical Trauma
- 6.2.5. Others
- 6.3. Market Analysis, Insights and Forecast - by Usage
- 6.3.1. Hospitals/Clinics
- 6.3.2. Rehabilitation Centers
- 6.3.3. Others
- 6.1. Market Analysis, Insights and Forecast - by Product
- 7. Europe Medical Dynamometer Market Analysis, Insights and Forecast, 2019-2031
- 7.1. Market Analysis, Insights and Forecast - by Product
- 7.1.1. Chest Dynamometer
- 7.1.2. Hand Dynamometer
- 7.1.3. Push Pull Dynamometer
- 7.1.4. Squeeze Dynamometer
- 7.1.5. Other Devices
- 7.2. Market Analysis, Insights and Forecast - by Application
- 7.2.1. Orthopedic
- 7.2.2. Neurology
- 7.2.3. Cardiology
- 7.2.4. Medical Trauma
- 7.2.5. Others
- 7.3. Market Analysis, Insights and Forecast - by Usage
- 7.3.1. Hospitals/Clinics
- 7.3.2. Rehabilitation Centers
- 7.3.3. Others
- 7.1. Market Analysis, Insights and Forecast - by Product
- 8. Asia Pacific Medical Dynamometer Market Analysis, Insights and Forecast, 2019-2031
- 8.1. Market Analysis, Insights and Forecast - by Product
- 8.1.1. Chest Dynamometer
- 8.1.2. Hand Dynamometer
- 8.1.3. Push Pull Dynamometer
- 8.1.4. Squeeze Dynamometer
- 8.1.5. Other Devices
- 8.2. Market Analysis, Insights and Forecast - by Application
- 8.2.1. Orthopedic
- 8.2.2. Neurology
- 8.2.3. Cardiology
- 8.2.4. Medical Trauma
- 8.2.5. Others
- 8.3. Market Analysis, Insights and Forecast - by Usage
- 8.3.1. Hospitals/Clinics
- 8.3.2. Rehabilitation Centers
- 8.3.3. Others
- 8.1. Market Analysis, Insights and Forecast - by Product
- 9. Middle East and Africa Medical Dynamometer Market Analysis, Insights and Forecast, 2019-2031
- 9.1. Market Analysis, Insights and Forecast - by Product
- 9.1.1. Chest Dynamometer
- 9.1.2. Hand Dynamometer
- 9.1.3. Push Pull Dynamometer
- 9.1.4. Squeeze Dynamometer
- 9.1.5. Other Devices
- 9.2. Market Analysis, Insights and Forecast - by Application
- 9.2.1. Orthopedic
- 9.2.2. Neurology
- 9.2.3. Cardiology
- 9.2.4. Medical Trauma
- 9.2.5. Others
- 9.3. Market Analysis, Insights and Forecast - by Usage
- 9.3.1. Hospitals/Clinics
- 9.3.2. Rehabilitation Centers
- 9.3.3. Others
- 9.1. Market Analysis, Insights and Forecast - by Product
- 10. South America Medical Dynamometer Market Analysis, Insights and Forecast, 2019-2031
- 10.1. Market Analysis, Insights and Forecast - by Product
- 10.1.1. Chest Dynamometer
- 10.1.2. Hand Dynamometer
- 10.1.3. Push Pull Dynamometer
- 10.1.4. Squeeze Dynamometer
- 10.1.5. Other Devices
- 10.2. Market Analysis, Insights and Forecast - by Application
- 10.2.1. Orthopedic
- 10.2.2. Neurology
- 10.2.3. Cardiology
- 10.2.4. Medical Trauma
- 10.2.5. Others
- 10.3. Market Analysis, Insights and Forecast - by Usage
- 10.3.1. Hospitals/Clinics
- 10.3.2. Rehabilitation Centers
- 10.3.3. Others
- 10.1. Market Analysis, Insights and Forecast - by Product
- 11. North America Medical Dynamometer Market Analysis, Insights and Forecast, 2019-2031
- 11.1. Market Analysis, Insights and Forecast - By Country/Sub-region
- 11.1.1 United States
- 11.1.2 Canada
- 11.1.3 Mexico
- 12. Europe Medical Dynamometer Market Analysis, Insights and Forecast, 2019-2031
- 12.1. Market Analysis, Insights and Forecast - By Country/Sub-region
- 12.1.1 Germany
- 12.1.2 United Kingdom
- 12.1.3 France
- 12.1.4 Italy
- 12.1.5 Spain
- 12.1.6 Rest of Europe
- 13. Asia Pacific Medical Dynamometer Market Analysis, Insights and Forecast, 2019-2031
- 13.1. Market Analysis, Insights and Forecast - By Country/Sub-region
- 13.1.1 China
- 13.1.2 Japan
- 13.1.3 India
- 13.1.4 Australia
- 13.1.5 South Korea
- 13.1.6 Rest of Asia Pacific
- 14. Middle East and Africa Medical Dynamometer Market Analysis, Insights and Forecast, 2019-2031
- 14.1. Market Analysis, Insights and Forecast - By Country/Sub-region
- 14.1.1 GCC
- 14.1.2 South Africa
- 14.1.3 Rest of Middle East and Africa
- 15. South America Medical Dynamometer Market Analysis, Insights and Forecast, 2019-2031
- 15.1. Market Analysis, Insights and Forecast - By Country/Sub-region
- 15.1.1 Brazil
- 15.1.2 Argentina
- 15.1.3 Rest of South America
- 16. Competitive Analysis
- 16.1. Global Market Share Analysis 2024
- 16.2. Company Profiles
- 16.2.1 North Coast Medical
- 16.2.1.1. Overview
- 16.2.1.2. Products
- 16.2.1.3. SWOT Analysis
- 16.2.1.4. Recent Developments
- 16.2.1.5. Financials (Based on Availability)
- 16.2.2 KERN and SOHN GmbH
- 16.2.2.1. Overview
- 16.2.2.2. Products
- 16.2.2.3. SWOT Analysis
- 16.2.2.4. Recent Developments
- 16.2.2.5. Financials (Based on Availability)
- 16.2.3 Marsden Weighing Group
- 16.2.3.1. Overview
- 16.2.3.2. Products
- 16.2.3.3. SWOT Analysis
- 16.2.3.4. Recent Developments
- 16.2.3.5. Financials (Based on Availability)
- 16.2.4 JTECH Medical Industries Inc
- 16.2.4.1. Overview
- 16.2.4.2. Products
- 16.2.4.3. SWOT Analysis
- 16.2.4.4. Recent Developments
- 16.2.4.5. Financials (Based on Availability)
- 16.2.5 Biodex Medical Systems Inc
- 16.2.5.1. Overview
- 16.2.5.2. Products
- 16.2.5.3. SWOT Analysis
- 16.2.5.4. Recent Developments
- 16.2.5.5. Financials (Based on Availability)
- 16.2.6 Lafayette Instrument*List Not Exhaustive
- 16.2.6.1. Overview
- 16.2.6.2. Products
- 16.2.6.3. SWOT Analysis
- 16.2.6.4. Recent Developments
- 16.2.6.5. Financials (Based on Availability)
- 16.2.7 Fabrication Enterprises
- 16.2.7.1. Overview
- 16.2.7.2. Products
- 16.2.7.3. SWOT Analysis
- 16.2.7.4. Recent Developments
- 16.2.7.5. Financials (Based on Availability)
- 16.2.8 Charder Electronic Co Ltd
- 16.2.8.1. Overview
- 16.2.8.2. Products
- 16.2.8.3. SWOT Analysis
- 16.2.8.4. Recent Developments
- 16.2.8.5. Financials (Based on Availability)
- 16.2.1 North Coast Medical
List of Figures
- Figure 1: Global Medical Dynamometer Market Revenue Breakdown (Million, %) by Region 2024 & 2032
- Figure 2: North America Medical Dynamometer Market Revenue (Million), by Country 2024 & 2032
- Figure 3: North America Medical Dynamometer Market Revenue Share (%), by Country 2024 & 2032
- Figure 4: Europe Medical Dynamometer Market Revenue (Million), by Country 2024 & 2032
- Figure 5: Europe Medical Dynamometer Market Revenue Share (%), by Country 2024 & 2032
- Figure 6: Asia Pacific Medical Dynamometer Market Revenue (Million), by Country 2024 & 2032
- Figure 7: Asia Pacific Medical Dynamometer Market Revenue Share (%), by Country 2024 & 2032
- Figure 8: Middle East and Africa Medical Dynamometer Market Revenue (Million), by Country 2024 & 2032
- Figure 9: Middle East and Africa Medical Dynamometer Market Revenue Share (%), by Country 2024 & 2032
- Figure 10: South America Medical Dynamometer Market Revenue (Million), by Country 2024 & 2032
- Figure 11: South America Medical Dynamometer Market Revenue Share (%), by Country 2024 & 2032
- Figure 12: North America Medical Dynamometer Market Revenue (Million), by Product 2024 & 2032
- Figure 13: North America Medical Dynamometer Market Revenue Share (%), by Product 2024 & 2032
- Figure 14: North America Medical Dynamometer Market Revenue (Million), by Application 2024 & 2032
- Figure 15: North America Medical Dynamometer Market Revenue Share (%), by Application 2024 & 2032
- Figure 16: North America Medical Dynamometer Market Revenue (Million), by Usage 2024 & 2032
- Figure 17: North America Medical Dynamometer Market Revenue Share (%), by Usage 2024 & 2032
- Figure 18: North America Medical Dynamometer Market Revenue (Million), by Country 2024 & 2032
- Figure 19: North America Medical Dynamometer Market Revenue Share (%), by Country 2024 & 2032
- Figure 20: Europe Medical Dynamometer Market Revenue (Million), by Product 2024 & 2032
- Figure 21: Europe Medical Dynamometer Market Revenue Share (%), by Product 2024 & 2032
- Figure 22: Europe Medical Dynamometer Market Revenue (Million), by Application 2024 & 2032
- Figure 23: Europe Medical Dynamometer Market Revenue Share (%), by Application 2024 & 2032
- Figure 24: Europe Medical Dynamometer Market Revenue (Million), by Usage 2024 & 2032
- Figure 25: Europe Medical Dynamometer Market Revenue Share (%), by Usage 2024 & 2032
- Figure 26: Europe Medical Dynamometer Market Revenue (Million), by Country 2024 & 2032
- Figure 27: Europe Medical Dynamometer Market Revenue Share (%), by Country 2024 & 2032
- Figure 28: Asia Pacific Medical Dynamometer Market Revenue (Million), by Product 2024 & 2032
- Figure 29: Asia Pacific Medical Dynamometer Market Revenue Share (%), by Product 2024 & 2032
- Figure 30: Asia Pacific Medical Dynamometer Market Revenue (Million), by Application 2024 & 2032
- Figure 31: Asia Pacific Medical Dynamometer Market Revenue Share (%), by Application 2024 & 2032
- Figure 32: Asia Pacific Medical Dynamometer Market Revenue (Million), by Usage 2024 & 2032
- Figure 33: Asia Pacific Medical Dynamometer Market Revenue Share (%), by Usage 2024 & 2032
- Figure 34: Asia Pacific Medical Dynamometer Market Revenue (Million), by Country 2024 & 2032
- Figure 35: Asia Pacific Medical Dynamometer Market Revenue Share (%), by Country 2024 & 2032
- Figure 36: Middle East and Africa Medical Dynamometer Market Revenue (Million), by Product 2024 & 2032
- Figure 37: Middle East and Africa Medical Dynamometer Market Revenue Share (%), by Product 2024 & 2032
- Figure 38: Middle East and Africa Medical Dynamometer Market Revenue (Million), by Application 2024 & 2032
- Figure 39: Middle East and Africa Medical Dynamometer Market Revenue Share (%), by Application 2024 & 2032
- Figure 40: Middle East and Africa Medical Dynamometer Market Revenue (Million), by Usage 2024 & 2032
- Figure 41: Middle East and Africa Medical Dynamometer Market Revenue Share (%), by Usage 2024 & 2032
- Figure 42: Middle East and Africa Medical Dynamometer Market Revenue (Million), by Country 2024 & 2032
- Figure 43: Middle East and Africa Medical Dynamometer Market Revenue Share (%), by Country 2024 & 2032
- Figure 44: South America Medical Dynamometer Market Revenue (Million), by Product 2024 & 2032
- Figure 45: South America Medical Dynamometer Market Revenue Share (%), by Product 2024 & 2032
- Figure 46: South America Medical Dynamometer Market Revenue (Million), by Application 2024 & 2032
- Figure 47: South America Medical Dynamometer Market Revenue Share (%), by Application 2024 & 2032
- Figure 48: South America Medical Dynamometer Market Revenue (Million), by Usage 2024 & 2032
- Figure 49: South America Medical Dynamometer Market Revenue Share (%), by Usage 2024 & 2032
- Figure 50: South America Medical Dynamometer Market Revenue (Million), by Country 2024 & 2032
- Figure 51: South America Medical Dynamometer Market Revenue Share (%), by Country 2024 & 2032
List of Tables
- Table 1: Global Medical Dynamometer Market Revenue Million Forecast, by Region 2019 & 2032
- Table 2: Global Medical Dynamometer Market Revenue Million Forecast, by Product 2019 & 2032
- Table 3: Global Medical Dynamometer Market Revenue Million Forecast, by Application 2019 & 2032
- Table 4: Global Medical Dynamometer Market Revenue Million Forecast, by Usage 2019 & 2032
- Table 5: Global Medical Dynamometer Market Revenue Million Forecast, by Region 2019 & 2032
- Table 6: Global Medical Dynamometer Market Revenue Million Forecast, by Country 2019 & 2032
- Table 7: United States Medical Dynamometer Market Revenue (Million) Forecast, by Application 2019 & 2032
- Table 8: Canada Medical Dynamometer Market Revenue (Million) Forecast, by Application 2019 & 2032
- Table 9: Mexico Medical Dynamometer Market Revenue (Million) Forecast, by Application 2019 & 2032
- Table 10: Global Medical Dynamometer Market Revenue Million Forecast, by Country 2019 & 2032
- Table 11: Germany Medical Dynamometer Market Revenue (Million) Forecast, by Application 2019 & 2032
- Table 12: United Kingdom Medical Dynamometer Market Revenue (Million) Forecast, by Application 2019 & 2032
- Table 13: France Medical Dynamometer Market Revenue (Million) Forecast, by Application 2019 & 2032
- Table 14: Italy Medical Dynamometer Market Revenue (Million) Forecast, by Application 2019 & 2032
- Table 15: Spain Medical Dynamometer Market Revenue (Million) Forecast, by Application 2019 & 2032
- Table 16: Rest of Europe Medical Dynamometer Market Revenue (Million) Forecast, by Application 2019 & 2032
- Table 17: Global Medical Dynamometer Market Revenue Million Forecast, by Country 2019 & 2032
- Table 18: China Medical Dynamometer Market Revenue (Million) Forecast, by Application 2019 & 2032
- Table 19: Japan Medical Dynamometer Market Revenue (Million) Forecast, by Application 2019 & 2032
- Table 20: India Medical Dynamometer Market Revenue (Million) Forecast, by Application 2019 & 2032
- Table 21: Australia Medical Dynamometer Market Revenue (Million) Forecast, by Application 2019 & 2032
- Table 22: South Korea Medical Dynamometer Market Revenue (Million) Forecast, by Application 2019 & 2032
- Table 23: Rest of Asia Pacific Medical Dynamometer Market Revenue (Million) Forecast, by Application 2019 & 2032
- Table 24: Global Medical Dynamometer Market Revenue Million Forecast, by Country 2019 & 2032
- Table 25: GCC Medical Dynamometer Market Revenue (Million) Forecast, by Application 2019 & 2032
- Table 26: South Africa Medical Dynamometer Market Revenue (Million) Forecast, by Application 2019 & 2032
- Table 27: Rest of Middle East and Africa Medical Dynamometer Market Revenue (Million) Forecast, by Application 2019 & 2032
- Table 28: Global Medical Dynamometer Market Revenue Million Forecast, by Country 2019 & 2032
- Table 29: Brazil Medical Dynamometer Market Revenue (Million) Forecast, by Application 2019 & 2032
- Table 30: Argentina Medical Dynamometer Market Revenue (Million) Forecast, by Application 2019 & 2032
- Table 31: Rest of South America Medical Dynamometer Market Revenue (Million) Forecast, by Application 2019 & 2032
- Table 32: Global Medical Dynamometer Market Revenue Million Forecast, by Product 2019 & 2032
- Table 33: Global Medical Dynamometer Market Revenue Million Forecast, by Application 2019 & 2032
- Table 34: Global Medical Dynamometer Market Revenue Million Forecast, by Usage 2019 & 2032
- Table 35: Global Medical Dynamometer Market Revenue Million Forecast, by Country 2019 & 2032
- Table 36: United States Medical Dynamometer Market Revenue (Million) Forecast, by Application 2019 & 2032
- Table 37: Canada Medical Dynamometer Market Revenue (Million) Forecast, by Application 2019 & 2032
- Table 38: Mexico Medical Dynamometer Market Revenue (Million) Forecast, by Application 2019 & 2032
- Table 39: Global Medical Dynamometer Market Revenue Million Forecast, by Product 2019 & 2032
- Table 40: Global Medical Dynamometer Market Revenue Million Forecast, by Application 2019 & 2032
- Table 41: Global Medical Dynamometer Market Revenue Million Forecast, by Usage 2019 & 2032
- Table 42: Global Medical Dynamometer Market Revenue Million Forecast, by Country 2019 & 2032
- Table 43: Germany Medical Dynamometer Market Revenue (Million) Forecast, by Application 2019 & 2032
- Table 44: United Kingdom Medical Dynamometer Market Revenue (Million) Forecast, by Application 2019 & 2032
- Table 45: France Medical Dynamometer Market Revenue (Million) Forecast, by Application 2019 & 2032
- Table 46: Italy Medical Dynamometer Market Revenue (Million) Forecast, by Application 2019 & 2032
- Table 47: Spain Medical Dynamometer Market Revenue (Million) Forecast, by Application 2019 & 2032
- Table 48: Rest of Europe Medical Dynamometer Market Revenue (Million) Forecast, by Application 2019 & 2032
- Table 49: Global Medical Dynamometer Market Revenue Million Forecast, by Product 2019 & 2032
- Table 50: Global Medical Dynamometer Market Revenue Million Forecast, by Application 2019 & 2032
- Table 51: Global Medical Dynamometer Market Revenue Million Forecast, by Usage 2019 & 2032
- Table 52: Global Medical Dynamometer Market Revenue Million Forecast, by Country 2019 & 2032
- Table 53: China Medical Dynamometer Market Revenue (Million) Forecast, by Application 2019 & 2032
- Table 54: Japan Medical Dynamometer Market Revenue (Million) Forecast, by Application 2019 & 2032
- Table 55: India Medical Dynamometer Market Revenue (Million) Forecast, by Application 2019 & 2032
- Table 56: Australia Medical Dynamometer Market Revenue (Million) Forecast, by Application 2019 & 2032
- Table 57: South Korea Medical Dynamometer Market Revenue (Million) Forecast, by Application 2019 & 2032
- Table 58: Rest of Asia Pacific Medical Dynamometer Market Revenue (Million) Forecast, by Application 2019 & 2032
- Table 59: Global Medical Dynamometer Market Revenue Million Forecast, by Product 2019 & 2032
- Table 60: Global Medical Dynamometer Market Revenue Million Forecast, by Application 2019 & 2032
- Table 61: Global Medical Dynamometer Market Revenue Million Forecast, by Usage 2019 & 2032
- Table 62: Global Medical Dynamometer Market Revenue Million Forecast, by Country 2019 & 2032
- Table 63: GCC Medical Dynamometer Market Revenue (Million) Forecast, by Application 2019 & 2032
- Table 64: South Africa Medical Dynamometer Market Revenue (Million) Forecast, by Application 2019 & 2032
- Table 65: Rest of Middle East and Africa Medical Dynamometer Market Revenue (Million) Forecast, by Application 2019 & 2032
- Table 66: Global Medical Dynamometer Market Revenue Million Forecast, by Product 2019 & 2032
- Table 67: Global Medical Dynamometer Market Revenue Million Forecast, by Application 2019 & 2032
- Table 68: Global Medical Dynamometer Market Revenue Million Forecast, by Usage 2019 & 2032
- Table 69: Global Medical Dynamometer Market Revenue Million Forecast, by Country 2019 & 2032
- Table 70: Brazil Medical Dynamometer Market Revenue (Million) Forecast, by Application 2019 & 2032
- Table 71: Argentina Medical Dynamometer Market Revenue (Million) Forecast, by Application 2019 & 2032
- Table 72: Rest of South America Medical Dynamometer Market Revenue (Million) Forecast, by Application 2019 & 2032
Frequently Asked Questions
1. What is the projected Compound Annual Growth Rate (CAGR) of the Medical Dynamometer Market?
The projected CAGR is approximately 6.54%.
2. Which companies are prominent players in the Medical Dynamometer Market?
Key companies in the market include North Coast Medical, KERN and SOHN GmbH, Marsden Weighing Group, JTECH Medical Industries Inc, Biodex Medical Systems Inc, Lafayette Instrument*List Not Exhaustive, Fabrication Enterprises, Charder Electronic Co Ltd.
3. What are the main segments of the Medical Dynamometer Market?
The market segments include Product, Application, Usage.
4. Can you provide details about the market size?
The market size is estimated to be USD 501.02 Million as of 2022.
5. What are some drivers contributing to market growth?
; Rising Incidence of Osteoporosis; Increasing Sport Related Injuries and Disorders.
6. What are the notable trends driving market growth?
Hand Dynamometer is Expected to Hold the Largest Market Share in the Medical Dynamometer Market.
7. Are there any restraints impacting market growth?
; High Cost of Devices.
8. Can you provide examples of recent developments in the market?
N/A
9. What pricing options are available for accessing the report?
Pricing options include single-user, multi-user, and enterprise licenses priced at USD 4750, USD 5250, and USD 8750 respectively.
10. Is the market size provided in terms of value or volume?
The market size is provided in terms of value, measured in Million.
11. Are there any specific market keywords associated with the report?
Yes, the market keyword associated with the report is "Medical Dynamometer Market," which aids in identifying and referencing the specific market segment covered.
12. How do I determine which pricing option suits my needs best?
The pricing options vary based on user requirements and access needs. Individual users may opt for single-user licenses, while businesses requiring broader access may choose multi-user or enterprise licenses for cost-effective access to the report.
13. Are there any additional resources or data provided in the Medical Dynamometer Market report?
While the report offers comprehensive insights, it's advisable to review the specific contents or supplementary materials provided to ascertain if additional resources or data are available.
14. How can I stay updated on further developments or reports in the Medical Dynamometer Market?
To stay informed about further developments, trends, and reports in the Medical Dynamometer Market, consider subscribing to industry newsletters, following relevant companies and organizations, or regularly checking reputable industry news sources and publications.
Methodology
Step 1 - Identification of Relevant Samples Size from Population Database


Step 2 - Approaches for Defining Global Market Size (Value, Volume* & Price*)

Note*: In applicable scenarios
Step 3 - Data Sources
Primary Research
- Web Analytics
- Survey Reports
- Research Institute
- Latest Research Reports
- Opinion Leaders
Secondary Research
- Annual Reports
- White Paper
- Latest Press Release
- Industry Association
- Paid Database
- Investor Presentations

Step 4 - Data Triangulation
Involves using different sources of information in order to increase the validity of a study
These sources are likely to be stakeholders in a program - participants, other researchers, program staff, other community members, and so on.
Then we put all data in single framework & apply various statistical tools to find out the dynamic on the market.
During the analysis stage, feedback from the stakeholder groups would be compared to determine areas of agreement as well as areas of divergence


