

Key Insights
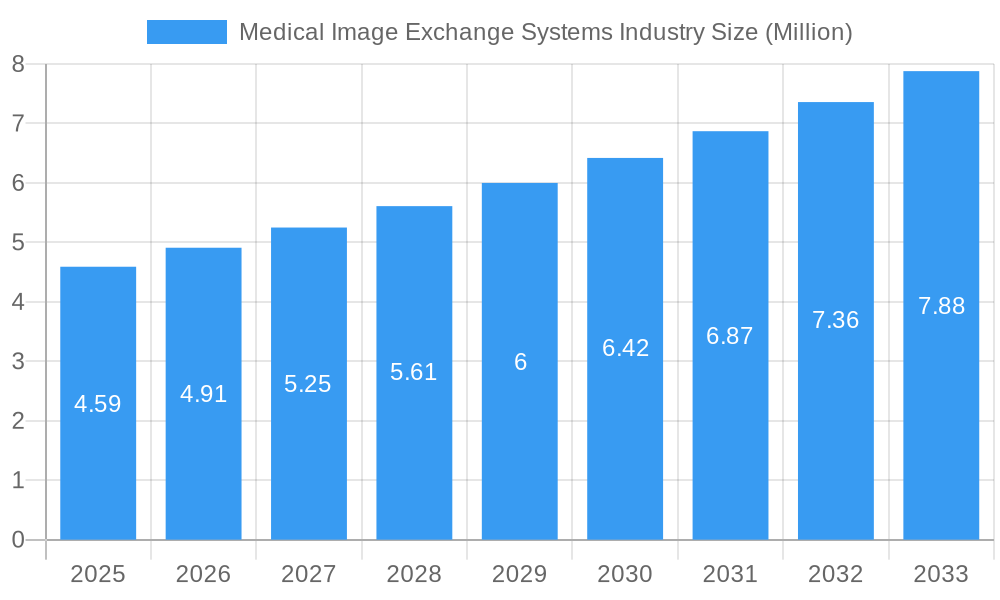
The global Medical Image Exchange Systems market is poised for robust expansion, projected to reach approximately \$4.59 million in 2025 and ascend at a Compound Annual Growth Rate (CAGR) of 6.96% through 2033. This significant growth is primarily fueled by the escalating adoption of digital imaging technologies, the increasing demand for interoperability between healthcare providers, and the growing emphasis on value-based care models that necessitate seamless data sharing. The evolution of cloud-based solutions is a pivotal trend, offering enhanced scalability, accessibility, and cost-effectiveness for medical image management and exchange. Furthermore, the rising prevalence of chronic diseases and the aging global population are driving a greater need for efficient diagnostic processes and collaborative patient care, directly impacting the demand for advanced image exchange platforms. Government initiatives promoting health information exchange and the increasing investments in healthcare IT infrastructure across developed and emerging economies are also acting as significant catalysts for market expansion.
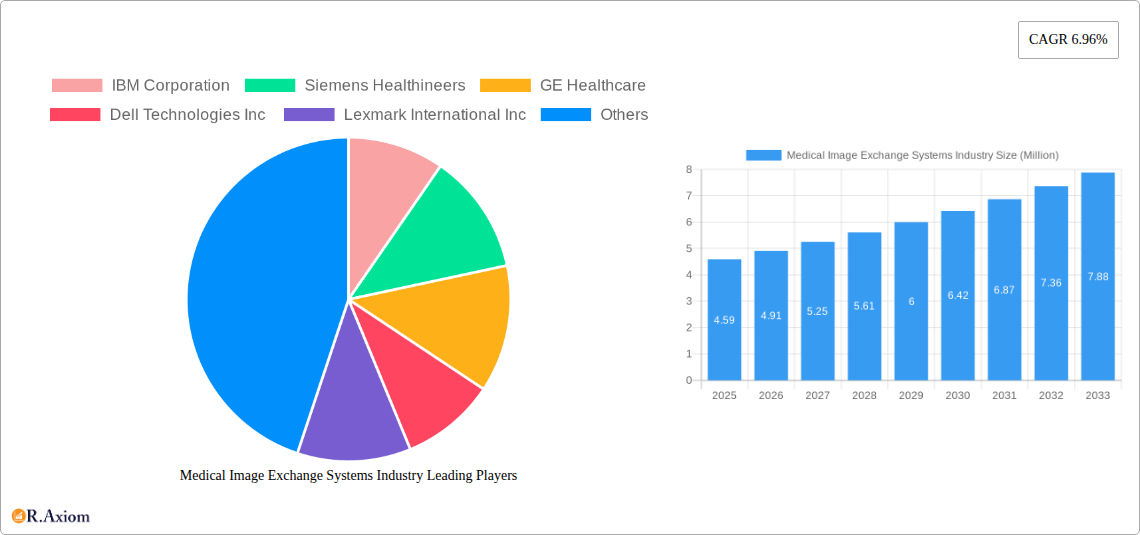
Medical Image Exchange Systems Industry Market Size (In Million)
Despite the promising outlook, certain factors present challenges to the market's full potential. Stringent data privacy regulations, such as HIPAA and GDPR, require substantial investment in security infrastructure and compliance measures, which can be a barrier for smaller healthcare facilities. The high initial cost of implementing sophisticated image exchange systems and the need for extensive training to ensure proper utilization also pose considerable restraints. However, the undeniable benefits of improved diagnostic accuracy, reduced healthcare costs through efficient workflow, and enhanced patient outcomes continue to drive innovation and adoption. Key market segments, including Vendor Neutral Archives (VNAs) and Picture Archiving and Communications Systems (PACS), are witnessing substantial development, with hospitals and diagnostic centers being the dominant end-users. Leading players like IBM Corporation, Siemens Healthineers, GE Healthcare, and Koninklijke Philips NV are actively engaged in research and development, offering advanced solutions to address the evolving needs of the healthcare industry.
Medical Image Exchange Systems Industry Company Market Share
Medical Image Exchange Systems Industry Market Concentration & Innovation
The Medical Image Exchange Systems industry exhibits a moderate to high market concentration, driven by a few dominant players like GE Healthcare, Siemens Healthineers, and Koninklijke Philips NV, alongside key innovators such as Intelerad Medical Systems and BridgeHead Software. Innovation is a primary driver, fueled by the increasing demand for interoperable and secure sharing of medical imaging data. Regulatory frameworks, including HIPAA in the US and GDPR in Europe, are shaping product development towards enhanced data privacy and security. Product substitutes, while present in legacy systems, are increasingly being phased out as the industry prioritizes integrated digital solutions. End-user trends, particularly the shift towards value-based care and the growing adoption of cloud-based solutions, are accelerating market evolution. Merger and acquisition (M&A) activities are strategic, with companies aiming to expand their product portfolios, geographic reach, and technological capabilities. For instance, significant M&A deals in the broader healthcare IT sector underscore a trend towards consolidation and the acquisition of specialized imaging informatics expertise. The market share of leading vendors is estimated to be substantial, with the top five players collectively holding over 70% of the market. M&A deal values are consistently in the hundreds of millions of dollars, reflecting the strategic importance of these acquisitions in consolidating market positions and driving innovation.
Medical Image Exchange Systems Industry Industry Trends & Insights
The Medical Image Exchange Systems industry is poised for significant growth, propelled by an escalating need for efficient, secure, and interoperable sharing of diagnostic imaging data across healthcare providers. This burgeoning market is witnessing a robust Compound Annual Growth Rate (CAGR) estimated at over 12% during the forecast period of 2025–2033. The increasing volume of medical imaging procedures, driven by an aging global population and the rising incidence of chronic diseases, directly translates to a greater demand for sophisticated image exchange solutions. Technological advancements, particularly in cloud computing, artificial intelligence (AI), and machine learning (ML), are revolutionizing the landscape. AI and ML algorithms are being integrated into image exchange platforms to enable advanced analytics, automated image interpretation, and improved diagnostic accuracy. The shift towards value-based care models necessitates seamless data sharing and collaboration among multidisciplinary care teams, making robust medical image exchange systems indispensable for coordinated patient management and improved clinical outcomes.
Consumer preferences are increasingly leaning towards digital-first healthcare experiences, including the ability for patients to access and share their medical imaging records conveniently. This evolving patient expectation is pushing healthcare organizations to adopt more user-friendly and accessible image exchange solutions. Furthermore, the growing adoption of telemedicine and remote patient monitoring services is creating a parallel demand for effective medical image exchange capabilities, allowing specialists to remotely access and analyze imaging data. Competitive dynamics within the industry are characterized by both established healthcare IT giants and agile startups vying for market share. Companies are investing heavily in research and development to offer comprehensive enterprise imaging solutions that encompass PACS, Vendor Neutral Archives (VNAs), and advanced analytics. Strategic partnerships and collaborations are also becoming commonplace, as organizations seek to leverage each other's expertise and expand their market reach. The penetration of advanced medical image exchange systems is steadily increasing, with an estimated market penetration rate of over 60% in developed economies, while emerging markets are showing rapid adoption trajectories. This trend is further amplified by increasing healthcare IT spending globally and the drive for digital transformation within healthcare institutions.
Dominant Markets & Segments in Medical Image Exchange Systems Industry
The Medical Image Exchange Systems industry's dominance is clearly demarcated across regions and system types, with a strong emphasis on developed economies and core system functionalities.
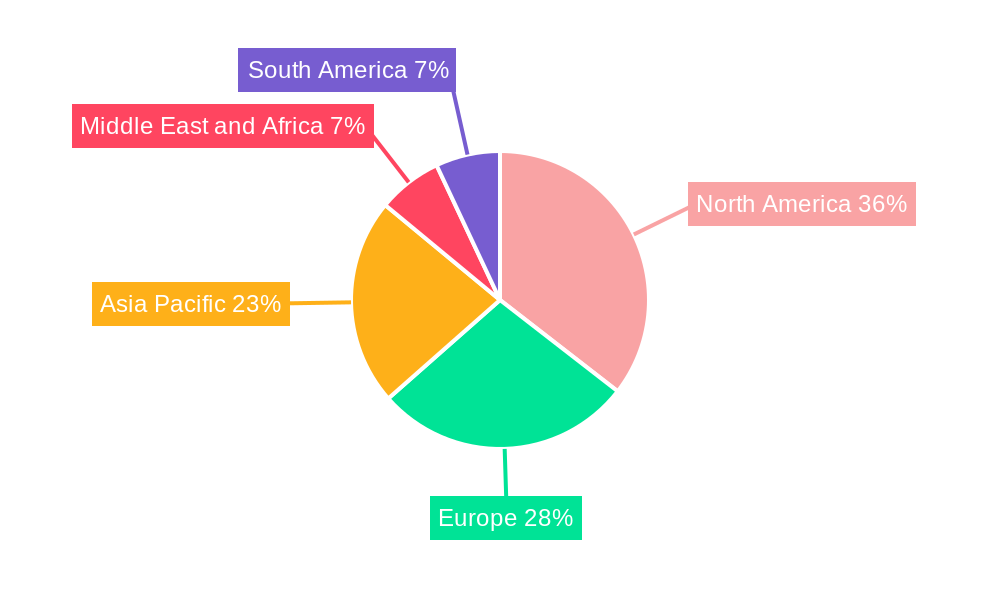
Dominant Regions & Countries
- North America: This region consistently leads the market due to early adoption of advanced healthcare technologies, robust healthcare infrastructure, high per capita healthcare spending, and stringent regulatory mandates that encourage interoperability and data security. The United States, in particular, is a powerhouse, driven by a large patient population, a high concentration of advanced diagnostic centers and hospitals, and significant investment in healthcare IT modernization.
- Europe: Western European countries, including Germany, the United Kingdom, and France, represent another significant market. Factors contributing to their dominance include strong government initiatives for digital health transformation, an aging population, and a well-established healthcare system that prioritizes advanced diagnostic capabilities.
- Asia Pacific: This region is emerging as a high-growth market, driven by increasing healthcare expenditure, a rapidly expanding middle class, growing awareness of advanced medical diagnostics, and government investments in improving healthcare infrastructure, particularly in countries like China and India.
Dominant Segments
System: Picture Archiving and Communications System (PACS)
- Market Penetration: PACS remains a foundational component of medical imaging departments and enjoys the highest market penetration. Its critical role in storing, retrieving, and distributing medical images makes it indispensable for virtually all healthcare facilities involved in diagnostic imaging.
- Key Drivers: The increasing volume of medical imaging studies, the need for efficient image access for radiologists and referring physicians, and regulatory compliance requirements for image archiving are key drivers for PACS market dominance.
- Competitive Landscape: While mature, the PACS market continues to see innovation in areas like cloud-based PACS and AI integration for image analysis, maintaining its relevance.
System: Vendor Neutral Archive (VNA)
- Market Growth: VNAs are experiencing rapid growth as healthcare organizations move towards consolidating their disparate imaging data from multiple PACS and other systems into a single, accessible repository.
- Key Drivers: The need to overcome vendor lock-in, facilitate interoperability between different imaging modalities and departments, and support enterprise-wide access to imaging data are major growth catalysts for VNAs.
- Future Outlook: VNAs are increasingly becoming the preferred solution for long-term image archiving and data management in modern healthcare enterprises.
End-User: Hospitals
- Market Dominance: Hospitals, ranging from large academic medical centers to smaller community hospitals, represent the largest end-user segment.
- Key Drivers: Their comprehensive diagnostic imaging needs, large patient volumes, diverse imaging modalities, and the imperative to integrate imaging data into the broader Electronic Health Record (EHR) system make them the primary consumers of medical image exchange systems.
- Adoption Trends: Hospitals are at the forefront of adopting advanced solutions like enterprise imaging platforms, VNAs, and cloud-based PACS to streamline workflows and improve patient care.
End-User: Diagnostic Centers
- Significant Market Share: Independent diagnostic centers and imaging facilities constitute a substantial segment, driven by their specialization in imaging services.
- Key Drivers: Their focus on efficiency, accuracy, and timely reporting makes them keen adopters of PACS and image exchange solutions that enhance workflow and facilitate communication with referring physicians.
- Growth Factors: The increasing demand for outsourced diagnostic imaging services further bolsters the market for these centers and, consequently, their need for robust image exchange systems.
Medical Image Exchange Systems Industry Product Developments
The Medical Image Exchange Systems industry is characterized by continuous product innovation aimed at enhancing interoperability, security, and workflow efficiency. Key developments include the introduction of cloud-native enterprise imaging solutions, enabling scalable storage and access to medical images from anywhere. Advancements in AI and ML are being integrated to offer automated image analysis, workflow optimization, and predictive diagnostics, providing radiologists with powerful tools to improve accuracy and speed. Furthermore, the development of more robust cybersecurity features and compliance tools is crucial for safeguarding sensitive patient data, a critical aspect for market adoption. These innovations are driving competitive advantages by enabling healthcare providers to achieve seamless data integration, reduce operational costs, and ultimately improve patient care outcomes.
Report Scope & Segmentation Analysis
This report provides a comprehensive analysis of the Medical Image Exchange Systems industry, segmented by key systems and end-users.
The System segmentation includes:
- Vendor Neutral Archive (VNA): Expected to witness significant growth, driven by the need for consolidated and accessible imaging data. Market size is projected to reach over $5,000 Million by 2033, with a CAGR of over 13%.
- Picture Archiving and Communications System (PACS): Remains a dominant segment, crucial for image storage and retrieval. Market size is estimated to exceed $8,000 Million by 2033, with a steady CAGR of approximately 10%.
- Other Systems: Encompasses various related software and hardware solutions that support image exchange, expected to grow at a CAGR of around 11%.
The End-User segmentation includes:
- Hospitals: The largest segment, driven by extensive imaging needs and the drive for integrated healthcare IT. Projected to account for over 60% of the market share by 2033.
- Diagnostic Centers: A substantial and growing segment, focused on specialized imaging services. Expected to demonstrate a CAGR of over 12%.
- Ambulatory Surgery Centers: A niche but rapidly expanding segment, with increasing adoption of imaging technologies for pre- and post-operative assessments.
Key Drivers of Medical Image Exchange Systems Industry Growth
The Medical Image Exchange Systems industry's growth is primarily propelled by several synergistic factors. The increasing volume of medical imaging procedures, fueled by an aging global population and the rise in chronic diseases, directly translates to a greater need for efficient data management and sharing. Technological advancements, particularly in cloud computing and artificial intelligence, are enabling more sophisticated, accessible, and cost-effective solutions. The growing emphasis on value-based care necessitates seamless data interoperability for coordinated patient management and improved clinical outcomes. Furthermore, government initiatives and regulatory mandates promoting digital health and data exchange are creating a favorable environment for market expansion. The shift towards telemedicine and remote patient monitoring also creates a demand for robust image exchange capabilities.
Challenges in the Medical Image Exchange Systems Industry Sector
Despite robust growth prospects, the Medical Image Exchange Systems industry faces several significant challenges. Interoperability issues between disparate healthcare IT systems and legacy platforms continue to be a major hurdle, hindering seamless data flow. High implementation costs and complex integration processes can be prohibitive for smaller healthcare facilities. Stringent data privacy and security regulations, while essential, add complexity and cost to development and deployment. The shortage of skilled IT professionals with expertise in healthcare informatics also poses a challenge. Resistance to change and entrenched workflows within healthcare organizations can slow down the adoption of new technologies. The ever-evolving threat landscape of cyberattacks necessitates continuous investment in advanced security measures, impacting overall costs.
Emerging Opportunities in Medical Image Exchange Systems Industry
The Medical Image Exchange Systems industry is ripe with emerging opportunities. The expansion of AI and machine learning capabilities within these systems presents a significant avenue for growth, offering enhanced diagnostic support, workflow automation, and predictive analytics. The increasing adoption of cloud-based solutions provides scalable, cost-effective, and accessible platforms for image exchange and storage. The global push for digital health transformation in emerging economies offers vast untapped market potential. Furthermore, the growing demand for interoperable solutions that support telemedicine and remote patient care creates a niche for specialized image exchange platforms. The integration of blockchain technology for enhanced security and transparency in data sharing is another promising area.
Leading Players in the Medical Image Exchange Systems Industry Market
- IBM Corporation
- Siemens Healthineers
- GE Healthcare
- Dell Technologies Inc
- Lexmark International Inc
- BridgeHead Software
- Koninklijke Philips NV
- Carestream Health Inc (Onex Corporation)
- McKesson Corporation
- Novarad Corporation
- Agfa-Gevaert Group
- Fujifilm Holdings Corporation
Key Developments in Medical Image Exchange Systems Industry Industry
- March 2022: Intelerad Medical Systems launched its new Enterprise Imaging and Informatics Suite at the 2022 HIMSS Global Health Conference & Exhibition. Intelerad's suite empowers hospitals and health systems to break down siloed data and create a seamless, vendor-neutral information hub, integrating vital patient data across the entire healthcare ecosystem.
- March 2022: Philips introduced cloud-enabled enterprise imaging informatics and analytics solutions. Philips Health Suite Interoperability is a fully integrated cloud-enabled Health IT platform to meet diverse workflow needs across the imaging enterprise.
Strategic Outlook for Medical Image Exchange Systems Industry Market
The strategic outlook for the Medical Image Exchange Systems industry is exceptionally positive, driven by sustained demand for advanced imaging informatics solutions. The ongoing digital transformation in healthcare, coupled with the escalating volume of medical imaging data, will continue to be primary growth catalysts. Investments in AI-powered analytics and cloud-native platforms will define competitive advantage, enabling providers to enhance diagnostic accuracy and operational efficiency. The increasing focus on interoperability and seamless data sharing across healthcare ecosystems will further fuel the adoption of Vendor Neutral Archives and integrated enterprise imaging solutions. Emerging markets present significant untapped potential, while developed regions will focus on upgrading existing infrastructure and integrating advanced functionalities, ensuring a robust and dynamic market landscape.
Medical Image Exchange Systems Industry Segmentation
-
1. System
- 1.1. Vendor Neutral Archive
- 1.2. Picture Archiving and Communications System (PACS)
- 1.3. Other Systems
-
2. End-User
- 2.1. Hospitals
- 2.2. Diagnostic Centers
- 2.3. Ambulatory Surgery Centers
Medical Image Exchange Systems Industry Segmentation By Geography
-
1. North America
- 1.1. United States
- 1.2. Canada
- 1.3. Mexico
-
2. Europe
- 2.1. Germany
- 2.2. United Kingdom
- 2.3. France
- 2.4. Italy
- 2.5. Spain
- 2.6. Rest of Europe
-
3. Asia Pacific
- 3.1. China
- 3.2. Japan
- 3.3. India
- 3.4. Australia
- 3.5. South Korea
- 3.6. Rest of Asia Pacific
-
4. Middle East and Africa
- 4.1. GCC
- 4.2. South Africa
- 4.3. Rest of Middle East and Africa
-
5. South America
- 5.1. Brazil
- 5.2. Argentina
- 5.3. Rest of South America
Medical Image Exchange Systems Industry Regional Market Share
Geographic Coverage of Medical Image Exchange Systems Industry
Medical Image Exchange Systems Industry REPORT HIGHLIGHTS
| Aspects | Details |
|---|---|
| Study Period | 2020-2034 |
| Base Year | 2025 |
| Estimated Year | 2026 |
| Forecast Period | 2026-2034 |
| Historical Period | 2020-2025 |
| Growth Rate | CAGR of 6.96% from 2020-2034 |
| Segmentation |
|
Table of Contents
- 1. Introduction
- 1.1. Research Scope
- 1.2. Market Segmentation
- 1.3. Research Objective
- 1.4. Definitions and Assumptions
- 2. Executive Summary
- 2.1. Market Snapshot
- 3. Market Dynamics
- 3.1. Market Drivers
- 3.2. Market Restrains
- 3.3. Market Trends
- 3.4. Market Opportunities
- 4. Market Factor Analysis
- 4.1. Porters Five Forces
- 4.1.1. Bargaining Power of Suppliers
- 4.1.2. Bargaining Power of Buyers
- 4.1.3. Threat of New Entrants
- 4.1.4. Threat of Substitutes
- 4.1.5. Competitive Rivalry
- 4.2. PESTEL analysis
- 4.3. BCG Analysis
- 4.3.1. Stars (High Growth, High Market Share)
- 4.3.2. Cash Cows (Low Growth, High Market Share)
- 4.3.3. Question Mark (High Growth, Low Market Share)
- 4.3.4. Dogs (Low Growth, Low Market Share)
- 4.4. Ansoff Matrix Analysis
- 4.5. Supply Chain Analysis
- 4.6. Regulatory Landscape
- 4.7. Current Market Potential and Opportunity Assessment (TAM–SAM–SOM Framework)
- 4.8. RAX Analyst Note
- 4.1. Porters Five Forces
- 5. Market Analysis, Insights and Forecast 2021-2033
- 5.1. Market Analysis, Insights and Forecast - by System
- 5.1.1. Vendor Neutral Archive
- 5.1.2. Picture Archiving and Communications System (PACS)
- 5.1.3. Other Systems
- 5.2. Market Analysis, Insights and Forecast - by End-User
- 5.2.1. Hospitals
- 5.2.2. Diagnostic Centers
- 5.2.3. Ambulatory Surgery Centers
- 5.3. Market Analysis, Insights and Forecast - by Region
- 5.3.1. North America
- 5.3.2. Europe
- 5.3.3. Asia Pacific
- 5.3.4. Middle East and Africa
- 5.3.5. South America
- 5.1. Market Analysis, Insights and Forecast - by System
- 6. Global Medical Image Exchange Systems Industry Analysis, Insights and Forecast, 2021-2033
- 6.1. Market Analysis, Insights and Forecast - by System
- 6.1.1. Vendor Neutral Archive
- 6.1.2. Picture Archiving and Communications System (PACS)
- 6.1.3. Other Systems
- 6.2. Market Analysis, Insights and Forecast - by End-User
- 6.2.1. Hospitals
- 6.2.2. Diagnostic Centers
- 6.2.3. Ambulatory Surgery Centers
- 6.1. Market Analysis, Insights and Forecast - by System
- 7. North America Medical Image Exchange Systems Industry Analysis, Insights and Forecast, 2020-2032
- 7.1. Market Analysis, Insights and Forecast - by System
- 7.1.1. Vendor Neutral Archive
- 7.1.2. Picture Archiving and Communications System (PACS)
- 7.1.3. Other Systems
- 7.2. Market Analysis, Insights and Forecast - by End-User
- 7.2.1. Hospitals
- 7.2.2. Diagnostic Centers
- 7.2.3. Ambulatory Surgery Centers
- 7.1. Market Analysis, Insights and Forecast - by System
- 8. Europe Medical Image Exchange Systems Industry Analysis, Insights and Forecast, 2020-2032
- 8.1. Market Analysis, Insights and Forecast - by System
- 8.1.1. Vendor Neutral Archive
- 8.1.2. Picture Archiving and Communications System (PACS)
- 8.1.3. Other Systems
- 8.2. Market Analysis, Insights and Forecast - by End-User
- 8.2.1. Hospitals
- 8.2.2. Diagnostic Centers
- 8.2.3. Ambulatory Surgery Centers
- 8.1. Market Analysis, Insights and Forecast - by System
- 9. Asia Pacific Medical Image Exchange Systems Industry Analysis, Insights and Forecast, 2020-2032
- 9.1. Market Analysis, Insights and Forecast - by System
- 9.1.1. Vendor Neutral Archive
- 9.1.2. Picture Archiving and Communications System (PACS)
- 9.1.3. Other Systems
- 9.2. Market Analysis, Insights and Forecast - by End-User
- 9.2.1. Hospitals
- 9.2.2. Diagnostic Centers
- 9.2.3. Ambulatory Surgery Centers
- 9.1. Market Analysis, Insights and Forecast - by System
- 10. Middle East and Africa Medical Image Exchange Systems Industry Analysis, Insights and Forecast, 2020-2032
- 10.1. Market Analysis, Insights and Forecast - by System
- 10.1.1. Vendor Neutral Archive
- 10.1.2. Picture Archiving and Communications System (PACS)
- 10.1.3. Other Systems
- 10.2. Market Analysis, Insights and Forecast - by End-User
- 10.2.1. Hospitals
- 10.2.2. Diagnostic Centers
- 10.2.3. Ambulatory Surgery Centers
- 10.1. Market Analysis, Insights and Forecast - by System
- 11. South America Medical Image Exchange Systems Industry Analysis, Insights and Forecast, 2020-2032
- 11.1. Market Analysis, Insights and Forecast - by System
- 11.1.1. Vendor Neutral Archive
- 11.1.2. Picture Archiving and Communications System (PACS)
- 11.1.3. Other Systems
- 11.2. Market Analysis, Insights and Forecast - by End-User
- 11.2.1. Hospitals
- 11.2.2. Diagnostic Centers
- 11.2.3. Ambulatory Surgery Centers
- 11.1. Market Analysis, Insights and Forecast - by System
- 12. Competitive Analysis
- 12.1. Company Profiles
- 12.1.1 IBM Corporation
- 12.1.1.1. Company Overview
- 12.1.1.2. Products
- 12.1.1.3. Company Financials
- 12.1.1.4. SWOT Analysis
- 12.1.2 Siemens Healthineers
- 12.1.2.1. Company Overview
- 12.1.2.2. Products
- 12.1.2.3. Company Financials
- 12.1.2.4. SWOT Analysis
- 12.1.3 GE Healthcare
- 12.1.3.1. Company Overview
- 12.1.3.2. Products
- 12.1.3.3. Company Financials
- 12.1.3.4. SWOT Analysis
- 12.1.4 Dell Technologies Inc
- 12.1.4.1. Company Overview
- 12.1.4.2. Products
- 12.1.4.3. Company Financials
- 12.1.4.4. SWOT Analysis
- 12.1.5 Lexmark International Inc
- 12.1.5.1. Company Overview
- 12.1.5.2. Products
- 12.1.5.3. Company Financials
- 12.1.5.4. SWOT Analysis
- 12.1.6 BridgeHead Software
- 12.1.6.1. Company Overview
- 12.1.6.2. Products
- 12.1.6.3. Company Financials
- 12.1.6.4. SWOT Analysis
- 12.1.7 Koninklijke Philips NV
- 12.1.7.1. Company Overview
- 12.1.7.2. Products
- 12.1.7.3. Company Financials
- 12.1.7.4. SWOT Analysis
- 12.1.8 Carestream Health Inc (Onex Corporation)
- 12.1.8.1. Company Overview
- 12.1.8.2. Products
- 12.1.8.3. Company Financials
- 12.1.8.4. SWOT Analysis
- 12.1.9 McKesson Corporation
- 12.1.9.1. Company Overview
- 12.1.9.2. Products
- 12.1.9.3. Company Financials
- 12.1.9.4. SWOT Analysis
- 12.1.10 Novarad Corporation
- 12.1.10.1. Company Overview
- 12.1.10.2. Products
- 12.1.10.3. Company Financials
- 12.1.10.4. SWOT Analysis
- 12.1.11 Agfa-Gevaert Group
- 12.1.11.1. Company Overview
- 12.1.11.2. Products
- 12.1.11.3. Company Financials
- 12.1.11.4. SWOT Analysis
- 12.1.12 Fujifilm Holdings Corporation
- 12.1.12.1. Company Overview
- 12.1.12.2. Products
- 12.1.12.3. Company Financials
- 12.1.12.4. SWOT Analysis
- 12.1.1 IBM Corporation
- 12.2. Market Entropy
- 12.2.1 Company's Key Areas Served
- 12.2.2 Recent Developments
- 12.3. Company Market Share Analysis 2025
- 12.3.1 Top 5 Companies Market Share Analysis
- 12.3.2 Top 3 Companies Market Share Analysis
- 12.4. List of Potential Customers
- 13. Research Methodology
List of Figures
- Figure 1: Global Medical Image Exchange Systems Industry Revenue Breakdown (Million, %) by Region 2025 & 2033
- Figure 2: Global Medical Image Exchange Systems Industry Volume Breakdown (K Unit, %) by Region 2025 & 2033
- Figure 3: North America Medical Image Exchange Systems Industry Revenue (Million), by System 2025 & 2033
- Figure 4: North America Medical Image Exchange Systems Industry Volume (K Unit), by System 2025 & 2033
- Figure 5: North America Medical Image Exchange Systems Industry Revenue Share (%), by System 2025 & 2033
- Figure 6: North America Medical Image Exchange Systems Industry Volume Share (%), by System 2025 & 2033
- Figure 7: North America Medical Image Exchange Systems Industry Revenue (Million), by End-User 2025 & 2033
- Figure 8: North America Medical Image Exchange Systems Industry Volume (K Unit), by End-User 2025 & 2033
- Figure 9: North America Medical Image Exchange Systems Industry Revenue Share (%), by End-User 2025 & 2033
- Figure 10: North America Medical Image Exchange Systems Industry Volume Share (%), by End-User 2025 & 2033
- Figure 11: North America Medical Image Exchange Systems Industry Revenue (Million), by Country 2025 & 2033
- Figure 12: North America Medical Image Exchange Systems Industry Volume (K Unit), by Country 2025 & 2033
- Figure 13: North America Medical Image Exchange Systems Industry Revenue Share (%), by Country 2025 & 2033
- Figure 14: North America Medical Image Exchange Systems Industry Volume Share (%), by Country 2025 & 2033
- Figure 15: Europe Medical Image Exchange Systems Industry Revenue (Million), by System 2025 & 2033
- Figure 16: Europe Medical Image Exchange Systems Industry Volume (K Unit), by System 2025 & 2033
- Figure 17: Europe Medical Image Exchange Systems Industry Revenue Share (%), by System 2025 & 2033
- Figure 18: Europe Medical Image Exchange Systems Industry Volume Share (%), by System 2025 & 2033
- Figure 19: Europe Medical Image Exchange Systems Industry Revenue (Million), by End-User 2025 & 2033
- Figure 20: Europe Medical Image Exchange Systems Industry Volume (K Unit), by End-User 2025 & 2033
- Figure 21: Europe Medical Image Exchange Systems Industry Revenue Share (%), by End-User 2025 & 2033
- Figure 22: Europe Medical Image Exchange Systems Industry Volume Share (%), by End-User 2025 & 2033
- Figure 23: Europe Medical Image Exchange Systems Industry Revenue (Million), by Country 2025 & 2033
- Figure 24: Europe Medical Image Exchange Systems Industry Volume (K Unit), by Country 2025 & 2033
- Figure 25: Europe Medical Image Exchange Systems Industry Revenue Share (%), by Country 2025 & 2033
- Figure 26: Europe Medical Image Exchange Systems Industry Volume Share (%), by Country 2025 & 2033
- Figure 27: Asia Pacific Medical Image Exchange Systems Industry Revenue (Million), by System 2025 & 2033
- Figure 28: Asia Pacific Medical Image Exchange Systems Industry Volume (K Unit), by System 2025 & 2033
- Figure 29: Asia Pacific Medical Image Exchange Systems Industry Revenue Share (%), by System 2025 & 2033
- Figure 30: Asia Pacific Medical Image Exchange Systems Industry Volume Share (%), by System 2025 & 2033
- Figure 31: Asia Pacific Medical Image Exchange Systems Industry Revenue (Million), by End-User 2025 & 2033
- Figure 32: Asia Pacific Medical Image Exchange Systems Industry Volume (K Unit), by End-User 2025 & 2033
- Figure 33: Asia Pacific Medical Image Exchange Systems Industry Revenue Share (%), by End-User 2025 & 2033
- Figure 34: Asia Pacific Medical Image Exchange Systems Industry Volume Share (%), by End-User 2025 & 2033
- Figure 35: Asia Pacific Medical Image Exchange Systems Industry Revenue (Million), by Country 2025 & 2033
- Figure 36: Asia Pacific Medical Image Exchange Systems Industry Volume (K Unit), by Country 2025 & 2033
- Figure 37: Asia Pacific Medical Image Exchange Systems Industry Revenue Share (%), by Country 2025 & 2033
- Figure 38: Asia Pacific Medical Image Exchange Systems Industry Volume Share (%), by Country 2025 & 2033
- Figure 39: Middle East and Africa Medical Image Exchange Systems Industry Revenue (Million), by System 2025 & 2033
- Figure 40: Middle East and Africa Medical Image Exchange Systems Industry Volume (K Unit), by System 2025 & 2033
- Figure 41: Middle East and Africa Medical Image Exchange Systems Industry Revenue Share (%), by System 2025 & 2033
- Figure 42: Middle East and Africa Medical Image Exchange Systems Industry Volume Share (%), by System 2025 & 2033
- Figure 43: Middle East and Africa Medical Image Exchange Systems Industry Revenue (Million), by End-User 2025 & 2033
- Figure 44: Middle East and Africa Medical Image Exchange Systems Industry Volume (K Unit), by End-User 2025 & 2033
- Figure 45: Middle East and Africa Medical Image Exchange Systems Industry Revenue Share (%), by End-User 2025 & 2033
- Figure 46: Middle East and Africa Medical Image Exchange Systems Industry Volume Share (%), by End-User 2025 & 2033
- Figure 47: Middle East and Africa Medical Image Exchange Systems Industry Revenue (Million), by Country 2025 & 2033
- Figure 48: Middle East and Africa Medical Image Exchange Systems Industry Volume (K Unit), by Country 2025 & 2033
- Figure 49: Middle East and Africa Medical Image Exchange Systems Industry Revenue Share (%), by Country 2025 & 2033
- Figure 50: Middle East and Africa Medical Image Exchange Systems Industry Volume Share (%), by Country 2025 & 2033
- Figure 51: South America Medical Image Exchange Systems Industry Revenue (Million), by System 2025 & 2033
- Figure 52: South America Medical Image Exchange Systems Industry Volume (K Unit), by System 2025 & 2033
- Figure 53: South America Medical Image Exchange Systems Industry Revenue Share (%), by System 2025 & 2033
- Figure 54: South America Medical Image Exchange Systems Industry Volume Share (%), by System 2025 & 2033
- Figure 55: South America Medical Image Exchange Systems Industry Revenue (Million), by End-User 2025 & 2033
- Figure 56: South America Medical Image Exchange Systems Industry Volume (K Unit), by End-User 2025 & 2033
- Figure 57: South America Medical Image Exchange Systems Industry Revenue Share (%), by End-User 2025 & 2033
- Figure 58: South America Medical Image Exchange Systems Industry Volume Share (%), by End-User 2025 & 2033
- Figure 59: South America Medical Image Exchange Systems Industry Revenue (Million), by Country 2025 & 2033
- Figure 60: South America Medical Image Exchange Systems Industry Volume (K Unit), by Country 2025 & 2033
- Figure 61: South America Medical Image Exchange Systems Industry Revenue Share (%), by Country 2025 & 2033
- Figure 62: South America Medical Image Exchange Systems Industry Volume Share (%), by Country 2025 & 2033
List of Tables
- Table 1: Global Medical Image Exchange Systems Industry Revenue Million Forecast, by System 2020 & 2033
- Table 2: Global Medical Image Exchange Systems Industry Volume K Unit Forecast, by System 2020 & 2033
- Table 3: Global Medical Image Exchange Systems Industry Revenue Million Forecast, by End-User 2020 & 2033
- Table 4: Global Medical Image Exchange Systems Industry Volume K Unit Forecast, by End-User 2020 & 2033
- Table 5: Global Medical Image Exchange Systems Industry Revenue Million Forecast, by Region 2020 & 2033
- Table 6: Global Medical Image Exchange Systems Industry Volume K Unit Forecast, by Region 2020 & 2033
- Table 7: Global Medical Image Exchange Systems Industry Revenue Million Forecast, by System 2020 & 2033
- Table 8: Global Medical Image Exchange Systems Industry Volume K Unit Forecast, by System 2020 & 2033
- Table 9: Global Medical Image Exchange Systems Industry Revenue Million Forecast, by End-User 2020 & 2033
- Table 10: Global Medical Image Exchange Systems Industry Volume K Unit Forecast, by End-User 2020 & 2033
- Table 11: Global Medical Image Exchange Systems Industry Revenue Million Forecast, by Country 2020 & 2033
- Table 12: Global Medical Image Exchange Systems Industry Volume K Unit Forecast, by Country 2020 & 2033
- Table 13: United States Medical Image Exchange Systems Industry Revenue (Million) Forecast, by Application 2020 & 2033
- Table 14: United States Medical Image Exchange Systems Industry Volume (K Unit) Forecast, by Application 2020 & 2033
- Table 15: Canada Medical Image Exchange Systems Industry Revenue (Million) Forecast, by Application 2020 & 2033
- Table 16: Canada Medical Image Exchange Systems Industry Volume (K Unit) Forecast, by Application 2020 & 2033
- Table 17: Mexico Medical Image Exchange Systems Industry Revenue (Million) Forecast, by Application 2020 & 2033
- Table 18: Mexico Medical Image Exchange Systems Industry Volume (K Unit) Forecast, by Application 2020 & 2033
- Table 19: Global Medical Image Exchange Systems Industry Revenue Million Forecast, by System 2020 & 2033
- Table 20: Global Medical Image Exchange Systems Industry Volume K Unit Forecast, by System 2020 & 2033
- Table 21: Global Medical Image Exchange Systems Industry Revenue Million Forecast, by End-User 2020 & 2033
- Table 22: Global Medical Image Exchange Systems Industry Volume K Unit Forecast, by End-User 2020 & 2033
- Table 23: Global Medical Image Exchange Systems Industry Revenue Million Forecast, by Country 2020 & 2033
- Table 24: Global Medical Image Exchange Systems Industry Volume K Unit Forecast, by Country 2020 & 2033
- Table 25: Germany Medical Image Exchange Systems Industry Revenue (Million) Forecast, by Application 2020 & 2033
- Table 26: Germany Medical Image Exchange Systems Industry Volume (K Unit) Forecast, by Application 2020 & 2033
- Table 27: United Kingdom Medical Image Exchange Systems Industry Revenue (Million) Forecast, by Application 2020 & 2033
- Table 28: United Kingdom Medical Image Exchange Systems Industry Volume (K Unit) Forecast, by Application 2020 & 2033
- Table 29: France Medical Image Exchange Systems Industry Revenue (Million) Forecast, by Application 2020 & 2033
- Table 30: France Medical Image Exchange Systems Industry Volume (K Unit) Forecast, by Application 2020 & 2033
- Table 31: Italy Medical Image Exchange Systems Industry Revenue (Million) Forecast, by Application 2020 & 2033
- Table 32: Italy Medical Image Exchange Systems Industry Volume (K Unit) Forecast, by Application 2020 & 2033
- Table 33: Spain Medical Image Exchange Systems Industry Revenue (Million) Forecast, by Application 2020 & 2033
- Table 34: Spain Medical Image Exchange Systems Industry Volume (K Unit) Forecast, by Application 2020 & 2033
- Table 35: Rest of Europe Medical Image Exchange Systems Industry Revenue (Million) Forecast, by Application 2020 & 2033
- Table 36: Rest of Europe Medical Image Exchange Systems Industry Volume (K Unit) Forecast, by Application 2020 & 2033
- Table 37: Global Medical Image Exchange Systems Industry Revenue Million Forecast, by System 2020 & 2033
- Table 38: Global Medical Image Exchange Systems Industry Volume K Unit Forecast, by System 2020 & 2033
- Table 39: Global Medical Image Exchange Systems Industry Revenue Million Forecast, by End-User 2020 & 2033
- Table 40: Global Medical Image Exchange Systems Industry Volume K Unit Forecast, by End-User 2020 & 2033
- Table 41: Global Medical Image Exchange Systems Industry Revenue Million Forecast, by Country 2020 & 2033
- Table 42: Global Medical Image Exchange Systems Industry Volume K Unit Forecast, by Country 2020 & 2033
- Table 43: China Medical Image Exchange Systems Industry Revenue (Million) Forecast, by Application 2020 & 2033
- Table 44: China Medical Image Exchange Systems Industry Volume (K Unit) Forecast, by Application 2020 & 2033
- Table 45: Japan Medical Image Exchange Systems Industry Revenue (Million) Forecast, by Application 2020 & 2033
- Table 46: Japan Medical Image Exchange Systems Industry Volume (K Unit) Forecast, by Application 2020 & 2033
- Table 47: India Medical Image Exchange Systems Industry Revenue (Million) Forecast, by Application 2020 & 2033
- Table 48: India Medical Image Exchange Systems Industry Volume (K Unit) Forecast, by Application 2020 & 2033
- Table 49: Australia Medical Image Exchange Systems Industry Revenue (Million) Forecast, by Application 2020 & 2033
- Table 50: Australia Medical Image Exchange Systems Industry Volume (K Unit) Forecast, by Application 2020 & 2033
- Table 51: South Korea Medical Image Exchange Systems Industry Revenue (Million) Forecast, by Application 2020 & 2033
- Table 52: South Korea Medical Image Exchange Systems Industry Volume (K Unit) Forecast, by Application 2020 & 2033
- Table 53: Rest of Asia Pacific Medical Image Exchange Systems Industry Revenue (Million) Forecast, by Application 2020 & 2033
- Table 54: Rest of Asia Pacific Medical Image Exchange Systems Industry Volume (K Unit) Forecast, by Application 2020 & 2033
- Table 55: Global Medical Image Exchange Systems Industry Revenue Million Forecast, by System 2020 & 2033
- Table 56: Global Medical Image Exchange Systems Industry Volume K Unit Forecast, by System 2020 & 2033
- Table 57: Global Medical Image Exchange Systems Industry Revenue Million Forecast, by End-User 2020 & 2033
- Table 58: Global Medical Image Exchange Systems Industry Volume K Unit Forecast, by End-User 2020 & 2033
- Table 59: Global Medical Image Exchange Systems Industry Revenue Million Forecast, by Country 2020 & 2033
- Table 60: Global Medical Image Exchange Systems Industry Volume K Unit Forecast, by Country 2020 & 2033
- Table 61: GCC Medical Image Exchange Systems Industry Revenue (Million) Forecast, by Application 2020 & 2033
- Table 62: GCC Medical Image Exchange Systems Industry Volume (K Unit) Forecast, by Application 2020 & 2033
- Table 63: South Africa Medical Image Exchange Systems Industry Revenue (Million) Forecast, by Application 2020 & 2033
- Table 64: South Africa Medical Image Exchange Systems Industry Volume (K Unit) Forecast, by Application 2020 & 2033
- Table 65: Rest of Middle East and Africa Medical Image Exchange Systems Industry Revenue (Million) Forecast, by Application 2020 & 2033
- Table 66: Rest of Middle East and Africa Medical Image Exchange Systems Industry Volume (K Unit) Forecast, by Application 2020 & 2033
- Table 67: Global Medical Image Exchange Systems Industry Revenue Million Forecast, by System 2020 & 2033
- Table 68: Global Medical Image Exchange Systems Industry Volume K Unit Forecast, by System 2020 & 2033
- Table 69: Global Medical Image Exchange Systems Industry Revenue Million Forecast, by End-User 2020 & 2033
- Table 70: Global Medical Image Exchange Systems Industry Volume K Unit Forecast, by End-User 2020 & 2033
- Table 71: Global Medical Image Exchange Systems Industry Revenue Million Forecast, by Country 2020 & 2033
- Table 72: Global Medical Image Exchange Systems Industry Volume K Unit Forecast, by Country 2020 & 2033
- Table 73: Brazil Medical Image Exchange Systems Industry Revenue (Million) Forecast, by Application 2020 & 2033
- Table 74: Brazil Medical Image Exchange Systems Industry Volume (K Unit) Forecast, by Application 2020 & 2033
- Table 75: Argentina Medical Image Exchange Systems Industry Revenue (Million) Forecast, by Application 2020 & 2033
- Table 76: Argentina Medical Image Exchange Systems Industry Volume (K Unit) Forecast, by Application 2020 & 2033
- Table 77: Rest of South America Medical Image Exchange Systems Industry Revenue (Million) Forecast, by Application 2020 & 2033
- Table 78: Rest of South America Medical Image Exchange Systems Industry Volume (K Unit) Forecast, by Application 2020 & 2033
Frequently Asked Questions
1. What is the projected Compound Annual Growth Rate (CAGR) of the Medical Image Exchange Systems Industry?
The projected CAGR is approximately 6.96%.
2. Which companies are prominent players in the Medical Image Exchange Systems Industry?
Key companies in the market include IBM Corporation, Siemens Healthineers, GE Healthcare, Dell Technologies Inc , Lexmark International Inc, BridgeHead Software, Koninklijke Philips NV, Carestream Health Inc (Onex Corporation), McKesson Corporation, Novarad Corporation, Agfa-Gevaert Group, Fujifilm Holdings Corporation.
3. What are the main segments of the Medical Image Exchange Systems Industry?
The market segments include System, End-User.
4. Can you provide details about the market size?
The market size is estimated to be USD 4.59 Million as of 2022.
5. What are some drivers contributing to market growth?
Technological Innovations in the Diagnostic Imaging and Image Management; Rising Prevalence of Chronic Diseases; Emergence of Big Data in Healthcare.
6. What are the notable trends driving market growth?
Picture Archiving and Communications Systems (PACS) is Expected to Record Notable CAGR in the Market During the Forecast Period.
7. Are there any restraints impacting market growth?
Cost Associated With Implementation of Medical Imaging Management Solutions; Decrease In the Supply of SPECT and PET Systems due to the Shortage of Radioisotopes.
8. Can you provide examples of recent developments in the market?
March 2022: Intelerad Medical Systems launched its new Enterprise Imaging and Informatics Suite at the 2022 HIMSS Global Health Conference & Exhibition. Intelerad's suite empowers hospitals and health systems to break down siloed data and create a seamless, vendor-neutral information hub, integrating vital patient data across the entire healthcare ecosystem.
9. What pricing options are available for accessing the report?
Pricing options include single-user, multi-user, and enterprise licenses priced at USD 4750, USD 5250, and USD 8750 respectively.
10. Is the market size provided in terms of value or volume?
The market size is provided in terms of value, measured in Million and volume, measured in K Unit.
11. Are there any specific market keywords associated with the report?
Yes, the market keyword associated with the report is "Medical Image Exchange Systems Industry," which aids in identifying and referencing the specific market segment covered.
12. How do I determine which pricing option suits my needs best?
The pricing options vary based on user requirements and access needs. Individual users may opt for single-user licenses, while businesses requiring broader access may choose multi-user or enterprise licenses for cost-effective access to the report.
13. Are there any additional resources or data provided in the Medical Image Exchange Systems Industry report?
While the report offers comprehensive insights, it's advisable to review the specific contents or supplementary materials provided to ascertain if additional resources or data are available.
14. How can I stay updated on further developments or reports in the Medical Image Exchange Systems Industry?
To stay informed about further developments, trends, and reports in the Medical Image Exchange Systems Industry, consider subscribing to industry newsletters, following relevant companies and organizations, or regularly checking reputable industry news sources and publications.
Methodology
Step 1 - Identification of Relevant Samples Size from Population Database


Step 2 - Approaches for Defining Global Market Size (Value, Volume* & Price*)

Note*: In applicable scenarios
Step 3 - Data Sources
Primary Research
- Web Analytics
- Survey Reports
- Research Institute
- Latest Research Reports
- Opinion Leaders
Secondary Research
- Annual Reports
- White Paper
- Latest Press Release
- Industry Association
- Paid Database
- Investor Presentations

Step 4 - Data Triangulation
Involves using different sources of information in order to increase the validity of a study
These sources are likely to be stakeholders in a program - participants, other researchers, program staff, other community members, and so on.
Then we put all data in single framework & apply various statistical tools to find out the dynamic on the market.
During the analysis stage, feedback from the stakeholder groups would be compared to determine areas of agreement as well as areas of divergence