
Key Insights
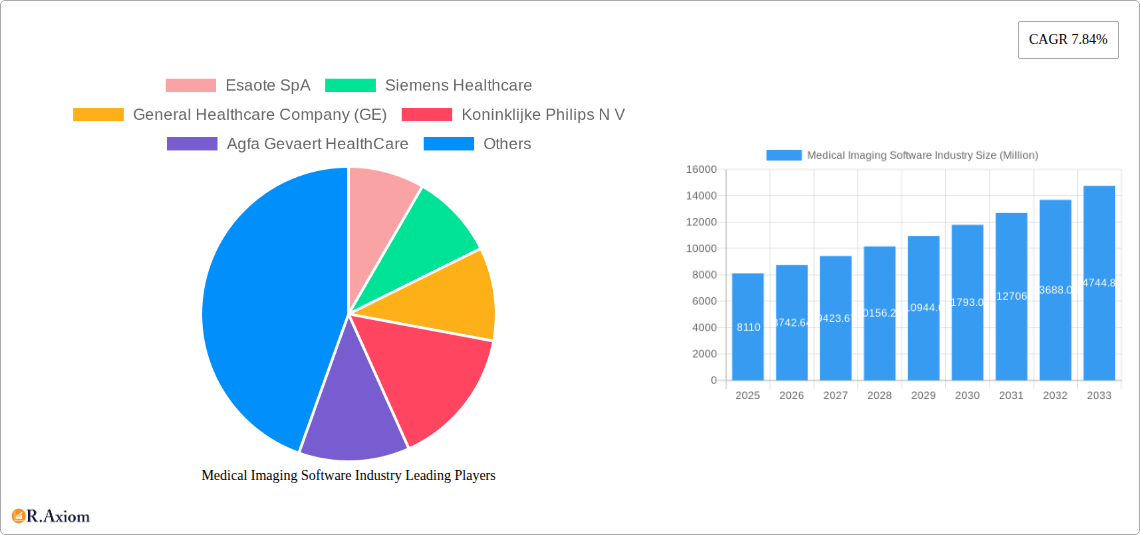
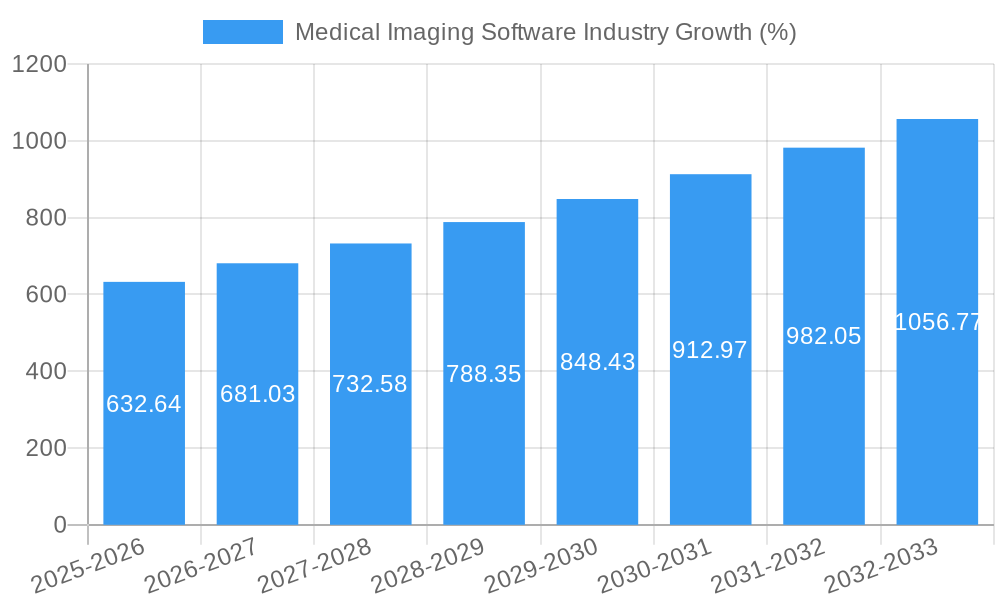
The global medical imaging software market, valued at $8.11 billion in 2025, is projected to experience robust growth, exhibiting a Compound Annual Growth Rate (CAGR) of 7.84% from 2025 to 2033. This expansion is driven by several key factors. Technological advancements, particularly in artificial intelligence (AI) and machine learning (ML), are enhancing image analysis, leading to faster and more accurate diagnoses. The increasing prevalence of chronic diseases, coupled with a rising geriatric population, fuels the demand for advanced diagnostic tools. Furthermore, the growing adoption of telehealth and remote patient monitoring necessitates efficient and accessible medical imaging software solutions. The integration of medical imaging software into Electronic Health Records (EHR) systems further streamlines workflows and improves patient care. Strong regulatory support for the adoption of digital health technologies in many regions also contributes to market growth.
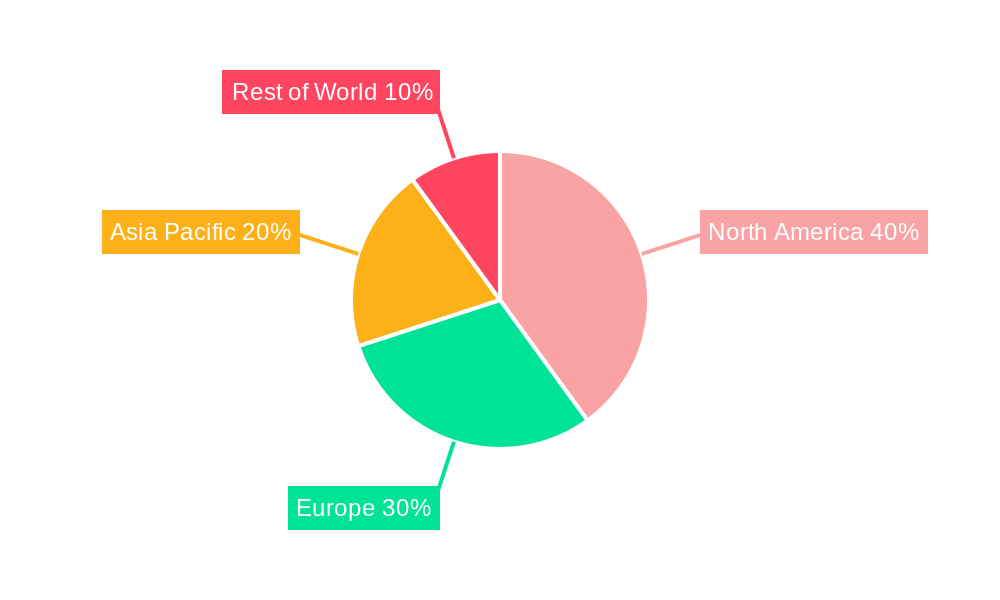
Market segmentation reveals significant opportunities within specific applications. Cardiovascular applications, fueled by the need for early detection of heart conditions, and oncology applications, leveraging AI-powered image analysis for cancer diagnosis, are projected to witness particularly strong growth. The 3D and 4D imaging segments are also experiencing rapid expansion due to their ability to provide more detailed and comprehensive anatomical visualizations compared to traditional 2D imaging. Geographical distribution shows North America and Europe maintaining significant market shares due to established healthcare infrastructure and high adoption rates of advanced technologies. However, the Asia-Pacific region is expected to exhibit the highest growth rate during the forecast period, driven by increasing healthcare expenditure and technological advancements within the region. Competition within the market is intense, with established players like GE Healthcare, Siemens Healthineers, and Philips competing alongside specialized software providers. The market is expected to consolidate further as larger companies acquire smaller players to expand their product portfolios and market reach.
Medical Imaging Software Industry Market Report: 2019-2033
This comprehensive report provides a detailed analysis of the Medical Imaging Software market, covering market size, segmentation, growth drivers, challenges, and key players. The report uses data from the historical period (2019-2024), the base year (2025), and forecasts for the period 2025-2033. The study period spans 2019-2033, offering a complete understanding of market evolution and future prospects. This report is essential for stakeholders including investors, medical device manufacturers, healthcare providers, and regulatory bodies seeking to navigate the dynamic landscape of medical imaging software.
Medical Imaging Software Industry Market Concentration & Innovation
The medical imaging software market exhibits a moderately concentrated structure, with a few major players holding significant market share. Estimates suggest that the top five companies, including GE Healthcare, Siemens Healthcare, Koninklijke Philips N.V., Esaote SpA, and Agfa Gevaert HealthCare, collectively account for approximately xx% of the global market in 2025. However, the market is witnessing increased competition from smaller players and startups focused on niche applications and technological advancements.
Innovation is a key driver in this sector, fueled by the increasing demand for advanced imaging techniques and AI-powered diagnostic tools. Regulatory frameworks, such as those set by the FDA and other international bodies, significantly impact the market, ensuring safety and efficacy standards. The industry also faces challenges from product substitutes, like traditional imaging methods and alternative diagnostic tools. End-user trends, characterized by a preference for efficient, cost-effective, and AI-driven solutions, are shaping the market. M&A activity remains a significant factor, with deal values exceeding xx Million in the last five years, driven by companies seeking to expand their product portfolios and market reach. For example, the recent partnership between Calyx and Qynapse showcases the increased focus on integrating AI into neuroimaging.
- Market Share: Top 5 companies hold xx% of the market (2025 estimate).
- M&A Activity: Deal values exceeding xx Million (2019-2024).
- Innovation Drivers: AI integration, advanced imaging techniques.
- Regulatory Impact: FDA and other international bodies' influence.
Medical Imaging Software Industry Industry Trends & Insights
The medical imaging software market is experiencing robust growth, driven by factors such as the rising prevalence of chronic diseases, technological advancements in imaging modalities, increasing demand for better diagnostics, and an aging global population. The market is projected to register a CAGR of xx% during the forecast period (2025-2033), reaching a market value of xx Million by 2033. Technological disruptions, particularly the integration of artificial intelligence (AI) and machine learning (ML) algorithms for improved image analysis and diagnostic accuracy, are significantly impacting the industry. Consumer preferences are shifting towards user-friendly, cloud-based solutions offering enhanced data management and collaborative capabilities. The competitive landscape remains dynamic, with established players facing increased pressure from agile startups introducing innovative solutions. Market penetration of AI-powered diagnostic tools is steadily increasing and expected to reach xx% by 2033.
Dominant Markets & Segments in Medical Imaging Software Industry
The North American region currently dominates the medical imaging software market, driven by strong healthcare infrastructure, high technological adoption rates, and substantial research funding. Within this region, the United States holds the largest market share. Key drivers for this dominance include favorable economic policies supporting technological innovation and substantial investments in healthcare infrastructure.
By Imaging Type:
- 2D Imaging: This segment continues to be a significant part of the market, driven by its cost-effectiveness and wide availability.
- 3D Imaging: Experiencing high growth due to its ability to provide more detailed anatomical information.
- 4D Imaging: Shows strong growth potential but faces challenges relating to high costs and complex workflows.
By Application:
- Cardiology Applications: This application segment is a major driver due to the increasing prevalence of cardiovascular diseases.
- Mammography Applications: This segment is growing rapidly due to advancements in early detection and screening technologies.
- Orthopedic Applications: The orthopedic segment benefits from its usefulness in pre- and post-surgical planning and analysis. Other applications also contribute significantly to market growth.
The high growth potential in developing economies, especially in Asia-Pacific, is also a significant factor shaping the long-term market dynamics. Increased investments in healthcare infrastructure and rising awareness about preventive healthcare are key factors.
Medical Imaging Software Industry Product Developments
Recent product innovations showcase a strong trend towards integrating AI and cloud computing into medical imaging software. This enables improved image analysis, faster diagnostics, remote access, and enhanced collaboration among healthcare professionals. New products offer enhanced image quality, streamlined workflows, and more user-friendly interfaces, which are leading to better patient experiences and improved diagnostic accuracy. These developments provide significant competitive advantages to manufacturers by improving efficiency and expanding the range of applications, ultimately fitting the demands of the increasingly digitally focused healthcare market.
Report Scope & Segmentation Analysis
This report segments the medical imaging software market by imaging type (2D, 3D, 4D) and application (dental, orthopedic, cardiology, obstetrics & gynecology, mammography, urology & nephrology, other). Each segment's growth projections, market size, and competitive dynamics are analyzed in detail. For example, the cardiology application segment is expected to exhibit strong growth due to the rising prevalence of heart diseases. The 3D and 4D imaging segments are anticipated to show substantial growth due to technological advancements and increasing adoption in various medical specialties. The competitive dynamics within each segment are shaped by technological innovation, regulatory landscape, and the strategic moves of market leaders.
Key Drivers of Medical Imaging Software Industry Growth
The growth of the medical imaging software industry is fueled by several factors. Technological advancements, particularly AI and cloud computing, are enabling faster and more accurate diagnostics. The increasing prevalence of chronic diseases globally fuels the demand for sophisticated diagnostic tools. Government initiatives promoting digital healthcare and the rising adoption of telemedicine are also significant catalysts. Finally, favorable economic conditions in certain regions are further driving market expansion.
Challenges in the Medical Imaging Software Industry Sector
The medical imaging software industry faces challenges including stringent regulatory requirements for software validation and approval, which can delay product launches and increase costs. Supply chain disruptions and the rising cost of components can also affect production and pricing. Intense competition, especially from smaller, agile companies with niche solutions, poses a constant threat to market share for larger players. The high cost of implementation and maintenance of complex software systems may be a barrier to adoption in some areas.
Emerging Opportunities in Medical Imaging Software Industry
Emerging opportunities lie in integrating advanced AI capabilities for automated diagnostics, personalized medicine, and predictive analytics. The growing adoption of cloud-based solutions and remote diagnostics opens new avenues for healthcare delivery and access. Expansion into untapped markets in developing countries presents substantial growth potential. Finally, continued development in areas such as 4D imaging and new imaging modalities offers long-term opportunities for market expansion.
Leading Players in the Medical Imaging Software Industry Market
- Esaote SpA
- Siemens Healthcare
- General Healthcare Company (GE)
- Koninklijke Philips N.V.
- Agfa Gevaert HealthCare
- Cerner Corporation
- MIM Software Inc
- Canon Medical Systems Corporation
- Fujifilm Holding Company
- Carestream Health Inc
- Change Healthcare
- Novarad Corporation
Key Developments in Medical Imaging Software Industry Industry
- February 2022: The European Society of Radiology and GE Healthcare renewed their strategic partnership for the ECR 2022, emphasizing digital AI, patient experience, and sustainability.
- July 2022: Canon Medical launched the Vantage Fortian MRI system, featuring innovative workflow solutions and accelerated scan technologies.
- July 2022: Calyx and Qynapse partnered to expand the use of AI-based neuroimaging in clinical trials.
Strategic Outlook for Medical Imaging Software Industry Market
The future of the medical imaging software market is bright, driven by consistent technological advancements, the increasing prevalence of chronic diseases, and growing demand for efficient healthcare solutions. The integration of AI and cloud technologies will continue to revolutionize diagnostics and treatment planning. The market is poised for substantial growth, particularly in developing regions and with the emergence of new applications and sophisticated imaging modalities. Companies that invest in R&D, embrace innovative technologies, and adapt to evolving regulatory landscapes will be well-positioned for success.
Medical Imaging Software Industry Segmentation
-
1. Imaging Type
- 1.1. 2D Imaging
- 1.2. 3D Imaging
- 1.3. 4D Imaging
-
2. Application
- 2.1. Dental Applications
- 2.2. Orthopaedic Applications
- 2.3. Cardiology Applications
- 2.4. Obstetrics and Gynaecology Applications
- 2.5. Mammography Applications
- 2.6. Urology and Nephrology Applications
- 2.7. Other Applications
Medical Imaging Software Industry Segmentation By Geography
-
1. North America
- 1.1. United States
- 1.2. Canada
-
2. Europe
- 2.1. Germany
- 2.2. France
- 2.3. United Kingdom
- 2.4. Rest of Europe
-
3. Asia Pacific
- 3.1. China
- 3.2. Japan
- 3.3. India
- 3.4. Rest of Asia Pacific
-
4. Rest of the World
- 4.1. Latin America
- 4.2. Middle East
Medical Imaging Software Industry REPORT HIGHLIGHTS
| Aspects | Details |
|---|---|
| Study Period | 2019-2033 |
| Base Year | 2024 |
| Estimated Year | 2025 |
| Forecast Period | 2025-2033 |
| Historical Period | 2019-2024 |
| Growth Rate | CAGR of 7.84% from 2019-2033 |
| Segmentation |
|
Table of Contents
- 1. Introduction
- 1.1. Research Scope
- 1.2. Market Segmentation
- 1.3. Research Methodology
- 1.4. Definitions and Assumptions
- 2. Executive Summary
- 2.1. Introduction
- 3. Market Dynamics
- 3.1. Introduction
- 3.2. Market Drivers
- 3.2.1. Growing Application of Computer-Aided Diagnostic Methods
- 3.3. Market Restrains
- 3.3.1. Dearth of Skilled Professionals and High Set-up Cost of the Equipment
- 3.4. Market Trends
- 3.4.1. Cardiology Applications Segment Holds Major Market Share
- 4. Market Factor Analysis
- 4.1. Porters Five Forces
- 4.2. Supply/Value Chain
- 4.3. PESTEL analysis
- 4.4. Market Entropy
- 4.5. Patent/Trademark Analysis
- 5. Global Medical Imaging Software Industry Analysis, Insights and Forecast, 2019-2031
- 5.1. Market Analysis, Insights and Forecast - by Imaging Type
- 5.1.1. 2D Imaging
- 5.1.2. 3D Imaging
- 5.1.3. 4D Imaging
- 5.2. Market Analysis, Insights and Forecast - by Application
- 5.2.1. Dental Applications
- 5.2.2. Orthopaedic Applications
- 5.2.3. Cardiology Applications
- 5.2.4. Obstetrics and Gynaecology Applications
- 5.2.5. Mammography Applications
- 5.2.6. Urology and Nephrology Applications
- 5.2.7. Other Applications
- 5.3. Market Analysis, Insights and Forecast - by Region
- 5.3.1. North America
- 5.3.2. Europe
- 5.3.3. Asia Pacific
- 5.3.4. Rest of the World
- 5.1. Market Analysis, Insights and Forecast - by Imaging Type
- 6. North America Medical Imaging Software Industry Analysis, Insights and Forecast, 2019-2031
- 6.1. Market Analysis, Insights and Forecast - by Imaging Type
- 6.1.1. 2D Imaging
- 6.1.2. 3D Imaging
- 6.1.3. 4D Imaging
- 6.2. Market Analysis, Insights and Forecast - by Application
- 6.2.1. Dental Applications
- 6.2.2. Orthopaedic Applications
- 6.2.3. Cardiology Applications
- 6.2.4. Obstetrics and Gynaecology Applications
- 6.2.5. Mammography Applications
- 6.2.6. Urology and Nephrology Applications
- 6.2.7. Other Applications
- 6.1. Market Analysis, Insights and Forecast - by Imaging Type
- 7. Europe Medical Imaging Software Industry Analysis, Insights and Forecast, 2019-2031
- 7.1. Market Analysis, Insights and Forecast - by Imaging Type
- 7.1.1. 2D Imaging
- 7.1.2. 3D Imaging
- 7.1.3. 4D Imaging
- 7.2. Market Analysis, Insights and Forecast - by Application
- 7.2.1. Dental Applications
- 7.2.2. Orthopaedic Applications
- 7.2.3. Cardiology Applications
- 7.2.4. Obstetrics and Gynaecology Applications
- 7.2.5. Mammography Applications
- 7.2.6. Urology and Nephrology Applications
- 7.2.7. Other Applications
- 7.1. Market Analysis, Insights and Forecast - by Imaging Type
- 8. Asia Pacific Medical Imaging Software Industry Analysis, Insights and Forecast, 2019-2031
- 8.1. Market Analysis, Insights and Forecast - by Imaging Type
- 8.1.1. 2D Imaging
- 8.1.2. 3D Imaging
- 8.1.3. 4D Imaging
- 8.2. Market Analysis, Insights and Forecast - by Application
- 8.2.1. Dental Applications
- 8.2.2. Orthopaedic Applications
- 8.2.3. Cardiology Applications
- 8.2.4. Obstetrics and Gynaecology Applications
- 8.2.5. Mammography Applications
- 8.2.6. Urology and Nephrology Applications
- 8.2.7. Other Applications
- 8.1. Market Analysis, Insights and Forecast - by Imaging Type
- 9. Rest of the World Medical Imaging Software Industry Analysis, Insights and Forecast, 2019-2031
- 9.1. Market Analysis, Insights and Forecast - by Imaging Type
- 9.1.1. 2D Imaging
- 9.1.2. 3D Imaging
- 9.1.3. 4D Imaging
- 9.2. Market Analysis, Insights and Forecast - by Application
- 9.2.1. Dental Applications
- 9.2.2. Orthopaedic Applications
- 9.2.3. Cardiology Applications
- 9.2.4. Obstetrics and Gynaecology Applications
- 9.2.5. Mammography Applications
- 9.2.6. Urology and Nephrology Applications
- 9.2.7. Other Applications
- 9.1. Market Analysis, Insights and Forecast - by Imaging Type
- 10. North America Medical Imaging Software Industry Analysis, Insights and Forecast, 2019-2031
- 10.1. Market Analysis, Insights and Forecast - By Country/Sub-region
- 10.1.1 United States
- 10.1.2 Canada
- 10.1.3 Mexico
- 11. Europe Medical Imaging Software Industry Analysis, Insights and Forecast, 2019-2031
- 11.1. Market Analysis, Insights and Forecast - By Country/Sub-region
- 11.1.1 Germany
- 11.1.2 United Kingdom
- 11.1.3 France
- 11.1.4 Spain
- 11.1.5 Italy
- 11.1.6 Spain
- 11.1.7 Belgium
- 11.1.8 Netherland
- 11.1.9 Nordics
- 11.1.10 Rest of Europe
- 12. Asia Pacific Medical Imaging Software Industry Analysis, Insights and Forecast, 2019-2031
- 12.1. Market Analysis, Insights and Forecast - By Country/Sub-region
- 12.1.1 China
- 12.1.2 Japan
- 12.1.3 India
- 12.1.4 South Korea
- 12.1.5 Southeast Asia
- 12.1.6 Australia
- 12.1.7 Indonesia
- 12.1.8 Phillipes
- 12.1.9 Singapore
- 12.1.10 Thailandc
- 12.1.11 Rest of Asia Pacific
- 13. South America Medical Imaging Software Industry Analysis, Insights and Forecast, 2019-2031
- 13.1. Market Analysis, Insights and Forecast - By Country/Sub-region
- 13.1.1 Brazil
- 13.1.2 Argentina
- 13.1.3 Peru
- 13.1.4 Chile
- 13.1.5 Colombia
- 13.1.6 Ecuador
- 13.1.7 Venezuela
- 13.1.8 Rest of South America
- 14. North America Medical Imaging Software Industry Analysis, Insights and Forecast, 2019-2031
- 14.1. Market Analysis, Insights and Forecast - By Country/Sub-region
- 14.1.1 United States
- 14.1.2 Canada
- 14.1.3 Mexico
- 15. MEA Medical Imaging Software Industry Analysis, Insights and Forecast, 2019-2031
- 15.1. Market Analysis, Insights and Forecast - By Country/Sub-region
- 15.1.1 United Arab Emirates
- 15.1.2 Saudi Arabia
- 15.1.3 South Africa
- 15.1.4 Rest of Middle East and Africa
- 16. Competitive Analysis
- 16.1. Global Market Share Analysis 2024
- 16.2. Company Profiles
- 16.2.1 Esaote SpA
- 16.2.1.1. Overview
- 16.2.1.2. Products
- 16.2.1.3. SWOT Analysis
- 16.2.1.4. Recent Developments
- 16.2.1.5. Financials (Based on Availability)
- 16.2.2 Siemens Healthcare
- 16.2.2.1. Overview
- 16.2.2.2. Products
- 16.2.2.3. SWOT Analysis
- 16.2.2.4. Recent Developments
- 16.2.2.5. Financials (Based on Availability)
- 16.2.3 General Healthcare Company (GE)
- 16.2.3.1. Overview
- 16.2.3.2. Products
- 16.2.3.3. SWOT Analysis
- 16.2.3.4. Recent Developments
- 16.2.3.5. Financials (Based on Availability)
- 16.2.4 Koninklijke Philips N V
- 16.2.4.1. Overview
- 16.2.4.2. Products
- 16.2.4.3. SWOT Analysis
- 16.2.4.4. Recent Developments
- 16.2.4.5. Financials (Based on Availability)
- 16.2.5 Agfa Gevaert HealthCare
- 16.2.5.1. Overview
- 16.2.5.2. Products
- 16.2.5.3. SWOT Analysis
- 16.2.5.4. Recent Developments
- 16.2.5.5. Financials (Based on Availability)
- 16.2.6 Cerner Corporation
- 16.2.6.1. Overview
- 16.2.6.2. Products
- 16.2.6.3. SWOT Analysis
- 16.2.6.4. Recent Developments
- 16.2.6.5. Financials (Based on Availability)
- 16.2.7 MIM Software Inc
- 16.2.7.1. Overview
- 16.2.7.2. Products
- 16.2.7.3. SWOT Analysis
- 16.2.7.4. Recent Developments
- 16.2.7.5. Financials (Based on Availability)
- 16.2.8 Canon Medical Systems Corporation
- 16.2.8.1. Overview
- 16.2.8.2. Products
- 16.2.8.3. SWOT Analysis
- 16.2.8.4. Recent Developments
- 16.2.8.5. Financials (Based on Availability)
- 16.2.9 Fujifilm Holding Company
- 16.2.9.1. Overview
- 16.2.9.2. Products
- 16.2.9.3. SWOT Analysis
- 16.2.9.4. Recent Developments
- 16.2.9.5. Financials (Based on Availability)
- 16.2.10 Carestream Health Inc
- 16.2.10.1. Overview
- 16.2.10.2. Products
- 16.2.10.3. SWOT Analysis
- 16.2.10.4. Recent Developments
- 16.2.10.5. Financials (Based on Availability)
- 16.2.11 Change Healthcare
- 16.2.11.1. Overview
- 16.2.11.2. Products
- 16.2.11.3. SWOT Analysis
- 16.2.11.4. Recent Developments
- 16.2.11.5. Financials (Based on Availability)
- 16.2.12 Novarad Corporation
- 16.2.12.1. Overview
- 16.2.12.2. Products
- 16.2.12.3. SWOT Analysis
- 16.2.12.4. Recent Developments
- 16.2.12.5. Financials (Based on Availability)
- 16.2.1 Esaote SpA
List of Figures
- Figure 1: Global Medical Imaging Software Industry Revenue Breakdown (Million, %) by Region 2024 & 2032
- Figure 2: North America Medical Imaging Software Industry Revenue (Million), by Country 2024 & 2032
- Figure 3: North America Medical Imaging Software Industry Revenue Share (%), by Country 2024 & 2032
- Figure 4: Europe Medical Imaging Software Industry Revenue (Million), by Country 2024 & 2032
- Figure 5: Europe Medical Imaging Software Industry Revenue Share (%), by Country 2024 & 2032
- Figure 6: Asia Pacific Medical Imaging Software Industry Revenue (Million), by Country 2024 & 2032
- Figure 7: Asia Pacific Medical Imaging Software Industry Revenue Share (%), by Country 2024 & 2032
- Figure 8: South America Medical Imaging Software Industry Revenue (Million), by Country 2024 & 2032
- Figure 9: South America Medical Imaging Software Industry Revenue Share (%), by Country 2024 & 2032
- Figure 10: North America Medical Imaging Software Industry Revenue (Million), by Country 2024 & 2032
- Figure 11: North America Medical Imaging Software Industry Revenue Share (%), by Country 2024 & 2032
- Figure 12: MEA Medical Imaging Software Industry Revenue (Million), by Country 2024 & 2032
- Figure 13: MEA Medical Imaging Software Industry Revenue Share (%), by Country 2024 & 2032
- Figure 14: North America Medical Imaging Software Industry Revenue (Million), by Imaging Type 2024 & 2032
- Figure 15: North America Medical Imaging Software Industry Revenue Share (%), by Imaging Type 2024 & 2032
- Figure 16: North America Medical Imaging Software Industry Revenue (Million), by Application 2024 & 2032
- Figure 17: North America Medical Imaging Software Industry Revenue Share (%), by Application 2024 & 2032
- Figure 18: North America Medical Imaging Software Industry Revenue (Million), by Country 2024 & 2032
- Figure 19: North America Medical Imaging Software Industry Revenue Share (%), by Country 2024 & 2032
- Figure 20: Europe Medical Imaging Software Industry Revenue (Million), by Imaging Type 2024 & 2032
- Figure 21: Europe Medical Imaging Software Industry Revenue Share (%), by Imaging Type 2024 & 2032
- Figure 22: Europe Medical Imaging Software Industry Revenue (Million), by Application 2024 & 2032
- Figure 23: Europe Medical Imaging Software Industry Revenue Share (%), by Application 2024 & 2032
- Figure 24: Europe Medical Imaging Software Industry Revenue (Million), by Country 2024 & 2032
- Figure 25: Europe Medical Imaging Software Industry Revenue Share (%), by Country 2024 & 2032
- Figure 26: Asia Pacific Medical Imaging Software Industry Revenue (Million), by Imaging Type 2024 & 2032
- Figure 27: Asia Pacific Medical Imaging Software Industry Revenue Share (%), by Imaging Type 2024 & 2032
- Figure 28: Asia Pacific Medical Imaging Software Industry Revenue (Million), by Application 2024 & 2032
- Figure 29: Asia Pacific Medical Imaging Software Industry Revenue Share (%), by Application 2024 & 2032
- Figure 30: Asia Pacific Medical Imaging Software Industry Revenue (Million), by Country 2024 & 2032
- Figure 31: Asia Pacific Medical Imaging Software Industry Revenue Share (%), by Country 2024 & 2032
- Figure 32: Rest of the World Medical Imaging Software Industry Revenue (Million), by Imaging Type 2024 & 2032
- Figure 33: Rest of the World Medical Imaging Software Industry Revenue Share (%), by Imaging Type 2024 & 2032
- Figure 34: Rest of the World Medical Imaging Software Industry Revenue (Million), by Application 2024 & 2032
- Figure 35: Rest of the World Medical Imaging Software Industry Revenue Share (%), by Application 2024 & 2032
- Figure 36: Rest of the World Medical Imaging Software Industry Revenue (Million), by Country 2024 & 2032
- Figure 37: Rest of the World Medical Imaging Software Industry Revenue Share (%), by Country 2024 & 2032
List of Tables
- Table 1: Global Medical Imaging Software Industry Revenue Million Forecast, by Region 2019 & 2032
- Table 2: Global Medical Imaging Software Industry Revenue Million Forecast, by Imaging Type 2019 & 2032
- Table 3: Global Medical Imaging Software Industry Revenue Million Forecast, by Application 2019 & 2032
- Table 4: Global Medical Imaging Software Industry Revenue Million Forecast, by Region 2019 & 2032
- Table 5: Global Medical Imaging Software Industry Revenue Million Forecast, by Country 2019 & 2032
- Table 6: United States Medical Imaging Software Industry Revenue (Million) Forecast, by Application 2019 & 2032
- Table 7: Canada Medical Imaging Software Industry Revenue (Million) Forecast, by Application 2019 & 2032
- Table 8: Mexico Medical Imaging Software Industry Revenue (Million) Forecast, by Application 2019 & 2032
- Table 9: Global Medical Imaging Software Industry Revenue Million Forecast, by Country 2019 & 2032
- Table 10: Germany Medical Imaging Software Industry Revenue (Million) Forecast, by Application 2019 & 2032
- Table 11: United Kingdom Medical Imaging Software Industry Revenue (Million) Forecast, by Application 2019 & 2032
- Table 12: France Medical Imaging Software Industry Revenue (Million) Forecast, by Application 2019 & 2032
- Table 13: Spain Medical Imaging Software Industry Revenue (Million) Forecast, by Application 2019 & 2032
- Table 14: Italy Medical Imaging Software Industry Revenue (Million) Forecast, by Application 2019 & 2032
- Table 15: Spain Medical Imaging Software Industry Revenue (Million) Forecast, by Application 2019 & 2032
- Table 16: Belgium Medical Imaging Software Industry Revenue (Million) Forecast, by Application 2019 & 2032
- Table 17: Netherland Medical Imaging Software Industry Revenue (Million) Forecast, by Application 2019 & 2032
- Table 18: Nordics Medical Imaging Software Industry Revenue (Million) Forecast, by Application 2019 & 2032
- Table 19: Rest of Europe Medical Imaging Software Industry Revenue (Million) Forecast, by Application 2019 & 2032
- Table 20: Global Medical Imaging Software Industry Revenue Million Forecast, by Country 2019 & 2032
- Table 21: China Medical Imaging Software Industry Revenue (Million) Forecast, by Application 2019 & 2032
- Table 22: Japan Medical Imaging Software Industry Revenue (Million) Forecast, by Application 2019 & 2032
- Table 23: India Medical Imaging Software Industry Revenue (Million) Forecast, by Application 2019 & 2032
- Table 24: South Korea Medical Imaging Software Industry Revenue (Million) Forecast, by Application 2019 & 2032
- Table 25: Southeast Asia Medical Imaging Software Industry Revenue (Million) Forecast, by Application 2019 & 2032
- Table 26: Australia Medical Imaging Software Industry Revenue (Million) Forecast, by Application 2019 & 2032
- Table 27: Indonesia Medical Imaging Software Industry Revenue (Million) Forecast, by Application 2019 & 2032
- Table 28: Phillipes Medical Imaging Software Industry Revenue (Million) Forecast, by Application 2019 & 2032
- Table 29: Singapore Medical Imaging Software Industry Revenue (Million) Forecast, by Application 2019 & 2032
- Table 30: Thailandc Medical Imaging Software Industry Revenue (Million) Forecast, by Application 2019 & 2032
- Table 31: Rest of Asia Pacific Medical Imaging Software Industry Revenue (Million) Forecast, by Application 2019 & 2032
- Table 32: Global Medical Imaging Software Industry Revenue Million Forecast, by Country 2019 & 2032
- Table 33: Brazil Medical Imaging Software Industry Revenue (Million) Forecast, by Application 2019 & 2032
- Table 34: Argentina Medical Imaging Software Industry Revenue (Million) Forecast, by Application 2019 & 2032
- Table 35: Peru Medical Imaging Software Industry Revenue (Million) Forecast, by Application 2019 & 2032
- Table 36: Chile Medical Imaging Software Industry Revenue (Million) Forecast, by Application 2019 & 2032
- Table 37: Colombia Medical Imaging Software Industry Revenue (Million) Forecast, by Application 2019 & 2032
- Table 38: Ecuador Medical Imaging Software Industry Revenue (Million) Forecast, by Application 2019 & 2032
- Table 39: Venezuela Medical Imaging Software Industry Revenue (Million) Forecast, by Application 2019 & 2032
- Table 40: Rest of South America Medical Imaging Software Industry Revenue (Million) Forecast, by Application 2019 & 2032
- Table 41: Global Medical Imaging Software Industry Revenue Million Forecast, by Country 2019 & 2032
- Table 42: United States Medical Imaging Software Industry Revenue (Million) Forecast, by Application 2019 & 2032
- Table 43: Canada Medical Imaging Software Industry Revenue (Million) Forecast, by Application 2019 & 2032
- Table 44: Mexico Medical Imaging Software Industry Revenue (Million) Forecast, by Application 2019 & 2032
- Table 45: Global Medical Imaging Software Industry Revenue Million Forecast, by Country 2019 & 2032
- Table 46: United Arab Emirates Medical Imaging Software Industry Revenue (Million) Forecast, by Application 2019 & 2032
- Table 47: Saudi Arabia Medical Imaging Software Industry Revenue (Million) Forecast, by Application 2019 & 2032
- Table 48: South Africa Medical Imaging Software Industry Revenue (Million) Forecast, by Application 2019 & 2032
- Table 49: Rest of Middle East and Africa Medical Imaging Software Industry Revenue (Million) Forecast, by Application 2019 & 2032
- Table 50: Global Medical Imaging Software Industry Revenue Million Forecast, by Imaging Type 2019 & 2032
- Table 51: Global Medical Imaging Software Industry Revenue Million Forecast, by Application 2019 & 2032
- Table 52: Global Medical Imaging Software Industry Revenue Million Forecast, by Country 2019 & 2032
- Table 53: United States Medical Imaging Software Industry Revenue (Million) Forecast, by Application 2019 & 2032
- Table 54: Canada Medical Imaging Software Industry Revenue (Million) Forecast, by Application 2019 & 2032
- Table 55: Global Medical Imaging Software Industry Revenue Million Forecast, by Imaging Type 2019 & 2032
- Table 56: Global Medical Imaging Software Industry Revenue Million Forecast, by Application 2019 & 2032
- Table 57: Global Medical Imaging Software Industry Revenue Million Forecast, by Country 2019 & 2032
- Table 58: Germany Medical Imaging Software Industry Revenue (Million) Forecast, by Application 2019 & 2032
- Table 59: France Medical Imaging Software Industry Revenue (Million) Forecast, by Application 2019 & 2032
- Table 60: United Kingdom Medical Imaging Software Industry Revenue (Million) Forecast, by Application 2019 & 2032
- Table 61: Rest of Europe Medical Imaging Software Industry Revenue (Million) Forecast, by Application 2019 & 2032
- Table 62: Global Medical Imaging Software Industry Revenue Million Forecast, by Imaging Type 2019 & 2032
- Table 63: Global Medical Imaging Software Industry Revenue Million Forecast, by Application 2019 & 2032
- Table 64: Global Medical Imaging Software Industry Revenue Million Forecast, by Country 2019 & 2032
- Table 65: China Medical Imaging Software Industry Revenue (Million) Forecast, by Application 2019 & 2032
- Table 66: Japan Medical Imaging Software Industry Revenue (Million) Forecast, by Application 2019 & 2032
- Table 67: India Medical Imaging Software Industry Revenue (Million) Forecast, by Application 2019 & 2032
- Table 68: Rest of Asia Pacific Medical Imaging Software Industry Revenue (Million) Forecast, by Application 2019 & 2032
- Table 69: Global Medical Imaging Software Industry Revenue Million Forecast, by Imaging Type 2019 & 2032
- Table 70: Global Medical Imaging Software Industry Revenue Million Forecast, by Application 2019 & 2032
- Table 71: Global Medical Imaging Software Industry Revenue Million Forecast, by Country 2019 & 2032
- Table 72: Latin America Medical Imaging Software Industry Revenue (Million) Forecast, by Application 2019 & 2032
- Table 73: Middle East Medical Imaging Software Industry Revenue (Million) Forecast, by Application 2019 & 2032
Frequently Asked Questions
1. What is the projected Compound Annual Growth Rate (CAGR) of the Medical Imaging Software Industry?
The projected CAGR is approximately 7.84%.
2. Which companies are prominent players in the Medical Imaging Software Industry?
Key companies in the market include Esaote SpA, Siemens Healthcare, General Healthcare Company (GE), Koninklijke Philips N V, Agfa Gevaert HealthCare, Cerner Corporation, MIM Software Inc, Canon Medical Systems Corporation, Fujifilm Holding Company, Carestream Health Inc, Change Healthcare, Novarad Corporation.
3. What are the main segments of the Medical Imaging Software Industry?
The market segments include Imaging Type, Application.
4. Can you provide details about the market size?
The market size is estimated to be USD 8.11 Million as of 2022.
5. What are some drivers contributing to market growth?
Growing Application of Computer-Aided Diagnostic Methods.
6. What are the notable trends driving market growth?
Cardiology Applications Segment Holds Major Market Share.
7. Are there any restraints impacting market growth?
Dearth of Skilled Professionals and High Set-up Cost of the Equipment.
8. Can you provide examples of recent developments in the market?
February 2022 - The European Society of Radiology and GE Healthcare have renewed their strategic partnership for the online European Congress of Radiology ECR 2022 on March 2-6, 2022, and onsite ECR 2022 on July 13-17 in Vienna, Austria. GE Healthcare would focus its efforts on three strategic pillars, digital and artificial intelligence, patient experience, and sustainability & resilience.
9. What pricing options are available for accessing the report?
Pricing options include single-user, multi-user, and enterprise licenses priced at USD 4750, USD 5250, and USD 8750 respectively.
10. Is the market size provided in terms of value or volume?
The market size is provided in terms of value, measured in Million.
11. Are there any specific market keywords associated with the report?
Yes, the market keyword associated with the report is "Medical Imaging Software Industry," which aids in identifying and referencing the specific market segment covered.
12. How do I determine which pricing option suits my needs best?
The pricing options vary based on user requirements and access needs. Individual users may opt for single-user licenses, while businesses requiring broader access may choose multi-user or enterprise licenses for cost-effective access to the report.
13. Are there any additional resources or data provided in the Medical Imaging Software Industry report?
While the report offers comprehensive insights, it's advisable to review the specific contents or supplementary materials provided to ascertain if additional resources or data are available.
14. How can I stay updated on further developments or reports in the Medical Imaging Software Industry?
To stay informed about further developments, trends, and reports in the Medical Imaging Software Industry, consider subscribing to industry newsletters, following relevant companies and organizations, or regularly checking reputable industry news sources and publications.
Methodology
Step 1 - Identification of Relevant Samples Size from Population Database


Step 2 - Approaches for Defining Global Market Size (Value, Volume* & Price*)

Note*: In applicable scenarios
Step 3 - Data Sources
Primary Research
- Web Analytics
- Survey Reports
- Research Institute
- Latest Research Reports
- Opinion Leaders
Secondary Research
- Annual Reports
- White Paper
- Latest Press Release
- Industry Association
- Paid Database
- Investor Presentations

Step 4 - Data Triangulation
Involves using different sources of information in order to increase the validity of a study
These sources are likely to be stakeholders in a program - participants, other researchers, program staff, other community members, and so on.
Then we put all data in single framework & apply various statistical tools to find out the dynamic on the market.
During the analysis stage, feedback from the stakeholder groups would be compared to determine areas of agreement as well as areas of divergence


