
Key Insights
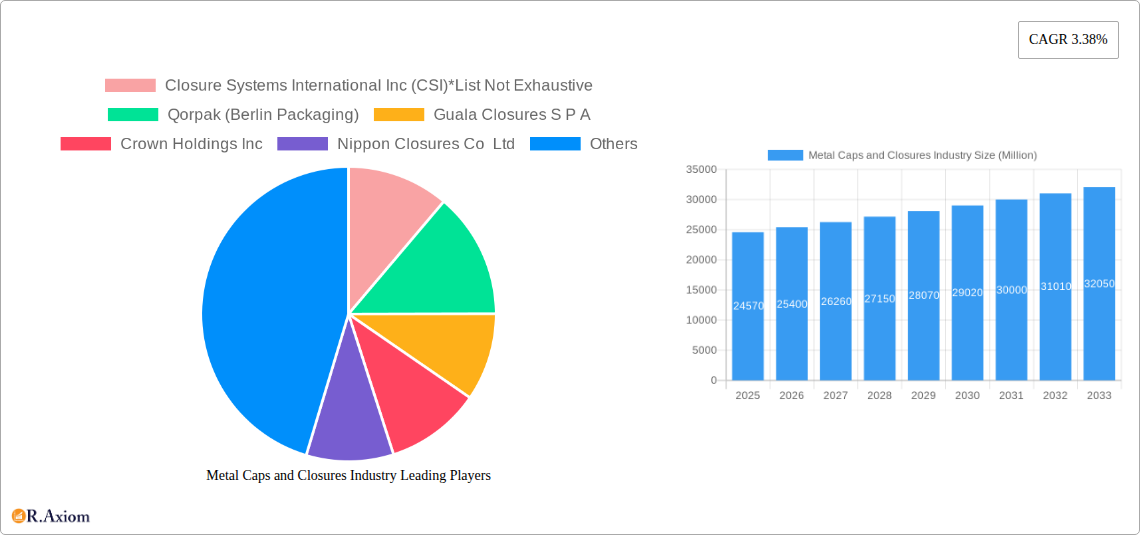
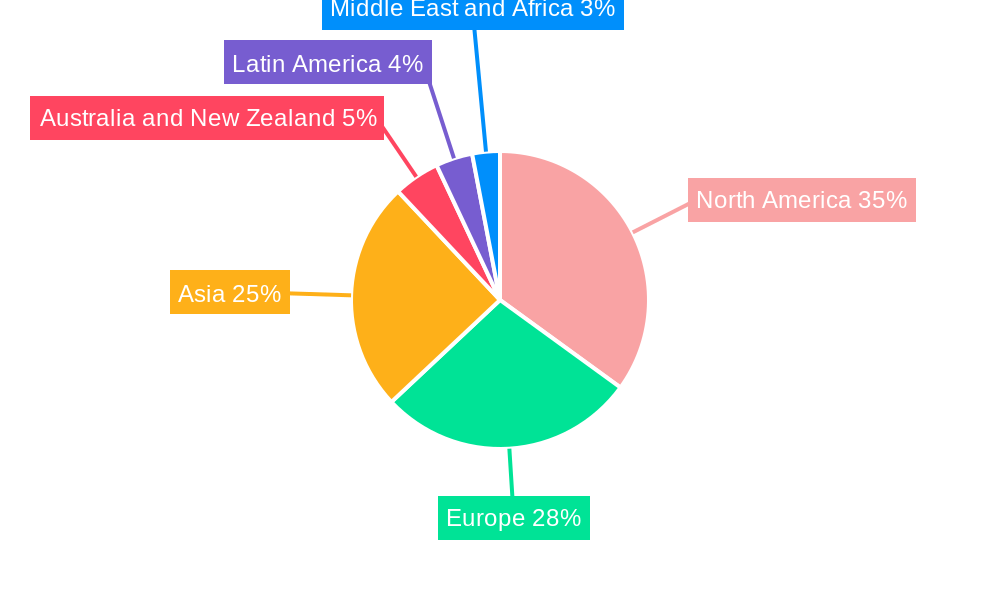
The global metal caps and closures market, valued at $24.57 billion in 2025, is projected to experience steady growth, driven primarily by the burgeoning food and beverage industry, particularly in developing economies. The increasing demand for convenient packaging solutions, coupled with the inherent properties of metal – durability, recyclability, and barrier protection – fuels market expansion. Aluminum, owing to its lightweight nature and recyclability, dominates the material segment, followed by steel and tin, each catering to specific product needs. Crown caps remain the leading closure type, although screw caps and twist-off metal caps are gaining traction due to consumer preference for ease of use. The pharmaceutical and personal care sectors represent significant end-user industries, demanding tamper-evident and hygienic closure solutions. Regional growth varies, with North America and Europe currently holding substantial market shares, while Asia-Pacific is expected to witness the fastest growth, fueled by rising disposable incomes and increasing consumption. Growth is, however, tempered by fluctuating raw material prices and the increasing popularity of alternative packaging materials like plastic, though the sustainability focus is pushing a renewed interest in recyclable metal options.
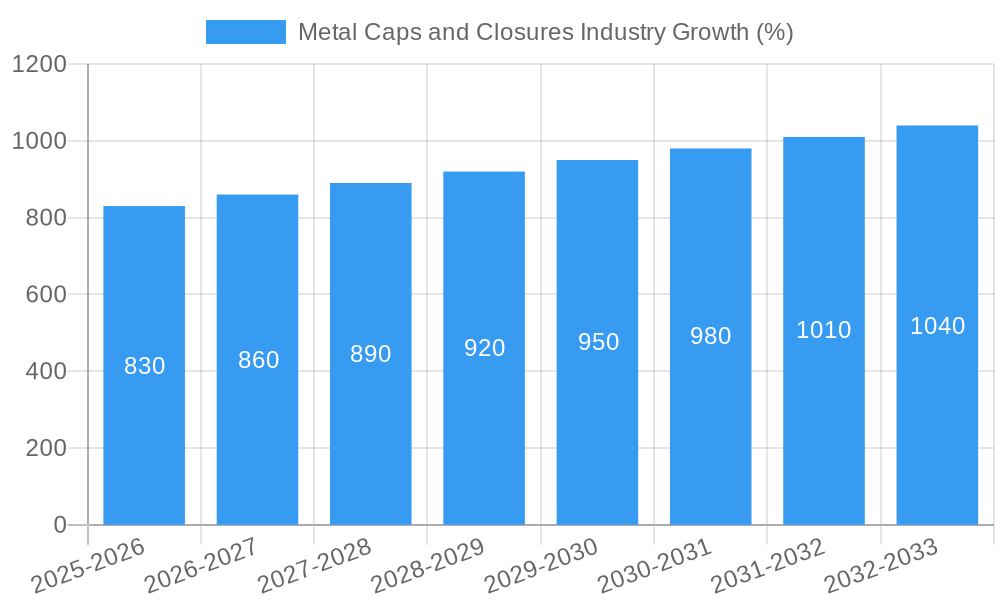
The forecast period (2025-2033) anticipates a continuation of this growth trajectory, with a Compound Annual Growth Rate (CAGR) of 3.38%. This growth will likely be propelled by innovation in closure design, focusing on enhanced tamper evidence, improved convenience, and sustainable practices. Companies like Closure Systems International, Crown Holdings, and Guala Closures are key players, constantly investing in research and development to meet evolving consumer demands and regulatory standards. Competitive pressures and technological advancements are further shaping the market landscape, leading to product diversification and strategic partnerships. While regional variations in growth rate will persist, the overall trend indicates a positive outlook for the metal caps and closures market in the coming years. The market will continue to be influenced by global economic factors, consumer trends, and technological innovations in packaging technology.
Metal Caps and Closures Industry: A Comprehensive Market Report (2019-2033)
This comprehensive report provides a detailed analysis of the global metal caps and closures industry, offering invaluable insights for stakeholders seeking to navigate this dynamic market. The study period covers 2019-2033, with 2025 as the base and estimated year. The report forecasts market trends from 2025-2033, analyzing historical data from 2019-2024. The global market value is estimated at xx Million in 2025, projected to reach xx Million by 2033.
Metal Caps and Closures Industry Market Concentration & Innovation
The metal caps and closures market exhibits a moderately concentrated structure, with several major players commanding significant market share. Key players like Crown Holdings Inc, Amcor PLC, and Guala Closures S.p.A. hold substantial portions of the market, while numerous smaller regional players and niche specialists complete the landscape. The market share of the top 5 players is estimated at xx%, indicating room for both consolidation and the emergence of innovative newcomers.
Innovation Drivers: Sustainability concerns are driving innovation, with a focus on lightweighting, recycled materials, and reduced environmental impact. Advancements in materials science, improved sealing technologies, and the integration of smart closures also contribute to innovation.
Regulatory Frameworks: Stringent food safety regulations and environmental mandates significantly influence product development and manufacturing processes. Compliance with these regulations is crucial for market entry and success.
Product Substitutes: The industry faces competition from alternative closure types, such as plastic caps and closures. However, the inherent strength, recyclability, and tamper-evident properties of metal caps and closures ensure sustained demand, particularly in the food and beverage sector.
End-User Trends: Consumer preferences for convenience and sustainability are shaping product design, resulting in closures with improved functionalities like easy-open features and eco-friendly materials.
M&A Activities: The industry has witnessed several mergers and acquisitions in recent years, primarily aimed at expanding market reach, acquiring specialized technologies, and increasing production capacity. Total M&A deal value over the past five years is estimated at xx Million. Examples of significant deals include (details not available for specific transactions).
Metal Caps and Closures Industry Industry Trends & Insights
The global metal caps and closures market is experiencing steady growth, driven by factors like the expanding food and beverage industry, increasing demand for convenient packaging, and the growing popularity of premium-quality products. The compound annual growth rate (CAGR) is projected to be xx% during the forecast period (2025-2033).
Technological advancements are significantly impacting the market. The adoption of automation and advanced manufacturing techniques has led to increased production efficiency, cost reduction, and improved product quality. Moreover, the use of lightweight materials and sustainable manufacturing processes is gaining traction due to growing environmental concerns.
Consumer preferences are also influencing the market. The demand for tamper-evident closures, easy-open caps, and closures with unique features is driving innovation and product diversification. The market penetration of sustainable closures is expected to reach xx% by 2033.
The competitive landscape is characterized by a mix of large multinational corporations and smaller specialized companies. Intense competition among these players is forcing continuous innovation, product differentiation, and strategic partnerships.
Dominant Markets & Segments in Metal Caps and Closures Industry
Leading Region: The Asia Pacific region dominates the global market, driven by high population density, rapidly expanding economies, and robust growth in the food and beverage sector.
Leading Country: China, with its significant food and beverage industries, is the leading country in the market.
Dominant Segments:
By Material Type: Aluminum dominates due to its lightweight nature, corrosion resistance, and recyclability. Steel retains a significant share for applications demanding high strength. Tinplate closures are popular for specific food and beverage applications, with high quality and safety standards.
By Closures Type: Crown caps maintain a leading position, particularly in the beverage industry. Screw caps are popular for a wide range of products due to their convenience and ease of use. Twist metal caps and other specialized closures (easy open ends, ROPP metal caps) cater to niche markets and consumer preferences.
By End-User Industry: Food and beverages are the largest end-user segments globally. Pharmaceuticals and personal care are growing segments due to increasing demand for tamper-evident and high-quality packaging.
Key Drivers for Dominant Segments:
- Economic Policies: Government support for food processing and manufacturing industries in developing economies stimulates growth.
- Infrastructure Development: Improved infrastructure facilities in emerging economies enhance distribution and logistics efficiency.
- Consumer Preferences: Growing demand for convenient and safe packaging drives the need for specific types of closures.
Metal Caps and Closures Industry Product Developments
Recent product innovations focus on sustainability, convenience, and improved functionality. Lightweight aluminum closures with enhanced barrier properties and the use of recycled materials are becoming increasingly common. Innovative designs featuring easy-open mechanisms and advanced tamper-evident features are also gaining traction. The integration of smart technologies, such as RFID tags, is emerging as a trend, albeit still at a nascent stage. These developments cater to the growing demand for sustainable and convenient packaging solutions while strengthening the competitiveness of metal closures.
Report Scope & Segmentation Analysis
This report comprehensively segments the metal caps and closures market by material type (aluminum, steel, tin), closure type (crown caps, screw caps, twist metal caps, other closures), and end-user industry (food, beverages, pharmaceuticals, personal care, other). Growth projections, market sizes, and competitive dynamics are provided for each segment.
By Material Type: The market is segmented based on the material used to produce caps and closures. Growth projections are influenced by factors such as material cost, recyclability, and suitability for specific applications.
By Closures Type: Different closure types cater to varied product needs and consumer preferences. Market sizes and growth prospects are analyzed based on factors like ease of use, sealing effectiveness, and aesthetic appeal.
By End-User Industry: The demand for metal caps and closures varies across industries. Growth projections consider factors like packaging requirements, regulatory standards, and industry-specific trends.
Key Drivers of Metal Caps and Closures Industry Growth
The industry's growth is fueled by factors like:
- Growing demand for packaged food and beverages: A rising global population coupled with changing lifestyles drives packaged food and beverage consumption.
- Increased focus on food safety and product integrity: Metal closures offer superior protection against contamination and tampering.
- Stringent regulations related to packaging: Demand for compliance with packaging regulations drives adoption of metal closures.
- Technological innovations in closure design and manufacturing: Advancements in manufacturing processes lead to cost-effective and efficient production.
Challenges in the Metal Caps and Closures Industry Sector
The sector faces challenges such as:
- Fluctuating raw material prices: Price volatility of metals like aluminum and steel significantly impacts production costs.
- Intense competition from alternative packaging materials: Plastic and other materials pose a competitive threat.
- Environmental concerns and sustainability pressure: The industry needs to adopt sustainable practices to meet environmental regulations and consumer demands.
- Supply chain disruptions: Global events can impact the availability of raw materials and affect production.
Emerging Opportunities in Metal Caps and Closures Industry
Emerging opportunities include:
- Growing demand for sustainable and eco-friendly closures: Increased focus on recyclability and the use of recycled materials presents opportunities.
- Expansion into new and emerging markets: Growing economies and rising middle classes in developing nations offer untapped potential.
- Integration of smart technologies: Incorporating technologies like RFID or sensors into closures enhances product traceability and security.
Leading Players in the Metal Caps and Closures Industry Market
- Closure Systems International Inc (CSI)
- Qorpak (Berlin Packaging)
- Guala Closures S P A
- Crown Holdings Inc
- Nippon Closures Co Ltd
- Amcor PLC
- Pelliconi & C SpA
- Sks Bottle & Packaging Inc
- Alameda Packaging LLC
- Silgan White Cap LLC
- O Berk Company
Key Developments in Metal Caps and Closures Industry Industry
January 2023: Guala Closures Group's SBTi validation for its 2030 GHG emission reduction targets highlights a significant step towards sustainability within the industry. This sets a benchmark for other players and underscores the growing importance of ESG considerations.
March 2022: Pelliconi's opening of an Outpost at the Mind the Bridge Innovation Center signifies a strategic move towards identifying future trends and collaborating with innovators in the US market. This demonstrates a commitment to staying at the forefront of technological advancements.
Strategic Outlook for Metal Caps and Closures Industry Market
The metal caps and closures market is poised for sustained growth, driven by consistent demand from the food and beverage industry, increasing consumer preference for convenient packaging, and the rising adoption of sustainable closures. Opportunities exist in developing innovative closures that address consumer needs for convenience and sustainability, expanding into high-growth markets, and leveraging technological advancements for enhanced efficiency and product traceability. Further consolidation through mergers and acquisitions is expected as major players seek to strengthen their market positions.
Metal Caps and Closures Industry Segmentation
-
1. Material Type
- 1.1. Aluminium
- 1.2. Steel
- 1.3. Tin
-
2. Closures Type
- 2.1. Crown Caps
- 2.2. Screw Caps
- 2.3. Twist Metal Caps
- 2.4. Other Cl
-
3. End-User Industry
- 3.1. Food
-
3.2. Beverages
- 3.2.1. Alcoholic
- 3.2.2. Non-Alcoholic
- 3.3. Pharmaceuticals
- 3.4. Personal Care
- 3.5. Other End-User Industries
Metal Caps and Closures Industry Segmentation By Geography
- 1. North America
- 2. Europe
- 3. Asia
- 4. Australia and New Zealand
- 5. Latin America
- 6. Middle East and Africa
Metal Caps and Closures Industry REPORT HIGHLIGHTS
| Aspects | Details |
|---|---|
| Study Period | 2019-2033 |
| Base Year | 2024 |
| Estimated Year | 2025 |
| Forecast Period | 2025-2033 |
| Historical Period | 2019-2024 |
| Growth Rate | CAGR of 3.38% from 2019-2033 |
| Segmentation |
|
Table of Contents
- 1. Introduction
- 1.1. Research Scope
- 1.2. Market Segmentation
- 1.3. Research Methodology
- 1.4. Definitions and Assumptions
- 2. Executive Summary
- 2.1. Introduction
- 3. Market Dynamics
- 3.1. Introduction
- 3.2. Market Drivers
- 3.2.1. Increasing Consumption of Beverages with a Rising Need for Sustainable Packaging Materials; Superior Properties Compared to Other Closure Materials
- 3.3. Market Restrains
- 3.3.1. High Adoption Rate of Other Types of Closure Materials
- 3.4. Market Trends
- 3.4.1. Pharmaceutical Application Offers Potential Growth
- 4. Market Factor Analysis
- 4.1. Porters Five Forces
- 4.2. Supply/Value Chain
- 4.3. PESTEL analysis
- 4.4. Market Entropy
- 4.5. Patent/Trademark Analysis
- 5. Global Metal Caps and Closures Industry Analysis, Insights and Forecast, 2019-2031
- 5.1. Market Analysis, Insights and Forecast - by Material Type
- 5.1.1. Aluminium
- 5.1.2. Steel
- 5.1.3. Tin
- 5.2. Market Analysis, Insights and Forecast - by Closures Type
- 5.2.1. Crown Caps
- 5.2.2. Screw Caps
- 5.2.3. Twist Metal Caps
- 5.2.4. Other Cl
- 5.3. Market Analysis, Insights and Forecast - by End-User Industry
- 5.3.1. Food
- 5.3.2. Beverages
- 5.3.2.1. Alcoholic
- 5.3.2.2. Non-Alcoholic
- 5.3.3. Pharmaceuticals
- 5.3.4. Personal Care
- 5.3.5. Other End-User Industries
- 5.4. Market Analysis, Insights and Forecast - by Region
- 5.4.1. North America
- 5.4.2. Europe
- 5.4.3. Asia
- 5.4.4. Australia and New Zealand
- 5.4.5. Latin America
- 5.4.6. Middle East and Africa
- 5.1. Market Analysis, Insights and Forecast - by Material Type
- 6. North America Metal Caps and Closures Industry Analysis, Insights and Forecast, 2019-2031
- 6.1. Market Analysis, Insights and Forecast - by Material Type
- 6.1.1. Aluminium
- 6.1.2. Steel
- 6.1.3. Tin
- 6.2. Market Analysis, Insights and Forecast - by Closures Type
- 6.2.1. Crown Caps
- 6.2.2. Screw Caps
- 6.2.3. Twist Metal Caps
- 6.2.4. Other Cl
- 6.3. Market Analysis, Insights and Forecast - by End-User Industry
- 6.3.1. Food
- 6.3.2. Beverages
- 6.3.2.1. Alcoholic
- 6.3.2.2. Non-Alcoholic
- 6.3.3. Pharmaceuticals
- 6.3.4. Personal Care
- 6.3.5. Other End-User Industries
- 6.1. Market Analysis, Insights and Forecast - by Material Type
- 7. Europe Metal Caps and Closures Industry Analysis, Insights and Forecast, 2019-2031
- 7.1. Market Analysis, Insights and Forecast - by Material Type
- 7.1.1. Aluminium
- 7.1.2. Steel
- 7.1.3. Tin
- 7.2. Market Analysis, Insights and Forecast - by Closures Type
- 7.2.1. Crown Caps
- 7.2.2. Screw Caps
- 7.2.3. Twist Metal Caps
- 7.2.4. Other Cl
- 7.3. Market Analysis, Insights and Forecast - by End-User Industry
- 7.3.1. Food
- 7.3.2. Beverages
- 7.3.2.1. Alcoholic
- 7.3.2.2. Non-Alcoholic
- 7.3.3. Pharmaceuticals
- 7.3.4. Personal Care
- 7.3.5. Other End-User Industries
- 7.1. Market Analysis, Insights and Forecast - by Material Type
- 8. Asia Metal Caps and Closures Industry Analysis, Insights and Forecast, 2019-2031
- 8.1. Market Analysis, Insights and Forecast - by Material Type
- 8.1.1. Aluminium
- 8.1.2. Steel
- 8.1.3. Tin
- 8.2. Market Analysis, Insights and Forecast - by Closures Type
- 8.2.1. Crown Caps
- 8.2.2. Screw Caps
- 8.2.3. Twist Metal Caps
- 8.2.4. Other Cl
- 8.3. Market Analysis, Insights and Forecast - by End-User Industry
- 8.3.1. Food
- 8.3.2. Beverages
- 8.3.2.1. Alcoholic
- 8.3.2.2. Non-Alcoholic
- 8.3.3. Pharmaceuticals
- 8.3.4. Personal Care
- 8.3.5. Other End-User Industries
- 8.1. Market Analysis, Insights and Forecast - by Material Type
- 9. Australia and New Zealand Metal Caps and Closures Industry Analysis, Insights and Forecast, 2019-2031
- 9.1. Market Analysis, Insights and Forecast - by Material Type
- 9.1.1. Aluminium
- 9.1.2. Steel
- 9.1.3. Tin
- 9.2. Market Analysis, Insights and Forecast - by Closures Type
- 9.2.1. Crown Caps
- 9.2.2. Screw Caps
- 9.2.3. Twist Metal Caps
- 9.2.4. Other Cl
- 9.3. Market Analysis, Insights and Forecast - by End-User Industry
- 9.3.1. Food
- 9.3.2. Beverages
- 9.3.2.1. Alcoholic
- 9.3.2.2. Non-Alcoholic
- 9.3.3. Pharmaceuticals
- 9.3.4. Personal Care
- 9.3.5. Other End-User Industries
- 9.1. Market Analysis, Insights and Forecast - by Material Type
- 10. Latin America Metal Caps and Closures Industry Analysis, Insights and Forecast, 2019-2031
- 10.1. Market Analysis, Insights and Forecast - by Material Type
- 10.1.1. Aluminium
- 10.1.2. Steel
- 10.1.3. Tin
- 10.2. Market Analysis, Insights and Forecast - by Closures Type
- 10.2.1. Crown Caps
- 10.2.2. Screw Caps
- 10.2.3. Twist Metal Caps
- 10.2.4. Other Cl
- 10.3. Market Analysis, Insights and Forecast - by End-User Industry
- 10.3.1. Food
- 10.3.2. Beverages
- 10.3.2.1. Alcoholic
- 10.3.2.2. Non-Alcoholic
- 10.3.3. Pharmaceuticals
- 10.3.4. Personal Care
- 10.3.5. Other End-User Industries
- 10.1. Market Analysis, Insights and Forecast - by Material Type
- 11. Middle East and Africa Metal Caps and Closures Industry Analysis, Insights and Forecast, 2019-2031
- 11.1. Market Analysis, Insights and Forecast - by Material Type
- 11.1.1. Aluminium
- 11.1.2. Steel
- 11.1.3. Tin
- 11.2. Market Analysis, Insights and Forecast - by Closures Type
- 11.2.1. Crown Caps
- 11.2.2. Screw Caps
- 11.2.3. Twist Metal Caps
- 11.2.4. Other Cl
- 11.3. Market Analysis, Insights and Forecast - by End-User Industry
- 11.3.1. Food
- 11.3.2. Beverages
- 11.3.2.1. Alcoholic
- 11.3.2.2. Non-Alcoholic
- 11.3.3. Pharmaceuticals
- 11.3.4. Personal Care
- 11.3.5. Other End-User Industries
- 11.1. Market Analysis, Insights and Forecast - by Material Type
- 12. North America Metal Caps and Closures Industry Analysis, Insights and Forecast, 2019-2031
- 12.1. Market Analysis, Insights and Forecast - By Country/Sub-region
- 12.1.1.
- 13. Europe Metal Caps and Closures Industry Analysis, Insights and Forecast, 2019-2031
- 13.1. Market Analysis, Insights and Forecast - By Country/Sub-region
- 13.1.1.
- 14. Asia Metal Caps and Closures Industry Analysis, Insights and Forecast, 2019-2031
- 14.1. Market Analysis, Insights and Forecast - By Country/Sub-region
- 14.1.1.
- 15. Australia and New Zealand Metal Caps and Closures Industry Analysis, Insights and Forecast, 2019-2031
- 15.1. Market Analysis, Insights and Forecast - By Country/Sub-region
- 15.1.1.
- 16. Latin America Metal Caps and Closures Industry Analysis, Insights and Forecast, 2019-2031
- 16.1. Market Analysis, Insights and Forecast - By Country/Sub-region
- 16.1.1.
- 17. Middle East and Africa Metal Caps and Closures Industry Analysis, Insights and Forecast, 2019-2031
- 17.1. Market Analysis, Insights and Forecast - By Country/Sub-region
- 17.1.1.
- 18. Competitive Analysis
- 18.1. Global Market Share Analysis 2024
- 18.2. Company Profiles
- 18.2.1 Closure Systems International Inc (CSI)*List Not Exhaustive
- 18.2.1.1. Overview
- 18.2.1.2. Products
- 18.2.1.3. SWOT Analysis
- 18.2.1.4. Recent Developments
- 18.2.1.5. Financials (Based on Availability)
- 18.2.2 Qorpak (Berlin Packaging)
- 18.2.2.1. Overview
- 18.2.2.2. Products
- 18.2.2.3. SWOT Analysis
- 18.2.2.4. Recent Developments
- 18.2.2.5. Financials (Based on Availability)
- 18.2.3 Guala Closures S P A
- 18.2.3.1. Overview
- 18.2.3.2. Products
- 18.2.3.3. SWOT Analysis
- 18.2.3.4. Recent Developments
- 18.2.3.5. Financials (Based on Availability)
- 18.2.4 Crown Holdings Inc
- 18.2.4.1. Overview
- 18.2.4.2. Products
- 18.2.4.3. SWOT Analysis
- 18.2.4.4. Recent Developments
- 18.2.4.5. Financials (Based on Availability)
- 18.2.5 Nippon Closures Co Ltd
- 18.2.5.1. Overview
- 18.2.5.2. Products
- 18.2.5.3. SWOT Analysis
- 18.2.5.4. Recent Developments
- 18.2.5.5. Financials (Based on Availability)
- 18.2.6 Amcor PLC
- 18.2.6.1. Overview
- 18.2.6.2. Products
- 18.2.6.3. SWOT Analysis
- 18.2.6.4. Recent Developments
- 18.2.6.5. Financials (Based on Availability)
- 18.2.7 Pelliconi & C SpA
- 18.2.7.1. Overview
- 18.2.7.2. Products
- 18.2.7.3. SWOT Analysis
- 18.2.7.4. Recent Developments
- 18.2.7.5. Financials (Based on Availability)
- 18.2.8 Sks Bottle & Packaging Inc
- 18.2.8.1. Overview
- 18.2.8.2. Products
- 18.2.8.3. SWOT Analysis
- 18.2.8.4. Recent Developments
- 18.2.8.5. Financials (Based on Availability)
- 18.2.9 Alameda Packaging LLC
- 18.2.9.1. Overview
- 18.2.9.2. Products
- 18.2.9.3. SWOT Analysis
- 18.2.9.4. Recent Developments
- 18.2.9.5. Financials (Based on Availability)
- 18.2.10 Silgan White Cap LLC
- 18.2.10.1. Overview
- 18.2.10.2. Products
- 18.2.10.3. SWOT Analysis
- 18.2.10.4. Recent Developments
- 18.2.10.5. Financials (Based on Availability)
- 18.2.11 O Berk Company
- 18.2.11.1. Overview
- 18.2.11.2. Products
- 18.2.11.3. SWOT Analysis
- 18.2.11.4. Recent Developments
- 18.2.11.5. Financials (Based on Availability)
- 18.2.1 Closure Systems International Inc (CSI)*List Not Exhaustive
List of Figures
- Figure 1: Global Metal Caps and Closures Industry Revenue Breakdown (Million, %) by Region 2024 & 2032
- Figure 2: North America Metal Caps and Closures Industry Revenue (Million), by Country 2024 & 2032
- Figure 3: North America Metal Caps and Closures Industry Revenue Share (%), by Country 2024 & 2032
- Figure 4: Europe Metal Caps and Closures Industry Revenue (Million), by Country 2024 & 2032
- Figure 5: Europe Metal Caps and Closures Industry Revenue Share (%), by Country 2024 & 2032
- Figure 6: Asia Metal Caps and Closures Industry Revenue (Million), by Country 2024 & 2032
- Figure 7: Asia Metal Caps and Closures Industry Revenue Share (%), by Country 2024 & 2032
- Figure 8: Australia and New Zealand Metal Caps and Closures Industry Revenue (Million), by Country 2024 & 2032
- Figure 9: Australia and New Zealand Metal Caps and Closures Industry Revenue Share (%), by Country 2024 & 2032
- Figure 10: Latin America Metal Caps and Closures Industry Revenue (Million), by Country 2024 & 2032
- Figure 11: Latin America Metal Caps and Closures Industry Revenue Share (%), by Country 2024 & 2032
- Figure 12: Middle East and Africa Metal Caps and Closures Industry Revenue (Million), by Country 2024 & 2032
- Figure 13: Middle East and Africa Metal Caps and Closures Industry Revenue Share (%), by Country 2024 & 2032
- Figure 14: North America Metal Caps and Closures Industry Revenue (Million), by Material Type 2024 & 2032
- Figure 15: North America Metal Caps and Closures Industry Revenue Share (%), by Material Type 2024 & 2032
- Figure 16: North America Metal Caps and Closures Industry Revenue (Million), by Closures Type 2024 & 2032
- Figure 17: North America Metal Caps and Closures Industry Revenue Share (%), by Closures Type 2024 & 2032
- Figure 18: North America Metal Caps and Closures Industry Revenue (Million), by End-User Industry 2024 & 2032
- Figure 19: North America Metal Caps and Closures Industry Revenue Share (%), by End-User Industry 2024 & 2032
- Figure 20: North America Metal Caps and Closures Industry Revenue (Million), by Country 2024 & 2032
- Figure 21: North America Metal Caps and Closures Industry Revenue Share (%), by Country 2024 & 2032
- Figure 22: Europe Metal Caps and Closures Industry Revenue (Million), by Material Type 2024 & 2032
- Figure 23: Europe Metal Caps and Closures Industry Revenue Share (%), by Material Type 2024 & 2032
- Figure 24: Europe Metal Caps and Closures Industry Revenue (Million), by Closures Type 2024 & 2032
- Figure 25: Europe Metal Caps and Closures Industry Revenue Share (%), by Closures Type 2024 & 2032
- Figure 26: Europe Metal Caps and Closures Industry Revenue (Million), by End-User Industry 2024 & 2032
- Figure 27: Europe Metal Caps and Closures Industry Revenue Share (%), by End-User Industry 2024 & 2032
- Figure 28: Europe Metal Caps and Closures Industry Revenue (Million), by Country 2024 & 2032
- Figure 29: Europe Metal Caps and Closures Industry Revenue Share (%), by Country 2024 & 2032
- Figure 30: Asia Metal Caps and Closures Industry Revenue (Million), by Material Type 2024 & 2032
- Figure 31: Asia Metal Caps and Closures Industry Revenue Share (%), by Material Type 2024 & 2032
- Figure 32: Asia Metal Caps and Closures Industry Revenue (Million), by Closures Type 2024 & 2032
- Figure 33: Asia Metal Caps and Closures Industry Revenue Share (%), by Closures Type 2024 & 2032
- Figure 34: Asia Metal Caps and Closures Industry Revenue (Million), by End-User Industry 2024 & 2032
- Figure 35: Asia Metal Caps and Closures Industry Revenue Share (%), by End-User Industry 2024 & 2032
- Figure 36: Asia Metal Caps and Closures Industry Revenue (Million), by Country 2024 & 2032
- Figure 37: Asia Metal Caps and Closures Industry Revenue Share (%), by Country 2024 & 2032
- Figure 38: Australia and New Zealand Metal Caps and Closures Industry Revenue (Million), by Material Type 2024 & 2032
- Figure 39: Australia and New Zealand Metal Caps and Closures Industry Revenue Share (%), by Material Type 2024 & 2032
- Figure 40: Australia and New Zealand Metal Caps and Closures Industry Revenue (Million), by Closures Type 2024 & 2032
- Figure 41: Australia and New Zealand Metal Caps and Closures Industry Revenue Share (%), by Closures Type 2024 & 2032
- Figure 42: Australia and New Zealand Metal Caps and Closures Industry Revenue (Million), by End-User Industry 2024 & 2032
- Figure 43: Australia and New Zealand Metal Caps and Closures Industry Revenue Share (%), by End-User Industry 2024 & 2032
- Figure 44: Australia and New Zealand Metal Caps and Closures Industry Revenue (Million), by Country 2024 & 2032
- Figure 45: Australia and New Zealand Metal Caps and Closures Industry Revenue Share (%), by Country 2024 & 2032
- Figure 46: Latin America Metal Caps and Closures Industry Revenue (Million), by Material Type 2024 & 2032
- Figure 47: Latin America Metal Caps and Closures Industry Revenue Share (%), by Material Type 2024 & 2032
- Figure 48: Latin America Metal Caps and Closures Industry Revenue (Million), by Closures Type 2024 & 2032
- Figure 49: Latin America Metal Caps and Closures Industry Revenue Share (%), by Closures Type 2024 & 2032
- Figure 50: Latin America Metal Caps and Closures Industry Revenue (Million), by End-User Industry 2024 & 2032
- Figure 51: Latin America Metal Caps and Closures Industry Revenue Share (%), by End-User Industry 2024 & 2032
- Figure 52: Latin America Metal Caps and Closures Industry Revenue (Million), by Country 2024 & 2032
- Figure 53: Latin America Metal Caps and Closures Industry Revenue Share (%), by Country 2024 & 2032
- Figure 54: Middle East and Africa Metal Caps and Closures Industry Revenue (Million), by Material Type 2024 & 2032
- Figure 55: Middle East and Africa Metal Caps and Closures Industry Revenue Share (%), by Material Type 2024 & 2032
- Figure 56: Middle East and Africa Metal Caps and Closures Industry Revenue (Million), by Closures Type 2024 & 2032
- Figure 57: Middle East and Africa Metal Caps and Closures Industry Revenue Share (%), by Closures Type 2024 & 2032
- Figure 58: Middle East and Africa Metal Caps and Closures Industry Revenue (Million), by End-User Industry 2024 & 2032
- Figure 59: Middle East and Africa Metal Caps and Closures Industry Revenue Share (%), by End-User Industry 2024 & 2032
- Figure 60: Middle East and Africa Metal Caps and Closures Industry Revenue (Million), by Country 2024 & 2032
- Figure 61: Middle East and Africa Metal Caps and Closures Industry Revenue Share (%), by Country 2024 & 2032
List of Tables
- Table 1: Global Metal Caps and Closures Industry Revenue Million Forecast, by Region 2019 & 2032
- Table 2: Global Metal Caps and Closures Industry Revenue Million Forecast, by Material Type 2019 & 2032
- Table 3: Global Metal Caps and Closures Industry Revenue Million Forecast, by Closures Type 2019 & 2032
- Table 4: Global Metal Caps and Closures Industry Revenue Million Forecast, by End-User Industry 2019 & 2032
- Table 5: Global Metal Caps and Closures Industry Revenue Million Forecast, by Region 2019 & 2032
- Table 6: Global Metal Caps and Closures Industry Revenue Million Forecast, by Country 2019 & 2032
- Table 7: Metal Caps and Closures Industry Revenue (Million) Forecast, by Application 2019 & 2032
- Table 8: Global Metal Caps and Closures Industry Revenue Million Forecast, by Country 2019 & 2032
- Table 9: Metal Caps and Closures Industry Revenue (Million) Forecast, by Application 2019 & 2032
- Table 10: Global Metal Caps and Closures Industry Revenue Million Forecast, by Country 2019 & 2032
- Table 11: Metal Caps and Closures Industry Revenue (Million) Forecast, by Application 2019 & 2032
- Table 12: Global Metal Caps and Closures Industry Revenue Million Forecast, by Country 2019 & 2032
- Table 13: Metal Caps and Closures Industry Revenue (Million) Forecast, by Application 2019 & 2032
- Table 14: Global Metal Caps and Closures Industry Revenue Million Forecast, by Country 2019 & 2032
- Table 15: Metal Caps and Closures Industry Revenue (Million) Forecast, by Application 2019 & 2032
- Table 16: Global Metal Caps and Closures Industry Revenue Million Forecast, by Country 2019 & 2032
- Table 17: Metal Caps and Closures Industry Revenue (Million) Forecast, by Application 2019 & 2032
- Table 18: Global Metal Caps and Closures Industry Revenue Million Forecast, by Material Type 2019 & 2032
- Table 19: Global Metal Caps and Closures Industry Revenue Million Forecast, by Closures Type 2019 & 2032
- Table 20: Global Metal Caps and Closures Industry Revenue Million Forecast, by End-User Industry 2019 & 2032
- Table 21: Global Metal Caps and Closures Industry Revenue Million Forecast, by Country 2019 & 2032
- Table 22: Global Metal Caps and Closures Industry Revenue Million Forecast, by Material Type 2019 & 2032
- Table 23: Global Metal Caps and Closures Industry Revenue Million Forecast, by Closures Type 2019 & 2032
- Table 24: Global Metal Caps and Closures Industry Revenue Million Forecast, by End-User Industry 2019 & 2032
- Table 25: Global Metal Caps and Closures Industry Revenue Million Forecast, by Country 2019 & 2032
- Table 26: Global Metal Caps and Closures Industry Revenue Million Forecast, by Material Type 2019 & 2032
- Table 27: Global Metal Caps and Closures Industry Revenue Million Forecast, by Closures Type 2019 & 2032
- Table 28: Global Metal Caps and Closures Industry Revenue Million Forecast, by End-User Industry 2019 & 2032
- Table 29: Global Metal Caps and Closures Industry Revenue Million Forecast, by Country 2019 & 2032
- Table 30: Global Metal Caps and Closures Industry Revenue Million Forecast, by Material Type 2019 & 2032
- Table 31: Global Metal Caps and Closures Industry Revenue Million Forecast, by Closures Type 2019 & 2032
- Table 32: Global Metal Caps and Closures Industry Revenue Million Forecast, by End-User Industry 2019 & 2032
- Table 33: Global Metal Caps and Closures Industry Revenue Million Forecast, by Country 2019 & 2032
- Table 34: Global Metal Caps and Closures Industry Revenue Million Forecast, by Material Type 2019 & 2032
- Table 35: Global Metal Caps and Closures Industry Revenue Million Forecast, by Closures Type 2019 & 2032
- Table 36: Global Metal Caps and Closures Industry Revenue Million Forecast, by End-User Industry 2019 & 2032
- Table 37: Global Metal Caps and Closures Industry Revenue Million Forecast, by Country 2019 & 2032
- Table 38: Global Metal Caps and Closures Industry Revenue Million Forecast, by Material Type 2019 & 2032
- Table 39: Global Metal Caps and Closures Industry Revenue Million Forecast, by Closures Type 2019 & 2032
- Table 40: Global Metal Caps and Closures Industry Revenue Million Forecast, by End-User Industry 2019 & 2032
- Table 41: Global Metal Caps and Closures Industry Revenue Million Forecast, by Country 2019 & 2032
Frequently Asked Questions
1. What is the projected Compound Annual Growth Rate (CAGR) of the Metal Caps and Closures Industry?
The projected CAGR is approximately 3.38%.
2. Which companies are prominent players in the Metal Caps and Closures Industry?
Key companies in the market include Closure Systems International Inc (CSI)*List Not Exhaustive, Qorpak (Berlin Packaging), Guala Closures S P A, Crown Holdings Inc, Nippon Closures Co Ltd, Amcor PLC, Pelliconi & C SpA, Sks Bottle & Packaging Inc, Alameda Packaging LLC, Silgan White Cap LLC, O Berk Company.
3. What are the main segments of the Metal Caps and Closures Industry?
The market segments include Material Type, Closures Type, End-User Industry.
4. Can you provide details about the market size?
The market size is estimated to be USD 24.57 Million as of 2022.
5. What are some drivers contributing to market growth?
Increasing Consumption of Beverages with a Rising Need for Sustainable Packaging Materials; Superior Properties Compared to Other Closure Materials.
6. What are the notable trends driving market growth?
Pharmaceutical Application Offers Potential Growth.
7. Are there any restraints impacting market growth?
High Adoption Rate of Other Types of Closure Materials.
8. Can you provide examples of recent developments in the market?
January 2023: Guala Closures Group, a prominent manufacturer of aluminum and specialty closures, received validation from the Science Based Targets Initiative (SBTi) for its 2030 Greenhouse Gas (GHG) emission targets. The targets have been recognized as meeting the ambitious 1.5°C goal, which is a significant milestone in the group's sustainability journey. The company has pledged to reduce absolute scope 1 and 2 GHG emissions by 44% by 2030, based on a 2020 starting point, by adopting science-based targets.
9. What pricing options are available for accessing the report?
Pricing options include single-user, multi-user, and enterprise licenses priced at USD 4750, USD 5250, and USD 8750 respectively.
10. Is the market size provided in terms of value or volume?
The market size is provided in terms of value, measured in Million.
11. Are there any specific market keywords associated with the report?
Yes, the market keyword associated with the report is "Metal Caps and Closures Industry," which aids in identifying and referencing the specific market segment covered.
12. How do I determine which pricing option suits my needs best?
The pricing options vary based on user requirements and access needs. Individual users may opt for single-user licenses, while businesses requiring broader access may choose multi-user or enterprise licenses for cost-effective access to the report.
13. Are there any additional resources or data provided in the Metal Caps and Closures Industry report?
While the report offers comprehensive insights, it's advisable to review the specific contents or supplementary materials provided to ascertain if additional resources or data are available.
14. How can I stay updated on further developments or reports in the Metal Caps and Closures Industry?
To stay informed about further developments, trends, and reports in the Metal Caps and Closures Industry, consider subscribing to industry newsletters, following relevant companies and organizations, or regularly checking reputable industry news sources and publications.
Methodology
Step 1 - Identification of Relevant Samples Size from Population Database


Step 2 - Approaches for Defining Global Market Size (Value, Volume* & Price*)

Note*: In applicable scenarios
Step 3 - Data Sources
Primary Research
- Web Analytics
- Survey Reports
- Research Institute
- Latest Research Reports
- Opinion Leaders
Secondary Research
- Annual Reports
- White Paper
- Latest Press Release
- Industry Association
- Paid Database
- Investor Presentations

Step 4 - Data Triangulation
Involves using different sources of information in order to increase the validity of a study
These sources are likely to be stakeholders in a program - participants, other researchers, program staff, other community members, and so on.
Then we put all data in single framework & apply various statistical tools to find out the dynamic on the market.
During the analysis stage, feedback from the stakeholder groups would be compared to determine areas of agreement as well as areas of divergence


