

Key Insights
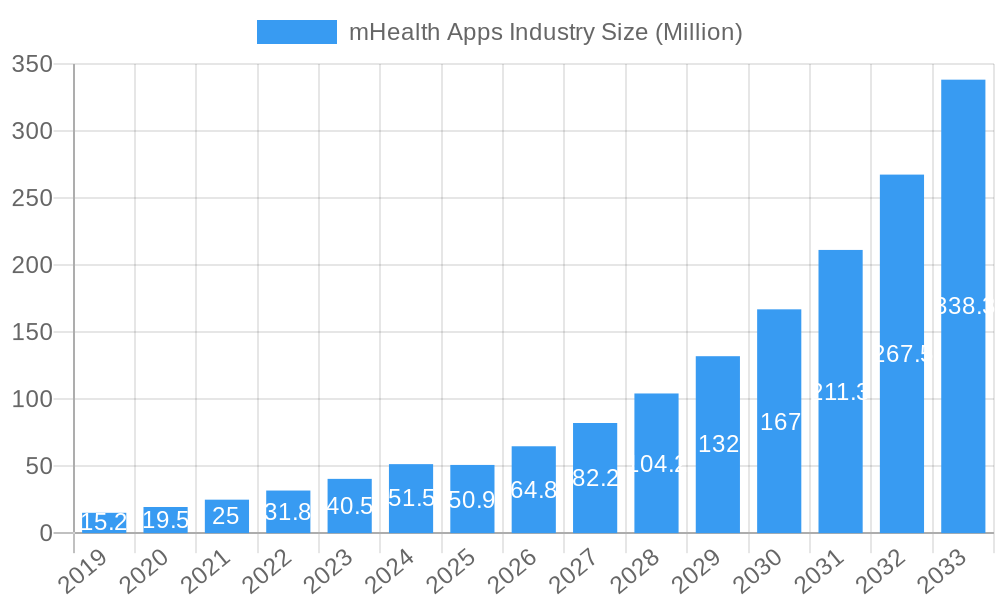
The mHealth Apps market is poised for explosive growth, projected to reach a substantial $50.9 million in 2025 with an exceptional Compound Annual Growth Rate (CAGR) of 27.30% through 2033. This remarkable expansion is fueled by a confluence of compelling drivers, primarily the increasing prevalence of chronic diseases globally and the escalating demand for remote patient monitoring. As populations age and healthcare systems grapple with resource constraints, the inherent efficiency and accessibility offered by mHealth solutions become paramount. Telemedicine is democratizing healthcare access, particularly in underserved regions, enabling real-time consultations, diagnostics, and treatment adherence monitoring. Furthermore, the growing adoption of wearable devices and sophisticated biosensors is providing a rich stream of physiological data, empowering individuals to take a proactive role in their health and wellness journeys. This surge in demand is transforming how healthcare is delivered and consumed, making mHealth apps indispensable tools for both patients and providers.
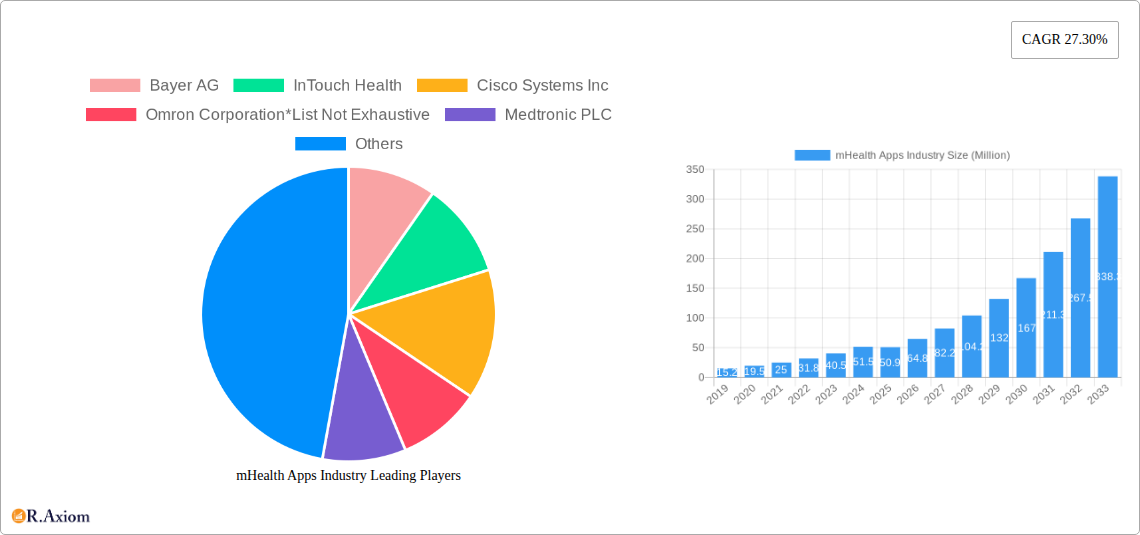
mHealth Apps Industry Market Size (In Million)
The mHealth Apps landscape is characterized by a diverse array of service types, including vital monitoring services for independent aging, chronic disease management, and post-acute care. Diagnostic services are also rapidly evolving with self-diagnosis tools and advanced telemedicine solutions. Treatment services, encompassing remote patient monitoring and teleconsultation, are central to this growth. The market is further segmented by device types, ranging from essential blood glucose and cardiac monitors to advanced neurological and respiratory devices, all seamlessly integrated with remote patient monitoring devices. Key stakeholders, including mobile operators, healthcare providers, and content players, are actively investing in this burgeoning ecosystem. Major companies such as Bayer AG, Philips NV, and Medtronic PLC are at the forefront, innovating to capitalize on the immense opportunities presented by this dynamic market, which is experiencing robust adoption across North America, Europe, and the rapidly expanding Asia Pacific region.
mHealth Apps Industry Company Market Share
This in-depth report provides a definitive analysis of the mHealth Apps Industry, forecasting market trajectory from 2019 to 2033 with a base year of 2025. Delve into intricate market dynamics, technological innovations, regulatory landscapes, and competitive strategies shaping the future of mobile health. This report is an essential resource for stakeholders seeking to understand market concentration, identify growth drivers, navigate challenges, and capitalize on emerging opportunities within this rapidly evolving sector.
mHealth Apps Industry Market Concentration & Innovation
The mHealth Apps Industry exhibits a moderate to high market concentration, driven by significant investment in digital health solutions and an increasing adoption of smartphones and wearable technology. Innovation is primarily fueled by advancements in artificial intelligence (AI), machine learning (ML), and the Internet of Medical Things (IoMT), enabling more sophisticated remote patient monitoring and personalized healthcare. Regulatory frameworks, such as HIPAA in the US and GDPR in Europe, are critical in shaping data privacy and security standards, influencing product development and market entry strategies. Product substitutes, while present in traditional healthcare delivery, are increasingly being augmented or replaced by mHealth solutions, especially in chronic disease management and post-acute care. End-user trends reveal a strong preference for convenient, accessible, and personalized health management tools. Mergers and Acquisitions (M&A) activities are robust, with significant deal values indicating consolidation and strategic expansion by major players. For instance, acquisitions in the remote patient monitoring space often exceed hundreds of millions of dollars, consolidating market share and technological capabilities. The market share of leading players in specific segments, like chronic disease management apps, can range from 10% to 25%.
mHealth Apps Industry Industry Trends & Insights
The mHealth Apps Industry is poised for substantial growth, driven by a confluence of factors including an aging global population, the increasing prevalence of chronic diseases, and a growing consumer demand for proactive health management. The projected Compound Annual Growth Rate (CAGR) for the mHealth Apps Industry is approximately 18-22% during the forecast period (2025-2033). This rapid expansion is underpinned by technological disruptions such as the widespread integration of wearable sensors, the advent of 5G networks enabling real-time data transmission, and the deployment of AI-powered diagnostic and predictive analytics. Consumer preferences are shifting towards preventative care and self-management, with a significant portion of the population (estimated at 70-80% in developed markets) owning smartphones capable of supporting health applications. Competitive dynamics are characterized by intense innovation, strategic partnerships between tech companies and healthcare providers, and a focus on user experience and data security. Market penetration is expected to reach over 60% in developed economies by 2030, reflecting the growing acceptance and integration of mHealth solutions into mainstream healthcare delivery. Telemedicine and remote patient monitoring are no longer niche services but are becoming integral components of healthcare ecosystems, driving demand for sophisticated and user-friendly mHealth applications.
Dominant Markets & Segments in mHealth Apps Industry
North America currently dominates the mHealth Apps Industry market, with the United States leading due to its advanced healthcare infrastructure, high smartphone penetration, and significant investments in digital health innovation. Economic policies supporting telehealth and remote patient monitoring, coupled with robust reimbursement frameworks, further bolster this dominance.
Service Type Dominance:
- Monitoring Services: This segment is a significant revenue generator, particularly Chronic Disease Management, which sees extensive application in conditions like diabetes, cardiovascular diseases, and respiratory ailments.
- Drivers: Rising prevalence of chronic conditions, aging population, need for continuous patient oversight.
- Market Share: Accounts for an estimated 35-40% of the total mHealth services market.
- Diagnostic Services: Telemedicine Solutions are witnessing rapid growth, facilitating remote consultations and initial diagnoses.
- Drivers: Improved access to healthcare, reduction in healthcare costs, convenience for patients.
- Market Share: Expected to grow at a CAGR of over 20% in the forecast period.
- Treatment Services: Remote Patient Monitoring Services are crucial for post-operative care and managing ongoing treatment plans.
- Drivers: Enhanced patient outcomes, reduced hospital readmissions, efficient resource allocation.
- Market Share: A rapidly expanding segment, projected to contribute 25-30% of the market by 2033.
- Wellness and Fitness Solutions: This segment, while mature, continues to drive adoption due to its broad consumer appeal.
Device Type Dominance:
- Remote Patient Monitoring Devices: These devices, including smart wearables and connected medical equipment, are central to the growth of mHealth.
- Drivers: Integration with monitoring services, real-time data collection capabilities.
- Market Share: Estimated to capture 30-35% of the device market.
- Blood Glucose Monitors: Driven by the high prevalence of diabetes, these devices remain a cornerstone of mHealth.
- Drivers: Increasing diabetes rates, demand for self-management tools.
- Cardiac Monitors: Essential for managing cardiovascular diseases, this category sees continuous innovation.
- Drivers: High incidence of heart-related issues, need for continuous cardiac event detection.
Stakeholder Dominance:
- Healthcare Providers: These are the primary adopters and integrators of mHealth solutions, leveraging them to improve patient care and operational efficiency.
- Drivers: Need for value-based care, efficiency gains, improved patient engagement.
- Application/Content Players: Companies developing and distributing mHealth apps are crucial to market growth.
- Drivers: Innovation in app features, user-centric design, data analytics.
mHealth Apps Industry Product Developments
Product developments in the mHealth Apps Industry are characterized by a strong emphasis on integration, personalization, and AI-driven insights. Innovations include sophisticated wearable sensors for continuous physiological monitoring, mobile applications that leverage AI for early disease detection and personalized treatment recommendations, and platforms that seamlessly connect patients, providers, and payers. Competitive advantages are being built around user-friendly interfaces, robust data security protocols, and the ability to provide actionable insights from collected health data, thereby enhancing patient engagement and improving clinical outcomes.
Report Scope & Segmentation Analysis
The mHealth Apps Industry market is meticulously segmented to provide granular insights. Key segmentation includes:
- Service Type: Monitoring Services (Independent Aging Solutions, Chronic Disease Management, Post-acute Care Services), Diagnostic Services (Self Diagnosis, Telemedicine Solutions, Medical), Treatment Services (Remote Patient Monitoring Services, Teleconsultation), and Wellness and Fitness Solutions. Growth projections for Monitoring Services and Treatment Services are robust, with anticipated market sizes exceeding several hundred million dollars by 2033.
- Device Type: Blood Glucose Monitors, Cardiac Monitors, Hemodynamic Monitors, Neurological Monitors, Respiratory Monitors, Body and Temperature Monitors, Remote Patient Monitoring Devices, and Other Device Types. Remote Patient Monitoring Devices are projected to see a CAGR of over 20%, becoming a dominant segment.
- Stake Holder: Mobile Operators, Healthcare Providers, Application/Content Players, and Other Stake Holders. Healthcare Providers and Application/Content Players are expected to exhibit the highest growth in terms of adoption and market influence.
Key Drivers of mHealth Apps Industry Growth
Key drivers propelling the mHealth Apps Industry include the increasing global prevalence of chronic diseases, necessitating continuous monitoring and management. Technological advancements, particularly in AI, IoT, and 5G, are enabling more sophisticated and accessible mHealth solutions. Furthermore, a growing consumer awareness and demand for personalized, preventative healthcare, coupled with favorable government initiatives and reimbursement policies supporting telehealth and digital health, are significant growth catalysts.
Challenges in the mHealth Apps Industry Sector
The mHealth Apps Industry faces several challenges, including stringent regulatory hurdles and data privacy concerns that can slow down product development and market entry. Interoperability issues between different mHealth platforms and existing healthcare IT systems remain a significant barrier. Moreover, the digital divide, where access to smartphones and reliable internet connectivity is limited, restricts market penetration in certain demographics and regions. High initial development costs and the need for continuous updates and maintenance also pose challenges.
Emerging Opportunities in mHealth Apps Industry
Emerging opportunities lie in the expansion of AI-driven predictive analytics for early disease intervention and personalized wellness programs. The integration of mHealth with augmented reality (AR) and virtual reality (VR) for remote diagnostics and therapeutic interventions presents a significant growth avenue. Furthermore, the increasing adoption of mHealth in emerging economies, driven by a rising middle class and a growing need for accessible healthcare, offers substantial market potential. The development of specialized mHealth apps for mental health and preventative care also represents a significant untapped market.
Leading Players in the mHealth Apps Industry Market
- Bayer AG
- InTouch Health
- Cisco Systems Inc
- Omron Corporation
- Medtronic PLC
- Cerner Corporation
- Koninklijke Philips NV
- Johnson & Johnson
- AT&T Inc
- Athenahealth Inc
Key Developments in mHealth Apps Industry Industry
- 2023 Q4: Launch of advanced AI-powered diagnostic tools by several application providers, enhancing early detection capabilities.
- 2023 Q3: Significant strategic partnerships formed between major mobile operators and healthcare technology companies to expand 5G-enabled mHealth services.
- 2023 Q2: Increased investment in remote patient monitoring platforms, with deal values exceeding $500 Million in several instances.
- 2023 Q1: Regulatory bodies issuing updated guidelines for data security and privacy in mHealth apps, prompting platform upgrades.
- 2022 Q4: Introduction of new wearable devices with enhanced biosensing capabilities for continuous cardiac and neurological monitoring.
- 2022 Q3: Expansion of telemedicine solutions into underserved rural areas, leveraging partnerships with local healthcare clinics.
- 2022 Q2: Major pharmaceutical companies increasing their focus on digital therapeutics and companion mHealth apps for their drug portfolios.
- 2022 Q1: Growing interest in mHealth solutions for mental health support and behavioral therapy applications.
- 2021: Continued consolidation in the mHealth market with several key acquisitions of smaller, specialized app developers.
Strategic Outlook for mHealth Apps Industry Market
The strategic outlook for the mHealth Apps Industry is exceptionally positive, driven by the ongoing digital transformation of healthcare. Key growth catalysts include the deepening integration of mHealth with electronic health records (EHRs), the development of personalized medicine through data analytics, and the increasing focus on preventative and population health management strategies. Future market expansion will be fueled by advancements in wearable technology, the continued growth of telemedicine, and the increasing demand for patient-centric care solutions, promising sustained innovation and market penetration across diverse healthcare verticals.
mHealth Apps Industry Segmentation
-
1. Service Type
-
1.1. Monitoring Services
- 1.1.1. Independent Aging Solutions
- 1.1.2. Chronic Disease Management
- 1.1.3. Post-acute Care Services
-
1.2. Diagnostic Services
- 1.2.1. Self Diagnosis
- 1.2.2. Telemedicine Solutions
- 1.2.3. Medical
-
1.3. Treatment Services
- 1.3.1. Remote Patient Monitoring Services
- 1.3.2. Teleconsultation
- 1.4. Wellness and Fitness Solutions
- 1.5. Other Se
-
1.1. Monitoring Services
-
2. Device Type
- 2.1. Blood Glucose Monitors
- 2.2. Cardiac Monitors
- 2.3. Hemodynamic Monitors
- 2.4. Neurological Monitors
- 2.5. Respiratory Monitors
- 2.6. Body and Temperature Monitors
- 2.7. Remote Patient Monitoring Devices
- 2.8. Other Device Types
-
3. Stake Holder
- 3.1. Mobile Operators
- 3.2. Healthcare Providers
- 3.3. Application/Content Players
- 3.4. Other Stake Holders
mHealth Apps Industry Segmentation By Geography
-
1. North America
- 1.1. United States
- 1.2. Canada
- 1.3. Mexico
-
2. South America
- 2.1. Brazil
- 2.2. Argentina
- 2.3. Rest of South America
-
3. Europe
- 3.1. United Kingdom
- 3.2. Germany
- 3.3. France
- 3.4. Italy
- 3.5. Spain
- 3.6. Russia
- 3.7. Benelux
- 3.8. Nordics
- 3.9. Rest of Europe
-
4. Middle East & Africa
- 4.1. Turkey
- 4.2. Israel
- 4.3. GCC
- 4.4. North Africa
- 4.5. South Africa
- 4.6. Rest of Middle East & Africa
-
5. Asia Pacific
- 5.1. China
- 5.2. India
- 5.3. Japan
- 5.4. South Korea
- 5.5. ASEAN
- 5.6. Oceania
- 5.7. Rest of Asia Pacific
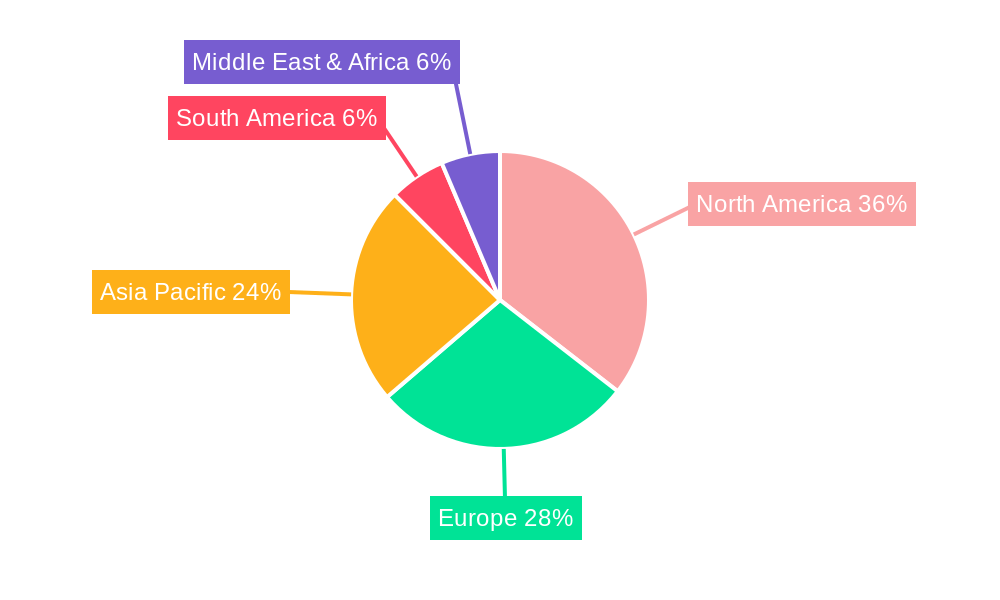
mHealth Apps Industry Regional Market Share
Geographic Coverage of mHealth Apps Industry
mHealth Apps Industry REPORT HIGHLIGHTS
| Aspects | Details |
|---|---|
| Study Period | 2020-2034 |
| Base Year | 2025 |
| Estimated Year | 2026 |
| Forecast Period | 2026-2034 |
| Historical Period | 2020-2025 |
| Growth Rate | CAGR of 27.30% from 2020-2034 |
| Segmentation |
|
Table of Contents
- 1. Introduction
- 1.1. Research Scope
- 1.2. Market Segmentation
- 1.3. Research Objective
- 1.4. Definitions and Assumptions
- 2. Executive Summary
- 2.1. Market Snapshot
- 3. Market Dynamics
- 3.1. Market Drivers
- 3.2. Market Restrains
- 3.3. Market Trends
- 3.4. Market Opportunities
- 4. Market Factor Analysis
- 4.1. Porters Five Forces
- 4.1.1. Bargaining Power of Suppliers
- 4.1.2. Bargaining Power of Buyers
- 4.1.3. Threat of New Entrants
- 4.1.4. Threat of Substitutes
- 4.1.5. Competitive Rivalry
- 4.2. PESTEL analysis
- 4.3. BCG Analysis
- 4.3.1. Stars (High Growth, High Market Share)
- 4.3.2. Cash Cows (Low Growth, High Market Share)
- 4.3.3. Question Mark (High Growth, Low Market Share)
- 4.3.4. Dogs (Low Growth, Low Market Share)
- 4.4. Ansoff Matrix Analysis
- 4.5. Supply Chain Analysis
- 4.6. Regulatory Landscape
- 4.7. Current Market Potential and Opportunity Assessment (TAM–SAM–SOM Framework)
- 4.8. RAX Analyst Note
- 4.1. Porters Five Forces
- 5. Market Analysis, Insights and Forecast 2021-2033
- 5.1. Market Analysis, Insights and Forecast - by Service Type
- 5.1.1. Monitoring Services
- 5.1.1.1. Independent Aging Solutions
- 5.1.1.2. Chronic Disease Management
- 5.1.1.3. Post-acute Care Services
- 5.1.2. Diagnostic Services
- 5.1.2.1. Self Diagnosis
- 5.1.2.2. Telemedicine Solutions
- 5.1.2.3. Medical
- 5.1.3. Treatment Services
- 5.1.3.1. Remote Patient Monitoring Services
- 5.1.3.2. Teleconsultation
- 5.1.4. Wellness and Fitness Solutions
- 5.1.5. Other Se
- 5.1.1. Monitoring Services
- 5.2. Market Analysis, Insights and Forecast - by Device Type
- 5.2.1. Blood Glucose Monitors
- 5.2.2. Cardiac Monitors
- 5.2.3. Hemodynamic Monitors
- 5.2.4. Neurological Monitors
- 5.2.5. Respiratory Monitors
- 5.2.6. Body and Temperature Monitors
- 5.2.7. Remote Patient Monitoring Devices
- 5.2.8. Other Device Types
- 5.3. Market Analysis, Insights and Forecast - by Stake Holder
- 5.3.1. Mobile Operators
- 5.3.2. Healthcare Providers
- 5.3.3. Application/Content Players
- 5.3.4. Other Stake Holders
- 5.4. Market Analysis, Insights and Forecast - by Region
- 5.4.1. North America
- 5.4.2. South America
- 5.4.3. Europe
- 5.4.4. Middle East & Africa
- 5.4.5. Asia Pacific
- 5.1. Market Analysis, Insights and Forecast - by Service Type
- 6. Global mHealth Apps Industry Analysis, Insights and Forecast, 2021-2033
- 6.1. Market Analysis, Insights and Forecast - by Service Type
- 6.1.1. Monitoring Services
- 6.1.1.1. Independent Aging Solutions
- 6.1.1.2. Chronic Disease Management
- 6.1.1.3. Post-acute Care Services
- 6.1.2. Diagnostic Services
- 6.1.2.1. Self Diagnosis
- 6.1.2.2. Telemedicine Solutions
- 6.1.2.3. Medical
- 6.1.3. Treatment Services
- 6.1.3.1. Remote Patient Monitoring Services
- 6.1.3.2. Teleconsultation
- 6.1.4. Wellness and Fitness Solutions
- 6.1.5. Other Se
- 6.1.1. Monitoring Services
- 6.2. Market Analysis, Insights and Forecast - by Device Type
- 6.2.1. Blood Glucose Monitors
- 6.2.2. Cardiac Monitors
- 6.2.3. Hemodynamic Monitors
- 6.2.4. Neurological Monitors
- 6.2.5. Respiratory Monitors
- 6.2.6. Body and Temperature Monitors
- 6.2.7. Remote Patient Monitoring Devices
- 6.2.8. Other Device Types
- 6.3. Market Analysis, Insights and Forecast - by Stake Holder
- 6.3.1. Mobile Operators
- 6.3.2. Healthcare Providers
- 6.3.3. Application/Content Players
- 6.3.4. Other Stake Holders
- 6.1. Market Analysis, Insights and Forecast - by Service Type
- 7. North America mHealth Apps Industry Analysis, Insights and Forecast, 2020-2032
- 7.1. Market Analysis, Insights and Forecast - by Service Type
- 7.1.1. Monitoring Services
- 7.1.1.1. Independent Aging Solutions
- 7.1.1.2. Chronic Disease Management
- 7.1.1.3. Post-acute Care Services
- 7.1.2. Diagnostic Services
- 7.1.2.1. Self Diagnosis
- 7.1.2.2. Telemedicine Solutions
- 7.1.2.3. Medical
- 7.1.3. Treatment Services
- 7.1.3.1. Remote Patient Monitoring Services
- 7.1.3.2. Teleconsultation
- 7.1.4. Wellness and Fitness Solutions
- 7.1.5. Other Se
- 7.1.1. Monitoring Services
- 7.2. Market Analysis, Insights and Forecast - by Device Type
- 7.2.1. Blood Glucose Monitors
- 7.2.2. Cardiac Monitors
- 7.2.3. Hemodynamic Monitors
- 7.2.4. Neurological Monitors
- 7.2.5. Respiratory Monitors
- 7.2.6. Body and Temperature Monitors
- 7.2.7. Remote Patient Monitoring Devices
- 7.2.8. Other Device Types
- 7.3. Market Analysis, Insights and Forecast - by Stake Holder
- 7.3.1. Mobile Operators
- 7.3.2. Healthcare Providers
- 7.3.3. Application/Content Players
- 7.3.4. Other Stake Holders
- 7.1. Market Analysis, Insights and Forecast - by Service Type
- 8. South America mHealth Apps Industry Analysis, Insights and Forecast, 2020-2032
- 8.1. Market Analysis, Insights and Forecast - by Service Type
- 8.1.1. Monitoring Services
- 8.1.1.1. Independent Aging Solutions
- 8.1.1.2. Chronic Disease Management
- 8.1.1.3. Post-acute Care Services
- 8.1.2. Diagnostic Services
- 8.1.2.1. Self Diagnosis
- 8.1.2.2. Telemedicine Solutions
- 8.1.2.3. Medical
- 8.1.3. Treatment Services
- 8.1.3.1. Remote Patient Monitoring Services
- 8.1.3.2. Teleconsultation
- 8.1.4. Wellness and Fitness Solutions
- 8.1.5. Other Se
- 8.1.1. Monitoring Services
- 8.2. Market Analysis, Insights and Forecast - by Device Type
- 8.2.1. Blood Glucose Monitors
- 8.2.2. Cardiac Monitors
- 8.2.3. Hemodynamic Monitors
- 8.2.4. Neurological Monitors
- 8.2.5. Respiratory Monitors
- 8.2.6. Body and Temperature Monitors
- 8.2.7. Remote Patient Monitoring Devices
- 8.2.8. Other Device Types
- 8.3. Market Analysis, Insights and Forecast - by Stake Holder
- 8.3.1. Mobile Operators
- 8.3.2. Healthcare Providers
- 8.3.3. Application/Content Players
- 8.3.4. Other Stake Holders
- 8.1. Market Analysis, Insights and Forecast - by Service Type
- 9. Europe mHealth Apps Industry Analysis, Insights and Forecast, 2020-2032
- 9.1. Market Analysis, Insights and Forecast - by Service Type
- 9.1.1. Monitoring Services
- 9.1.1.1. Independent Aging Solutions
- 9.1.1.2. Chronic Disease Management
- 9.1.1.3. Post-acute Care Services
- 9.1.2. Diagnostic Services
- 9.1.2.1. Self Diagnosis
- 9.1.2.2. Telemedicine Solutions
- 9.1.2.3. Medical
- 9.1.3. Treatment Services
- 9.1.3.1. Remote Patient Monitoring Services
- 9.1.3.2. Teleconsultation
- 9.1.4. Wellness and Fitness Solutions
- 9.1.5. Other Se
- 9.1.1. Monitoring Services
- 9.2. Market Analysis, Insights and Forecast - by Device Type
- 9.2.1. Blood Glucose Monitors
- 9.2.2. Cardiac Monitors
- 9.2.3. Hemodynamic Monitors
- 9.2.4. Neurological Monitors
- 9.2.5. Respiratory Monitors
- 9.2.6. Body and Temperature Monitors
- 9.2.7. Remote Patient Monitoring Devices
- 9.2.8. Other Device Types
- 9.3. Market Analysis, Insights and Forecast - by Stake Holder
- 9.3.1. Mobile Operators
- 9.3.2. Healthcare Providers
- 9.3.3. Application/Content Players
- 9.3.4. Other Stake Holders
- 9.1. Market Analysis, Insights and Forecast - by Service Type
- 10. Middle East & Africa mHealth Apps Industry Analysis, Insights and Forecast, 2020-2032
- 10.1. Market Analysis, Insights and Forecast - by Service Type
- 10.1.1. Monitoring Services
- 10.1.1.1. Independent Aging Solutions
- 10.1.1.2. Chronic Disease Management
- 10.1.1.3. Post-acute Care Services
- 10.1.2. Diagnostic Services
- 10.1.2.1. Self Diagnosis
- 10.1.2.2. Telemedicine Solutions
- 10.1.2.3. Medical
- 10.1.3. Treatment Services
- 10.1.3.1. Remote Patient Monitoring Services
- 10.1.3.2. Teleconsultation
- 10.1.4. Wellness and Fitness Solutions
- 10.1.5. Other Se
- 10.1.1. Monitoring Services
- 10.2. Market Analysis, Insights and Forecast - by Device Type
- 10.2.1. Blood Glucose Monitors
- 10.2.2. Cardiac Monitors
- 10.2.3. Hemodynamic Monitors
- 10.2.4. Neurological Monitors
- 10.2.5. Respiratory Monitors
- 10.2.6. Body and Temperature Monitors
- 10.2.7. Remote Patient Monitoring Devices
- 10.2.8. Other Device Types
- 10.3. Market Analysis, Insights and Forecast - by Stake Holder
- 10.3.1. Mobile Operators
- 10.3.2. Healthcare Providers
- 10.3.3. Application/Content Players
- 10.3.4. Other Stake Holders
- 10.1. Market Analysis, Insights and Forecast - by Service Type
- 11. Asia Pacific mHealth Apps Industry Analysis, Insights and Forecast, 2020-2032
- 11.1. Market Analysis, Insights and Forecast - by Service Type
- 11.1.1. Monitoring Services
- 11.1.1.1. Independent Aging Solutions
- 11.1.1.2. Chronic Disease Management
- 11.1.1.3. Post-acute Care Services
- 11.1.2. Diagnostic Services
- 11.1.2.1. Self Diagnosis
- 11.1.2.2. Telemedicine Solutions
- 11.1.2.3. Medical
- 11.1.3. Treatment Services
- 11.1.3.1. Remote Patient Monitoring Services
- 11.1.3.2. Teleconsultation
- 11.1.4. Wellness and Fitness Solutions
- 11.1.5. Other Se
- 11.1.1. Monitoring Services
- 11.2. Market Analysis, Insights and Forecast - by Device Type
- 11.2.1. Blood Glucose Monitors
- 11.2.2. Cardiac Monitors
- 11.2.3. Hemodynamic Monitors
- 11.2.4. Neurological Monitors
- 11.2.5. Respiratory Monitors
- 11.2.6. Body and Temperature Monitors
- 11.2.7. Remote Patient Monitoring Devices
- 11.2.8. Other Device Types
- 11.3. Market Analysis, Insights and Forecast - by Stake Holder
- 11.3.1. Mobile Operators
- 11.3.2. Healthcare Providers
- 11.3.3. Application/Content Players
- 11.3.4. Other Stake Holders
- 11.1. Market Analysis, Insights and Forecast - by Service Type
- 12. Competitive Analysis
- 12.1. Company Profiles
- 12.1.1 Bayer AG
- 12.1.1.1. Company Overview
- 12.1.1.2. Products
- 12.1.1.3. Company Financials
- 12.1.1.4. SWOT Analysis
- 12.1.2 InTouch Health
- 12.1.2.1. Company Overview
- 12.1.2.2. Products
- 12.1.2.3. Company Financials
- 12.1.2.4. SWOT Analysis
- 12.1.3 Cisco Systems Inc
- 12.1.3.1. Company Overview
- 12.1.3.2. Products
- 12.1.3.3. Company Financials
- 12.1.3.4. SWOT Analysis
- 12.1.4 Omron Corporation*List Not Exhaustive
- 12.1.4.1. Company Overview
- 12.1.4.2. Products
- 12.1.4.3. Company Financials
- 12.1.4.4. SWOT Analysis
- 12.1.5 Medtronic PLC
- 12.1.5.1. Company Overview
- 12.1.5.2. Products
- 12.1.5.3. Company Financials
- 12.1.5.4. SWOT Analysis
- 12.1.6 Cerner Corporation
- 12.1.6.1. Company Overview
- 12.1.6.2. Products
- 12.1.6.3. Company Financials
- 12.1.6.4. SWOT Analysis
- 12.1.7 Koninklijke Philips NV
- 12.1.7.1. Company Overview
- 12.1.7.2. Products
- 12.1.7.3. Company Financials
- 12.1.7.4. SWOT Analysis
- 12.1.8 Johnson & Johnson
- 12.1.8.1. Company Overview
- 12.1.8.2. Products
- 12.1.8.3. Company Financials
- 12.1.8.4. SWOT Analysis
- 12.1.9 AT&T Inc
- 12.1.9.1. Company Overview
- 12.1.9.2. Products
- 12.1.9.3. Company Financials
- 12.1.9.4. SWOT Analysis
- 12.1.10 Athenahealth Inc
- 12.1.10.1. Company Overview
- 12.1.10.2. Products
- 12.1.10.3. Company Financials
- 12.1.10.4. SWOT Analysis
- 12.1.1 Bayer AG
- 12.2. Market Entropy
- 12.2.1 Company's Key Areas Served
- 12.2.2 Recent Developments
- 12.3. Company Market Share Analysis 2025
- 12.3.1 Top 5 Companies Market Share Analysis
- 12.3.2 Top 3 Companies Market Share Analysis
- 12.4. List of Potential Customers
- 13. Research Methodology
List of Figures
- Figure 1: Global mHealth Apps Industry Revenue Breakdown (Million, %) by Region 2025 & 2033
- Figure 2: North America mHealth Apps Industry Revenue (Million), by Service Type 2025 & 2033
- Figure 3: North America mHealth Apps Industry Revenue Share (%), by Service Type 2025 & 2033
- Figure 4: North America mHealth Apps Industry Revenue (Million), by Device Type 2025 & 2033
- Figure 5: North America mHealth Apps Industry Revenue Share (%), by Device Type 2025 & 2033
- Figure 6: North America mHealth Apps Industry Revenue (Million), by Stake Holder 2025 & 2033
- Figure 7: North America mHealth Apps Industry Revenue Share (%), by Stake Holder 2025 & 2033
- Figure 8: North America mHealth Apps Industry Revenue (Million), by Country 2025 & 2033
- Figure 9: North America mHealth Apps Industry Revenue Share (%), by Country 2025 & 2033
- Figure 10: South America mHealth Apps Industry Revenue (Million), by Service Type 2025 & 2033
- Figure 11: South America mHealth Apps Industry Revenue Share (%), by Service Type 2025 & 2033
- Figure 12: South America mHealth Apps Industry Revenue (Million), by Device Type 2025 & 2033
- Figure 13: South America mHealth Apps Industry Revenue Share (%), by Device Type 2025 & 2033
- Figure 14: South America mHealth Apps Industry Revenue (Million), by Stake Holder 2025 & 2033
- Figure 15: South America mHealth Apps Industry Revenue Share (%), by Stake Holder 2025 & 2033
- Figure 16: South America mHealth Apps Industry Revenue (Million), by Country 2025 & 2033
- Figure 17: South America mHealth Apps Industry Revenue Share (%), by Country 2025 & 2033
- Figure 18: Europe mHealth Apps Industry Revenue (Million), by Service Type 2025 & 2033
- Figure 19: Europe mHealth Apps Industry Revenue Share (%), by Service Type 2025 & 2033
- Figure 20: Europe mHealth Apps Industry Revenue (Million), by Device Type 2025 & 2033
- Figure 21: Europe mHealth Apps Industry Revenue Share (%), by Device Type 2025 & 2033
- Figure 22: Europe mHealth Apps Industry Revenue (Million), by Stake Holder 2025 & 2033
- Figure 23: Europe mHealth Apps Industry Revenue Share (%), by Stake Holder 2025 & 2033
- Figure 24: Europe mHealth Apps Industry Revenue (Million), by Country 2025 & 2033
- Figure 25: Europe mHealth Apps Industry Revenue Share (%), by Country 2025 & 2033
- Figure 26: Middle East & Africa mHealth Apps Industry Revenue (Million), by Service Type 2025 & 2033
- Figure 27: Middle East & Africa mHealth Apps Industry Revenue Share (%), by Service Type 2025 & 2033
- Figure 28: Middle East & Africa mHealth Apps Industry Revenue (Million), by Device Type 2025 & 2033
- Figure 29: Middle East & Africa mHealth Apps Industry Revenue Share (%), by Device Type 2025 & 2033
- Figure 30: Middle East & Africa mHealth Apps Industry Revenue (Million), by Stake Holder 2025 & 2033
- Figure 31: Middle East & Africa mHealth Apps Industry Revenue Share (%), by Stake Holder 2025 & 2033
- Figure 32: Middle East & Africa mHealth Apps Industry Revenue (Million), by Country 2025 & 2033
- Figure 33: Middle East & Africa mHealth Apps Industry Revenue Share (%), by Country 2025 & 2033
- Figure 34: Asia Pacific mHealth Apps Industry Revenue (Million), by Service Type 2025 & 2033
- Figure 35: Asia Pacific mHealth Apps Industry Revenue Share (%), by Service Type 2025 & 2033
- Figure 36: Asia Pacific mHealth Apps Industry Revenue (Million), by Device Type 2025 & 2033
- Figure 37: Asia Pacific mHealth Apps Industry Revenue Share (%), by Device Type 2025 & 2033
- Figure 38: Asia Pacific mHealth Apps Industry Revenue (Million), by Stake Holder 2025 & 2033
- Figure 39: Asia Pacific mHealth Apps Industry Revenue Share (%), by Stake Holder 2025 & 2033
- Figure 40: Asia Pacific mHealth Apps Industry Revenue (Million), by Country 2025 & 2033
- Figure 41: Asia Pacific mHealth Apps Industry Revenue Share (%), by Country 2025 & 2033
List of Tables
- Table 1: Global mHealth Apps Industry Revenue Million Forecast, by Service Type 2020 & 2033
- Table 2: Global mHealth Apps Industry Revenue Million Forecast, by Device Type 2020 & 2033
- Table 3: Global mHealth Apps Industry Revenue Million Forecast, by Stake Holder 2020 & 2033
- Table 4: Global mHealth Apps Industry Revenue Million Forecast, by Region 2020 & 2033
- Table 5: Global mHealth Apps Industry Revenue Million Forecast, by Service Type 2020 & 2033
- Table 6: Global mHealth Apps Industry Revenue Million Forecast, by Device Type 2020 & 2033
- Table 7: Global mHealth Apps Industry Revenue Million Forecast, by Stake Holder 2020 & 2033
- Table 8: Global mHealth Apps Industry Revenue Million Forecast, by Country 2020 & 2033
- Table 9: United States mHealth Apps Industry Revenue (Million) Forecast, by Application 2020 & 2033
- Table 10: Canada mHealth Apps Industry Revenue (Million) Forecast, by Application 2020 & 2033
- Table 11: Mexico mHealth Apps Industry Revenue (Million) Forecast, by Application 2020 & 2033
- Table 12: Global mHealth Apps Industry Revenue Million Forecast, by Service Type 2020 & 2033
- Table 13: Global mHealth Apps Industry Revenue Million Forecast, by Device Type 2020 & 2033
- Table 14: Global mHealth Apps Industry Revenue Million Forecast, by Stake Holder 2020 & 2033
- Table 15: Global mHealth Apps Industry Revenue Million Forecast, by Country 2020 & 2033
- Table 16: Brazil mHealth Apps Industry Revenue (Million) Forecast, by Application 2020 & 2033
- Table 17: Argentina mHealth Apps Industry Revenue (Million) Forecast, by Application 2020 & 2033
- Table 18: Rest of South America mHealth Apps Industry Revenue (Million) Forecast, by Application 2020 & 2033
- Table 19: Global mHealth Apps Industry Revenue Million Forecast, by Service Type 2020 & 2033
- Table 20: Global mHealth Apps Industry Revenue Million Forecast, by Device Type 2020 & 2033
- Table 21: Global mHealth Apps Industry Revenue Million Forecast, by Stake Holder 2020 & 2033
- Table 22: Global mHealth Apps Industry Revenue Million Forecast, by Country 2020 & 2033
- Table 23: United Kingdom mHealth Apps Industry Revenue (Million) Forecast, by Application 2020 & 2033
- Table 24: Germany mHealth Apps Industry Revenue (Million) Forecast, by Application 2020 & 2033
- Table 25: France mHealth Apps Industry Revenue (Million) Forecast, by Application 2020 & 2033
- Table 26: Italy mHealth Apps Industry Revenue (Million) Forecast, by Application 2020 & 2033
- Table 27: Spain mHealth Apps Industry Revenue (Million) Forecast, by Application 2020 & 2033
- Table 28: Russia mHealth Apps Industry Revenue (Million) Forecast, by Application 2020 & 2033
- Table 29: Benelux mHealth Apps Industry Revenue (Million) Forecast, by Application 2020 & 2033
- Table 30: Nordics mHealth Apps Industry Revenue (Million) Forecast, by Application 2020 & 2033
- Table 31: Rest of Europe mHealth Apps Industry Revenue (Million) Forecast, by Application 2020 & 2033
- Table 32: Global mHealth Apps Industry Revenue Million Forecast, by Service Type 2020 & 2033
- Table 33: Global mHealth Apps Industry Revenue Million Forecast, by Device Type 2020 & 2033
- Table 34: Global mHealth Apps Industry Revenue Million Forecast, by Stake Holder 2020 & 2033
- Table 35: Global mHealth Apps Industry Revenue Million Forecast, by Country 2020 & 2033
- Table 36: Turkey mHealth Apps Industry Revenue (Million) Forecast, by Application 2020 & 2033
- Table 37: Israel mHealth Apps Industry Revenue (Million) Forecast, by Application 2020 & 2033
- Table 38: GCC mHealth Apps Industry Revenue (Million) Forecast, by Application 2020 & 2033
- Table 39: North Africa mHealth Apps Industry Revenue (Million) Forecast, by Application 2020 & 2033
- Table 40: South Africa mHealth Apps Industry Revenue (Million) Forecast, by Application 2020 & 2033
- Table 41: Rest of Middle East & Africa mHealth Apps Industry Revenue (Million) Forecast, by Application 2020 & 2033
- Table 42: Global mHealth Apps Industry Revenue Million Forecast, by Service Type 2020 & 2033
- Table 43: Global mHealth Apps Industry Revenue Million Forecast, by Device Type 2020 & 2033
- Table 44: Global mHealth Apps Industry Revenue Million Forecast, by Stake Holder 2020 & 2033
- Table 45: Global mHealth Apps Industry Revenue Million Forecast, by Country 2020 & 2033
- Table 46: China mHealth Apps Industry Revenue (Million) Forecast, by Application 2020 & 2033
- Table 47: India mHealth Apps Industry Revenue (Million) Forecast, by Application 2020 & 2033
- Table 48: Japan mHealth Apps Industry Revenue (Million) Forecast, by Application 2020 & 2033
- Table 49: South Korea mHealth Apps Industry Revenue (Million) Forecast, by Application 2020 & 2033
- Table 50: ASEAN mHealth Apps Industry Revenue (Million) Forecast, by Application 2020 & 2033
- Table 51: Oceania mHealth Apps Industry Revenue (Million) Forecast, by Application 2020 & 2033
- Table 52: Rest of Asia Pacific mHealth Apps Industry Revenue (Million) Forecast, by Application 2020 & 2033
Frequently Asked Questions
1. What is the projected Compound Annual Growth Rate (CAGR) of the mHealth Apps Industry?
The projected CAGR is approximately 27.30%.
2. Which companies are prominent players in the mHealth Apps Industry?
Key companies in the market include Bayer AG, InTouch Health, Cisco Systems Inc, Omron Corporation*List Not Exhaustive, Medtronic PLC, Cerner Corporation, Koninklijke Philips NV, Johnson & Johnson, AT&T Inc, Athenahealth Inc.
3. What are the main segments of the mHealth Apps Industry?
The market segments include Service Type, Device Type, Stake Holder.
4. Can you provide details about the market size?
The market size is estimated to be USD 50.9 Million as of 2022.
5. What are some drivers contributing to market growth?
; Growing usage of Smartphones. Tablets. and Mobile Technology in Healthcare; Increasing Awareness of People for Chronic Diseases; Increasing Focus on Personalized Medicine and Patient-centered Approach; Increased Usage of Mobile Health App.
6. What are the notable trends driving market growth?
Remote Patient Monitoring Devices is the Leading Segment Under Devices Type that is Expected to Grow During the Forecast Period.
7. Are there any restraints impacting market growth?
; Data Insecurity; Provider Liability Concerns; Lower Adoption in Rural Areas.
8. Can you provide examples of recent developments in the market?
N/A
9. What pricing options are available for accessing the report?
Pricing options include single-user, multi-user, and enterprise licenses priced at USD 3800, USD 4500, and USD 5800 respectively.
10. Is the market size provided in terms of value or volume?
The market size is provided in terms of value, measured in Million.
11. Are there any specific market keywords associated with the report?
Yes, the market keyword associated with the report is "mHealth Apps Industry," which aids in identifying and referencing the specific market segment covered.
12. How do I determine which pricing option suits my needs best?
The pricing options vary based on user requirements and access needs. Individual users may opt for single-user licenses, while businesses requiring broader access may choose multi-user or enterprise licenses for cost-effective access to the report.
13. Are there any additional resources or data provided in the mHealth Apps Industry report?
While the report offers comprehensive insights, it's advisable to review the specific contents or supplementary materials provided to ascertain if additional resources or data are available.
14. How can I stay updated on further developments or reports in the mHealth Apps Industry?
To stay informed about further developments, trends, and reports in the mHealth Apps Industry, consider subscribing to industry newsletters, following relevant companies and organizations, or regularly checking reputable industry news sources and publications.
Methodology
Step 1 - Identification of Relevant Samples Size from Population Database


Step 2 - Approaches for Defining Global Market Size (Value, Volume* & Price*)

Note*: In applicable scenarios
Step 3 - Data Sources
Primary Research
- Web Analytics
- Survey Reports
- Research Institute
- Latest Research Reports
- Opinion Leaders
Secondary Research
- Annual Reports
- White Paper
- Latest Press Release
- Industry Association
- Paid Database
- Investor Presentations

Step 4 - Data Triangulation
Involves using different sources of information in order to increase the validity of a study
These sources are likely to be stakeholders in a program - participants, other researchers, program staff, other community members, and so on.
Then we put all data in single framework & apply various statistical tools to find out the dynamic on the market.
During the analysis stage, feedback from the stakeholder groups would be compared to determine areas of agreement as well as areas of divergence