
Key Insights
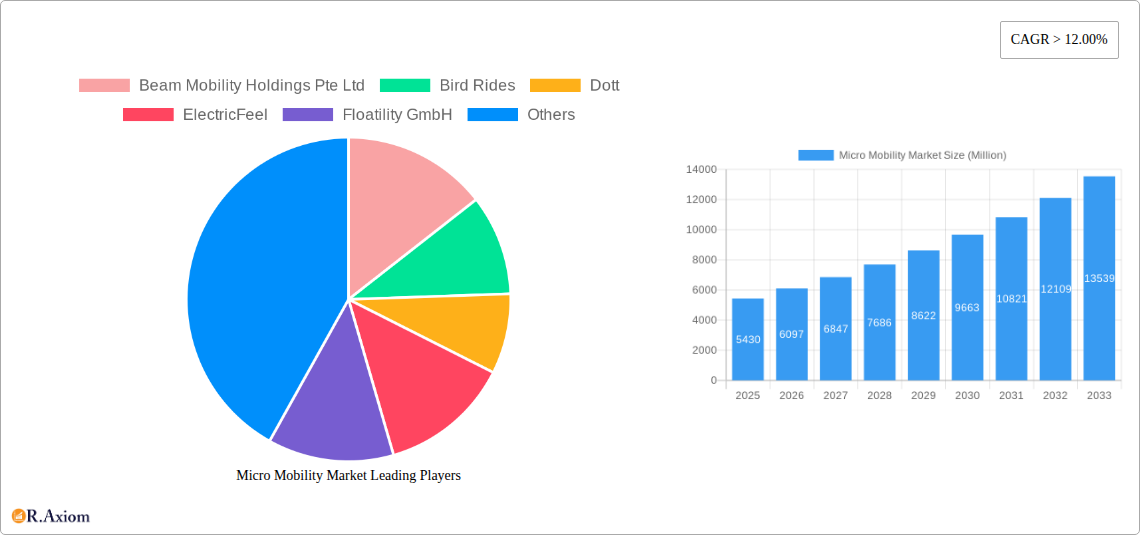
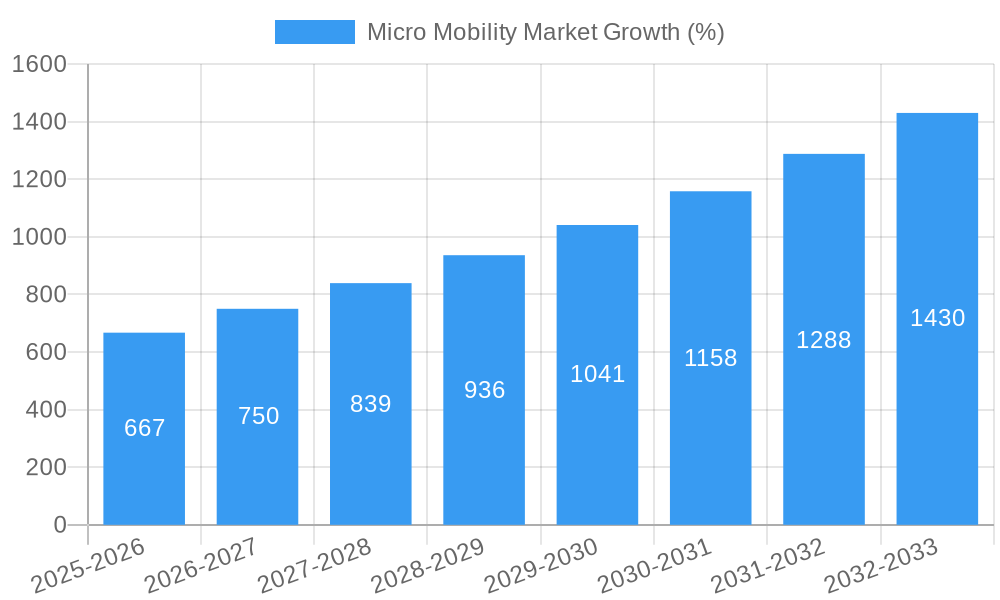
The micro-mobility market, encompassing shared e-scooters, e-bikes, and other lightweight personal electric vehicles, is experiencing robust growth, projected to reach a market size of $5.43 billion in 2025 and maintain a Compound Annual Growth Rate (CAGR) exceeding 12% through 2033. This expansion is fueled by several key factors. Increasing urbanization and traffic congestion in major cities globally are driving demand for efficient, sustainable, and convenient last-mile transportation solutions. Furthermore, growing environmental concerns and government initiatives promoting sustainable transportation are creating a favorable regulatory landscape. Technological advancements, such as improved battery technology, enhanced safety features, and innovative smart-mobility solutions, are further accelerating market growth. The market is segmented by vehicle type (e-scooters, e-bikes, etc.), service model (shared, owned), and region, with significant variations in market penetration and growth rates across different geographical areas. Competition is intense, with established players like Lime and Bird Rides competing alongside emerging innovative companies like Superpedestrian and Yulu Bikes.
The market's future trajectory is influenced by several factors. Continued investment in infrastructure development, such as dedicated bike lanes and charging stations, is crucial for wider adoption. Addressing safety concerns related to accidents and rider behavior through improved regulations and technological solutions is also paramount. The evolving landscape of urban planning and integration with public transport systems will play a key role in shaping the market's long-term growth. Finally, the increasing affordability of micro-mobility vehicles and the expanding availability of subscription-based models are expected to contribute significantly to market expansion in the coming years. The overall outlook for the micro-mobility market remains extremely positive, driven by strong underlying trends and a growing focus on sustainable urban mobility.
Micro Mobility Market: A Comprehensive Report (2019-2033)
This comprehensive report provides a detailed analysis of the global Micro Mobility Market, offering invaluable insights for industry stakeholders, investors, and strategists. The study covers the period 2019-2033, with 2025 serving as the base and estimated year. The report utilizes a robust methodology, incorporating historical data (2019-2024), current market estimations (2025), and future projections (2025-2033) to deliver a holistic understanding of market dynamics. Expect to find in-depth analysis on market concentration, key players, emerging trends, and future growth opportunities within the micro-mobility sector.
Micro Mobility Market Market Concentration & Innovation
The micro-mobility market exhibits a moderately concentrated landscape, with a few major players commanding significant market share. While precise market share figures for each company are unavailable at this time (xx%), the competitive intensity is high, driven by continuous innovation and aggressive expansion strategies. The market is characterized by frequent mergers and acquisitions (M&A) activity, as evidenced by recent deals like Bird's acquisition of Spin for USD 19 Million. These M&A activities significantly impact market consolidation and reshape competitive dynamics.
Key Factors Influencing Market Concentration & Innovation:
- Technological Advancements: Continuous innovation in battery technology, vehicle design, and smart features fuels market competition and drives product differentiation.
- Regulatory Frameworks: Varying regulatory landscapes across different regions significantly impact market access and operational costs, creating both opportunities and challenges.
- Product Substitutes: Competition arises from alternative transportation modes such as public transport, bicycles, and ride-hailing services.
- End-User Trends: Shifting consumer preferences towards sustainable and convenient transportation options, particularly in urban areas, are major growth drivers.
- Recent M&A Activity: The USD 19 Million acquisition of Spin by Bird demonstrates the ongoing consolidation within the micro-mobility sector. Further analysis suggests an average M&A deal value in the range of USD xx Million.
Micro Mobility Market Industry Trends & Insights
The micro-mobility market is experiencing robust growth, fueled by several key factors. The Compound Annual Growth Rate (CAGR) during the forecast period (2025-2033) is projected to be xx%, driven by increasing urbanization, growing environmental concerns, and the rising popularity of shared mobility services. Market penetration is expected to reach xx% by 2033, as more cities integrate micro-mobility solutions into their urban transport strategies. Technological disruptions such as the introduction of advanced battery technologies, improved vehicle safety features, and the integration of smart features are further enhancing market growth and consumer adoption. Consumer preferences are shifting towards more sustainable, convenient, and affordable transportation options, further propelling market expansion. Competitive dynamics are characterized by intense rivalry among established players and the emergence of new entrants, constantly challenging the status quo and driving innovation.
Dominant Markets & Segments in Micro Mobility Market
While precise regional dominance is yet to be determined (xx%), initial data suggests a strong concentration in major urban centers across North America and Europe. The key drivers vary across regions but some general tendencies are observed.
Key Drivers of Market Dominance:
- Economic Policies: Government incentives and subsidies for sustainable transportation significantly boost market adoption.
- Infrastructure: The development of dedicated cycling and scooter lanes improves the safety and convenience of micro-mobility services.
- Urban Density: High population density in urban areas creates a large target market for micro-mobility solutions.
The market can be segmented into various categories, including but not limited to: e-scooters, e-bikes, e-skateboards. Further segmentation within each category (e.g., by rental model, battery type) is also present. A detailed breakdown of segment-specific performance and growth forecasts is available in the complete report.
Micro Mobility Market Product Developments
Recent product innovations focus on enhancing safety, extending battery life, and improving user experience. New models incorporate features like improved braking systems, enhanced lighting, and integrated GPS tracking. These advancements address consumer concerns related to safety and reliability, expanding the market appeal. The focus on user-friendly mobile applications and convenient rental schemes contributes to seamless adoption and improved user experience. The evolving technological trends aim to create more sustainable, durable, and cost-effective micro-mobility solutions tailored to the specific needs of different urban environments.
Report Scope & Segmentation Analysis
This report encompasses a comprehensive analysis of the global micro-mobility market, segmenting it by vehicle type (e-scooters, e-bikes, e-skateboards, etc.), rental model (shared, private), battery technology, and region. Growth projections for each segment are provided, incorporating estimations of market size and competitive landscapes. Specific market sizes and growth rates for each segment are detailed within the full report.
Key Drivers of Micro Mobility Market Growth
Several factors contribute to the micro-mobility market's growth. These include the increasing urbanization and its associated traffic congestion, growing environmental awareness leading to the adoption of sustainable transportation options, and supportive government policies promoting green initiatives and alternative transportation modes. Technological advancements in battery life, safety features, and connectivity further enhance market appeal.
Challenges in the Micro Mobility Market Sector
The micro-mobility sector faces challenges including stringent regulations regarding safety standards and operational permits, varying across different jurisdictions. Supply chain disruptions impacting the availability of components and manufacturing capacity can also hinder market growth. Furthermore, intense competition among numerous players requires effective strategies to maintain profitability.
Emerging Opportunities in Micro Mobility Market
The market presents exciting opportunities in emerging economies experiencing rapid urbanization and growth in shared mobility services. Advancements in battery technology and autonomous features will create new market segments and opportunities for innovation. The integration of micro-mobility solutions into broader urban transportation systems holds significant potential for expansion and sustainability.
Leading Players in the Micro Mobility Market Market
- Beam Mobility Holdings Pte Ltd
- Bird Rides
- Dott
- ElectricFeel
- Floatility GmbH
- Lime
- Yulu Bikes Pvt Ltd
- Voi
- Superpedestrian Inc
Key Developments in Micro Mobility Market Industry
- March 2023: Voi Technology secured an additional USD 22.8 Million in funding to expand its e-scooter services across Europe, boosting its fleet and offerings.
- September 2023: Bird acquired Spin from Tier Mobility for USD 19 Million, strengthening its operational capabilities and market reach.
Strategic Outlook for Micro Mobility Market Market
The micro-mobility market is poised for continued growth, driven by technological advancements, supportive government policies, and evolving consumer preferences. Future opportunities lie in the expansion into new markets, the development of innovative vehicle designs, and the integration of micro-mobility services into wider urban transportation networks. The market's future is bright, with significant potential for further expansion and innovation in the coming years.
Micro Mobility Market Segmentation
-
1. Vehicle Type
- 1.1. Electric Kick Scooters
- 1.2. Electric Mopeds
- 1.3. Electric Bicycles
-
2. Battery
- 2.1. Sealed Lead Acid
- 2.2. NiMH
- 2.3. Li-ion
-
3. Voltage
- 3.1. Below 24V
- 3.2. 36V
- 3.3. 48V
- 3.4. Greater than 48V
-
4. Sharing Type
- 4.1. Docked
- 4.2. Dockless
Micro Mobility Market Segmentation By Geography
-
1. North America
- 1.1. United States
- 1.2. Canada
- 1.3. Rest of North America
-
2. Europe
- 2.1. Germany
- 2.2. United Kingdom
- 2.3. France
- 2.4. Italy
- 2.5. Spain
- 2.6. Rest of Europe
-
3. Asia Pacific
- 3.1. China
- 3.2. Japan
- 3.3. India
- 3.4. South Korea
- 3.5. Rest of Asia Pacific
-
4. Rest of the World
- 4.1. South America
- 4.2. Middle East and Africa

Micro Mobility Market REPORT HIGHLIGHTS
| Aspects | Details |
|---|---|
| Study Period | 2019-2033 |
| Base Year | 2024 |
| Estimated Year | 2025 |
| Forecast Period | 2025-2033 |
| Historical Period | 2019-2024 |
| Growth Rate | CAGR of > 12.00% from 2019-2033 |
| Segmentation |
|
Table of Contents
- 1. Introduction
- 1.1. Research Scope
- 1.2. Market Segmentation
- 1.3. Research Methodology
- 1.4. Definitions and Assumptions
- 2. Executive Summary
- 2.1. Introduction
- 3. Market Dynamics
- 3.1. Introduction
- 3.2. Market Drivers
- 3.2.1. Increasing Urban Congestion and a Shift Toward Sustainable Transportation Solutions to Drive Market Growth
- 3.3. Market Restrains
- 3.3.1. Increasing Urban Congestion and a Shift Toward Sustainable Transportation Solutions to Drive Market Growth
- 3.4. Market Trends
- 3.4.1. Docked Micromobility Paving the Way for Sustainable Urban Transportation
- 4. Market Factor Analysis
- 4.1. Porters Five Forces
- 4.2. Supply/Value Chain
- 4.3. PESTEL analysis
- 4.4. Market Entropy
- 4.5. Patent/Trademark Analysis
- 5. Global Micro Mobility Market Analysis, Insights and Forecast, 2019-2031
- 5.1. Market Analysis, Insights and Forecast - by Vehicle Type
- 5.1.1. Electric Kick Scooters
- 5.1.2. Electric Mopeds
- 5.1.3. Electric Bicycles
- 5.2. Market Analysis, Insights and Forecast - by Battery
- 5.2.1. Sealed Lead Acid
- 5.2.2. NiMH
- 5.2.3. Li-ion
- 5.3. Market Analysis, Insights and Forecast - by Voltage
- 5.3.1. Below 24V
- 5.3.2. 36V
- 5.3.3. 48V
- 5.3.4. Greater than 48V
- 5.4. Market Analysis, Insights and Forecast - by Sharing Type
- 5.4.1. Docked
- 5.4.2. Dockless
- 5.5. Market Analysis, Insights and Forecast - by Region
- 5.5.1. North America
- 5.5.2. Europe
- 5.5.3. Asia Pacific
- 5.5.4. Rest of the World
- 5.1. Market Analysis, Insights and Forecast - by Vehicle Type
- 6. North America Micro Mobility Market Analysis, Insights and Forecast, 2019-2031
- 6.1. Market Analysis, Insights and Forecast - by Vehicle Type
- 6.1.1. Electric Kick Scooters
- 6.1.2. Electric Mopeds
- 6.1.3. Electric Bicycles
- 6.2. Market Analysis, Insights and Forecast - by Battery
- 6.2.1. Sealed Lead Acid
- 6.2.2. NiMH
- 6.2.3. Li-ion
- 6.3. Market Analysis, Insights and Forecast - by Voltage
- 6.3.1. Below 24V
- 6.3.2. 36V
- 6.3.3. 48V
- 6.3.4. Greater than 48V
- 6.4. Market Analysis, Insights and Forecast - by Sharing Type
- 6.4.1. Docked
- 6.4.2. Dockless
- 6.1. Market Analysis, Insights and Forecast - by Vehicle Type
- 7. Europe Micro Mobility Market Analysis, Insights and Forecast, 2019-2031
- 7.1. Market Analysis, Insights and Forecast - by Vehicle Type
- 7.1.1. Electric Kick Scooters
- 7.1.2. Electric Mopeds
- 7.1.3. Electric Bicycles
- 7.2. Market Analysis, Insights and Forecast - by Battery
- 7.2.1. Sealed Lead Acid
- 7.2.2. NiMH
- 7.2.3. Li-ion
- 7.3. Market Analysis, Insights and Forecast - by Voltage
- 7.3.1. Below 24V
- 7.3.2. 36V
- 7.3.3. 48V
- 7.3.4. Greater than 48V
- 7.4. Market Analysis, Insights and Forecast - by Sharing Type
- 7.4.1. Docked
- 7.4.2. Dockless
- 7.1. Market Analysis, Insights and Forecast - by Vehicle Type
- 8. Asia Pacific Micro Mobility Market Analysis, Insights and Forecast, 2019-2031
- 8.1. Market Analysis, Insights and Forecast - by Vehicle Type
- 8.1.1. Electric Kick Scooters
- 8.1.2. Electric Mopeds
- 8.1.3. Electric Bicycles
- 8.2. Market Analysis, Insights and Forecast - by Battery
- 8.2.1. Sealed Lead Acid
- 8.2.2. NiMH
- 8.2.3. Li-ion
- 8.3. Market Analysis, Insights and Forecast - by Voltage
- 8.3.1. Below 24V
- 8.3.2. 36V
- 8.3.3. 48V
- 8.3.4. Greater than 48V
- 8.4. Market Analysis, Insights and Forecast - by Sharing Type
- 8.4.1. Docked
- 8.4.2. Dockless
- 8.1. Market Analysis, Insights and Forecast - by Vehicle Type
- 9. Rest of the World Micro Mobility Market Analysis, Insights and Forecast, 2019-2031
- 9.1. Market Analysis, Insights and Forecast - by Vehicle Type
- 9.1.1. Electric Kick Scooters
- 9.1.2. Electric Mopeds
- 9.1.3. Electric Bicycles
- 9.2. Market Analysis, Insights and Forecast - by Battery
- 9.2.1. Sealed Lead Acid
- 9.2.2. NiMH
- 9.2.3. Li-ion
- 9.3. Market Analysis, Insights and Forecast - by Voltage
- 9.3.1. Below 24V
- 9.3.2. 36V
- 9.3.3. 48V
- 9.3.4. Greater than 48V
- 9.4. Market Analysis, Insights and Forecast - by Sharing Type
- 9.4.1. Docked
- 9.4.2. Dockless
- 9.1. Market Analysis, Insights and Forecast - by Vehicle Type
- 10. Competitive Analysis
- 10.1. Global Market Share Analysis 2024
- 10.2. Company Profiles
- 10.2.1 Beam Mobility Holdings Pte Ltd
- 10.2.1.1. Overview
- 10.2.1.2. Products
- 10.2.1.3. SWOT Analysis
- 10.2.1.4. Recent Developments
- 10.2.1.5. Financials (Based on Availability)
- 10.2.2 Bird Rides
- 10.2.2.1. Overview
- 10.2.2.2. Products
- 10.2.2.3. SWOT Analysis
- 10.2.2.4. Recent Developments
- 10.2.2.5. Financials (Based on Availability)
- 10.2.3 Dott
- 10.2.3.1. Overview
- 10.2.3.2. Products
- 10.2.3.3. SWOT Analysis
- 10.2.3.4. Recent Developments
- 10.2.3.5. Financials (Based on Availability)
- 10.2.4 ElectricFeel
- 10.2.4.1. Overview
- 10.2.4.2. Products
- 10.2.4.3. SWOT Analysis
- 10.2.4.4. Recent Developments
- 10.2.4.5. Financials (Based on Availability)
- 10.2.5 Floatility GmbH
- 10.2.5.1. Overview
- 10.2.5.2. Products
- 10.2.5.3. SWOT Analysis
- 10.2.5.4. Recent Developments
- 10.2.5.5. Financials (Based on Availability)
- 10.2.6 Lime
- 10.2.6.1. Overview
- 10.2.6.2. Products
- 10.2.6.3. SWOT Analysis
- 10.2.6.4. Recent Developments
- 10.2.6.5. Financials (Based on Availability)
- 10.2.7 Yulu Bikes Pvt Ltd
- 10.2.7.1. Overview
- 10.2.7.2. Products
- 10.2.7.3. SWOT Analysis
- 10.2.7.4. Recent Developments
- 10.2.7.5. Financials (Based on Availability)
- 10.2.8 Voi
- 10.2.8.1. Overview
- 10.2.8.2. Products
- 10.2.8.3. SWOT Analysis
- 10.2.8.4. Recent Developments
- 10.2.8.5. Financials (Based on Availability)
- 10.2.9 Superpedestrian Inc
- 10.2.9.1. Overview
- 10.2.9.2. Products
- 10.2.9.3. SWOT Analysis
- 10.2.9.4. Recent Developments
- 10.2.9.5. Financials (Based on Availability)
- 10.2.1 Beam Mobility Holdings Pte Ltd
List of Figures
- Figure 1: Global Micro Mobility Market Revenue Breakdown (Million, %) by Region 2024 & 2032
- Figure 2: Global Micro Mobility Market Volume Breakdown (Billion, %) by Region 2024 & 2032
- Figure 3: North America Micro Mobility Market Revenue (Million), by Vehicle Type 2024 & 2032
- Figure 4: North America Micro Mobility Market Volume (Billion), by Vehicle Type 2024 & 2032
- Figure 5: North America Micro Mobility Market Revenue Share (%), by Vehicle Type 2024 & 2032
- Figure 6: North America Micro Mobility Market Volume Share (%), by Vehicle Type 2024 & 2032
- Figure 7: North America Micro Mobility Market Revenue (Million), by Battery 2024 & 2032
- Figure 8: North America Micro Mobility Market Volume (Billion), by Battery 2024 & 2032
- Figure 9: North America Micro Mobility Market Revenue Share (%), by Battery 2024 & 2032
- Figure 10: North America Micro Mobility Market Volume Share (%), by Battery 2024 & 2032
- Figure 11: North America Micro Mobility Market Revenue (Million), by Voltage 2024 & 2032
- Figure 12: North America Micro Mobility Market Volume (Billion), by Voltage 2024 & 2032
- Figure 13: North America Micro Mobility Market Revenue Share (%), by Voltage 2024 & 2032
- Figure 14: North America Micro Mobility Market Volume Share (%), by Voltage 2024 & 2032
- Figure 15: North America Micro Mobility Market Revenue (Million), by Sharing Type 2024 & 2032
- Figure 16: North America Micro Mobility Market Volume (Billion), by Sharing Type 2024 & 2032
- Figure 17: North America Micro Mobility Market Revenue Share (%), by Sharing Type 2024 & 2032
- Figure 18: North America Micro Mobility Market Volume Share (%), by Sharing Type 2024 & 2032
- Figure 19: North America Micro Mobility Market Revenue (Million), by Country 2024 & 2032
- Figure 20: North America Micro Mobility Market Volume (Billion), by Country 2024 & 2032
- Figure 21: North America Micro Mobility Market Revenue Share (%), by Country 2024 & 2032
- Figure 22: North America Micro Mobility Market Volume Share (%), by Country 2024 & 2032
- Figure 23: Europe Micro Mobility Market Revenue (Million), by Vehicle Type 2024 & 2032
- Figure 24: Europe Micro Mobility Market Volume (Billion), by Vehicle Type 2024 & 2032
- Figure 25: Europe Micro Mobility Market Revenue Share (%), by Vehicle Type 2024 & 2032
- Figure 26: Europe Micro Mobility Market Volume Share (%), by Vehicle Type 2024 & 2032
- Figure 27: Europe Micro Mobility Market Revenue (Million), by Battery 2024 & 2032
- Figure 28: Europe Micro Mobility Market Volume (Billion), by Battery 2024 & 2032
- Figure 29: Europe Micro Mobility Market Revenue Share (%), by Battery 2024 & 2032
- Figure 30: Europe Micro Mobility Market Volume Share (%), by Battery 2024 & 2032
- Figure 31: Europe Micro Mobility Market Revenue (Million), by Voltage 2024 & 2032
- Figure 32: Europe Micro Mobility Market Volume (Billion), by Voltage 2024 & 2032
- Figure 33: Europe Micro Mobility Market Revenue Share (%), by Voltage 2024 & 2032
- Figure 34: Europe Micro Mobility Market Volume Share (%), by Voltage 2024 & 2032
- Figure 35: Europe Micro Mobility Market Revenue (Million), by Sharing Type 2024 & 2032
- Figure 36: Europe Micro Mobility Market Volume (Billion), by Sharing Type 2024 & 2032
- Figure 37: Europe Micro Mobility Market Revenue Share (%), by Sharing Type 2024 & 2032
- Figure 38: Europe Micro Mobility Market Volume Share (%), by Sharing Type 2024 & 2032
- Figure 39: Europe Micro Mobility Market Revenue (Million), by Country 2024 & 2032
- Figure 40: Europe Micro Mobility Market Volume (Billion), by Country 2024 & 2032
- Figure 41: Europe Micro Mobility Market Revenue Share (%), by Country 2024 & 2032
- Figure 42: Europe Micro Mobility Market Volume Share (%), by Country 2024 & 2032
- Figure 43: Asia Pacific Micro Mobility Market Revenue (Million), by Vehicle Type 2024 & 2032
- Figure 44: Asia Pacific Micro Mobility Market Volume (Billion), by Vehicle Type 2024 & 2032
- Figure 45: Asia Pacific Micro Mobility Market Revenue Share (%), by Vehicle Type 2024 & 2032
- Figure 46: Asia Pacific Micro Mobility Market Volume Share (%), by Vehicle Type 2024 & 2032
- Figure 47: Asia Pacific Micro Mobility Market Revenue (Million), by Battery 2024 & 2032
- Figure 48: Asia Pacific Micro Mobility Market Volume (Billion), by Battery 2024 & 2032
- Figure 49: Asia Pacific Micro Mobility Market Revenue Share (%), by Battery 2024 & 2032
- Figure 50: Asia Pacific Micro Mobility Market Volume Share (%), by Battery 2024 & 2032
- Figure 51: Asia Pacific Micro Mobility Market Revenue (Million), by Voltage 2024 & 2032
- Figure 52: Asia Pacific Micro Mobility Market Volume (Billion), by Voltage 2024 & 2032
- Figure 53: Asia Pacific Micro Mobility Market Revenue Share (%), by Voltage 2024 & 2032
- Figure 54: Asia Pacific Micro Mobility Market Volume Share (%), by Voltage 2024 & 2032
- Figure 55: Asia Pacific Micro Mobility Market Revenue (Million), by Sharing Type 2024 & 2032
- Figure 56: Asia Pacific Micro Mobility Market Volume (Billion), by Sharing Type 2024 & 2032
- Figure 57: Asia Pacific Micro Mobility Market Revenue Share (%), by Sharing Type 2024 & 2032
- Figure 58: Asia Pacific Micro Mobility Market Volume Share (%), by Sharing Type 2024 & 2032
- Figure 59: Asia Pacific Micro Mobility Market Revenue (Million), by Country 2024 & 2032
- Figure 60: Asia Pacific Micro Mobility Market Volume (Billion), by Country 2024 & 2032
- Figure 61: Asia Pacific Micro Mobility Market Revenue Share (%), by Country 2024 & 2032
- Figure 62: Asia Pacific Micro Mobility Market Volume Share (%), by Country 2024 & 2032
- Figure 63: Rest of the World Micro Mobility Market Revenue (Million), by Vehicle Type 2024 & 2032
- Figure 64: Rest of the World Micro Mobility Market Volume (Billion), by Vehicle Type 2024 & 2032
- Figure 65: Rest of the World Micro Mobility Market Revenue Share (%), by Vehicle Type 2024 & 2032
- Figure 66: Rest of the World Micro Mobility Market Volume Share (%), by Vehicle Type 2024 & 2032
- Figure 67: Rest of the World Micro Mobility Market Revenue (Million), by Battery 2024 & 2032
- Figure 68: Rest of the World Micro Mobility Market Volume (Billion), by Battery 2024 & 2032
- Figure 69: Rest of the World Micro Mobility Market Revenue Share (%), by Battery 2024 & 2032
- Figure 70: Rest of the World Micro Mobility Market Volume Share (%), by Battery 2024 & 2032
- Figure 71: Rest of the World Micro Mobility Market Revenue (Million), by Voltage 2024 & 2032
- Figure 72: Rest of the World Micro Mobility Market Volume (Billion), by Voltage 2024 & 2032
- Figure 73: Rest of the World Micro Mobility Market Revenue Share (%), by Voltage 2024 & 2032
- Figure 74: Rest of the World Micro Mobility Market Volume Share (%), by Voltage 2024 & 2032
- Figure 75: Rest of the World Micro Mobility Market Revenue (Million), by Sharing Type 2024 & 2032
- Figure 76: Rest of the World Micro Mobility Market Volume (Billion), by Sharing Type 2024 & 2032
- Figure 77: Rest of the World Micro Mobility Market Revenue Share (%), by Sharing Type 2024 & 2032
- Figure 78: Rest of the World Micro Mobility Market Volume Share (%), by Sharing Type 2024 & 2032
- Figure 79: Rest of the World Micro Mobility Market Revenue (Million), by Country 2024 & 2032
- Figure 80: Rest of the World Micro Mobility Market Volume (Billion), by Country 2024 & 2032
- Figure 81: Rest of the World Micro Mobility Market Revenue Share (%), by Country 2024 & 2032
- Figure 82: Rest of the World Micro Mobility Market Volume Share (%), by Country 2024 & 2032
List of Tables
- Table 1: Global Micro Mobility Market Revenue Million Forecast, by Region 2019 & 2032
- Table 2: Global Micro Mobility Market Volume Billion Forecast, by Region 2019 & 2032
- Table 3: Global Micro Mobility Market Revenue Million Forecast, by Vehicle Type 2019 & 2032
- Table 4: Global Micro Mobility Market Volume Billion Forecast, by Vehicle Type 2019 & 2032
- Table 5: Global Micro Mobility Market Revenue Million Forecast, by Battery 2019 & 2032
- Table 6: Global Micro Mobility Market Volume Billion Forecast, by Battery 2019 & 2032
- Table 7: Global Micro Mobility Market Revenue Million Forecast, by Voltage 2019 & 2032
- Table 8: Global Micro Mobility Market Volume Billion Forecast, by Voltage 2019 & 2032
- Table 9: Global Micro Mobility Market Revenue Million Forecast, by Sharing Type 2019 & 2032
- Table 10: Global Micro Mobility Market Volume Billion Forecast, by Sharing Type 2019 & 2032
- Table 11: Global Micro Mobility Market Revenue Million Forecast, by Region 2019 & 2032
- Table 12: Global Micro Mobility Market Volume Billion Forecast, by Region 2019 & 2032
- Table 13: Global Micro Mobility Market Revenue Million Forecast, by Vehicle Type 2019 & 2032
- Table 14: Global Micro Mobility Market Volume Billion Forecast, by Vehicle Type 2019 & 2032
- Table 15: Global Micro Mobility Market Revenue Million Forecast, by Battery 2019 & 2032
- Table 16: Global Micro Mobility Market Volume Billion Forecast, by Battery 2019 & 2032
- Table 17: Global Micro Mobility Market Revenue Million Forecast, by Voltage 2019 & 2032
- Table 18: Global Micro Mobility Market Volume Billion Forecast, by Voltage 2019 & 2032
- Table 19: Global Micro Mobility Market Revenue Million Forecast, by Sharing Type 2019 & 2032
- Table 20: Global Micro Mobility Market Volume Billion Forecast, by Sharing Type 2019 & 2032
- Table 21: Global Micro Mobility Market Revenue Million Forecast, by Country 2019 & 2032
- Table 22: Global Micro Mobility Market Volume Billion Forecast, by Country 2019 & 2032
- Table 23: United States Micro Mobility Market Revenue (Million) Forecast, by Application 2019 & 2032
- Table 24: United States Micro Mobility Market Volume (Billion) Forecast, by Application 2019 & 2032
- Table 25: Canada Micro Mobility Market Revenue (Million) Forecast, by Application 2019 & 2032
- Table 26: Canada Micro Mobility Market Volume (Billion) Forecast, by Application 2019 & 2032
- Table 27: Rest of North America Micro Mobility Market Revenue (Million) Forecast, by Application 2019 & 2032
- Table 28: Rest of North America Micro Mobility Market Volume (Billion) Forecast, by Application 2019 & 2032
- Table 29: Global Micro Mobility Market Revenue Million Forecast, by Vehicle Type 2019 & 2032
- Table 30: Global Micro Mobility Market Volume Billion Forecast, by Vehicle Type 2019 & 2032
- Table 31: Global Micro Mobility Market Revenue Million Forecast, by Battery 2019 & 2032
- Table 32: Global Micro Mobility Market Volume Billion Forecast, by Battery 2019 & 2032
- Table 33: Global Micro Mobility Market Revenue Million Forecast, by Voltage 2019 & 2032
- Table 34: Global Micro Mobility Market Volume Billion Forecast, by Voltage 2019 & 2032
- Table 35: Global Micro Mobility Market Revenue Million Forecast, by Sharing Type 2019 & 2032
- Table 36: Global Micro Mobility Market Volume Billion Forecast, by Sharing Type 2019 & 2032
- Table 37: Global Micro Mobility Market Revenue Million Forecast, by Country 2019 & 2032
- Table 38: Global Micro Mobility Market Volume Billion Forecast, by Country 2019 & 2032
- Table 39: Germany Micro Mobility Market Revenue (Million) Forecast, by Application 2019 & 2032
- Table 40: Germany Micro Mobility Market Volume (Billion) Forecast, by Application 2019 & 2032
- Table 41: United Kingdom Micro Mobility Market Revenue (Million) Forecast, by Application 2019 & 2032
- Table 42: United Kingdom Micro Mobility Market Volume (Billion) Forecast, by Application 2019 & 2032
- Table 43: France Micro Mobility Market Revenue (Million) Forecast, by Application 2019 & 2032
- Table 44: France Micro Mobility Market Volume (Billion) Forecast, by Application 2019 & 2032
- Table 45: Italy Micro Mobility Market Revenue (Million) Forecast, by Application 2019 & 2032
- Table 46: Italy Micro Mobility Market Volume (Billion) Forecast, by Application 2019 & 2032
- Table 47: Spain Micro Mobility Market Revenue (Million) Forecast, by Application 2019 & 2032
- Table 48: Spain Micro Mobility Market Volume (Billion) Forecast, by Application 2019 & 2032
- Table 49: Rest of Europe Micro Mobility Market Revenue (Million) Forecast, by Application 2019 & 2032
- Table 50: Rest of Europe Micro Mobility Market Volume (Billion) Forecast, by Application 2019 & 2032
- Table 51: Global Micro Mobility Market Revenue Million Forecast, by Vehicle Type 2019 & 2032
- Table 52: Global Micro Mobility Market Volume Billion Forecast, by Vehicle Type 2019 & 2032
- Table 53: Global Micro Mobility Market Revenue Million Forecast, by Battery 2019 & 2032
- Table 54: Global Micro Mobility Market Volume Billion Forecast, by Battery 2019 & 2032
- Table 55: Global Micro Mobility Market Revenue Million Forecast, by Voltage 2019 & 2032
- Table 56: Global Micro Mobility Market Volume Billion Forecast, by Voltage 2019 & 2032
- Table 57: Global Micro Mobility Market Revenue Million Forecast, by Sharing Type 2019 & 2032
- Table 58: Global Micro Mobility Market Volume Billion Forecast, by Sharing Type 2019 & 2032
- Table 59: Global Micro Mobility Market Revenue Million Forecast, by Country 2019 & 2032
- Table 60: Global Micro Mobility Market Volume Billion Forecast, by Country 2019 & 2032
- Table 61: China Micro Mobility Market Revenue (Million) Forecast, by Application 2019 & 2032
- Table 62: China Micro Mobility Market Volume (Billion) Forecast, by Application 2019 & 2032
- Table 63: Japan Micro Mobility Market Revenue (Million) Forecast, by Application 2019 & 2032
- Table 64: Japan Micro Mobility Market Volume (Billion) Forecast, by Application 2019 & 2032
- Table 65: India Micro Mobility Market Revenue (Million) Forecast, by Application 2019 & 2032
- Table 66: India Micro Mobility Market Volume (Billion) Forecast, by Application 2019 & 2032
- Table 67: South Korea Micro Mobility Market Revenue (Million) Forecast, by Application 2019 & 2032
- Table 68: South Korea Micro Mobility Market Volume (Billion) Forecast, by Application 2019 & 2032
- Table 69: Rest of Asia Pacific Micro Mobility Market Revenue (Million) Forecast, by Application 2019 & 2032
- Table 70: Rest of Asia Pacific Micro Mobility Market Volume (Billion) Forecast, by Application 2019 & 2032
- Table 71: Global Micro Mobility Market Revenue Million Forecast, by Vehicle Type 2019 & 2032
- Table 72: Global Micro Mobility Market Volume Billion Forecast, by Vehicle Type 2019 & 2032
- Table 73: Global Micro Mobility Market Revenue Million Forecast, by Battery 2019 & 2032
- Table 74: Global Micro Mobility Market Volume Billion Forecast, by Battery 2019 & 2032
- Table 75: Global Micro Mobility Market Revenue Million Forecast, by Voltage 2019 & 2032
- Table 76: Global Micro Mobility Market Volume Billion Forecast, by Voltage 2019 & 2032
- Table 77: Global Micro Mobility Market Revenue Million Forecast, by Sharing Type 2019 & 2032
- Table 78: Global Micro Mobility Market Volume Billion Forecast, by Sharing Type 2019 & 2032
- Table 79: Global Micro Mobility Market Revenue Million Forecast, by Country 2019 & 2032
- Table 80: Global Micro Mobility Market Volume Billion Forecast, by Country 2019 & 2032
- Table 81: South America Micro Mobility Market Revenue (Million) Forecast, by Application 2019 & 2032
- Table 82: South America Micro Mobility Market Volume (Billion) Forecast, by Application 2019 & 2032
- Table 83: Middle East and Africa Micro Mobility Market Revenue (Million) Forecast, by Application 2019 & 2032
- Table 84: Middle East and Africa Micro Mobility Market Volume (Billion) Forecast, by Application 2019 & 2032
Frequently Asked Questions
1. What is the projected Compound Annual Growth Rate (CAGR) of the Micro Mobility Market?
The projected CAGR is approximately > 12.00%.
2. Which companies are prominent players in the Micro Mobility Market?
Key companies in the market include Beam Mobility Holdings Pte Ltd, Bird Rides, Dott, ElectricFeel, Floatility GmbH, Lime, Yulu Bikes Pvt Ltd, Voi, Superpedestrian Inc.
3. What are the main segments of the Micro Mobility Market?
The market segments include Vehicle Type, Battery, Voltage, Sharing Type.
4. Can you provide details about the market size?
The market size is estimated to be USD 5.43 Million as of 2022.
5. What are some drivers contributing to market growth?
Increasing Urban Congestion and a Shift Toward Sustainable Transportation Solutions to Drive Market Growth.
6. What are the notable trends driving market growth?
Docked Micromobility Paving the Way for Sustainable Urban Transportation.
7. Are there any restraints impacting market growth?
Increasing Urban Congestion and a Shift Toward Sustainable Transportation Solutions to Drive Market Growth.
8. Can you provide examples of recent developments in the market?
March 2023: Voi Technology secured an additional USD 22.8 million in funding to extend its e-scooter services across Europe. This investment will support Voi's plan to increase its fleet and enhance its offerings in urban mobility solutions.
9. What pricing options are available for accessing the report?
Pricing options include single-user, multi-user, and enterprise licenses priced at USD 4750, USD 5250, and USD 8750 respectively.
10. Is the market size provided in terms of value or volume?
The market size is provided in terms of value, measured in Million and volume, measured in Billion.
11. Are there any specific market keywords associated with the report?
Yes, the market keyword associated with the report is "Micro Mobility Market," which aids in identifying and referencing the specific market segment covered.
12. How do I determine which pricing option suits my needs best?
The pricing options vary based on user requirements and access needs. Individual users may opt for single-user licenses, while businesses requiring broader access may choose multi-user or enterprise licenses for cost-effective access to the report.
13. Are there any additional resources or data provided in the Micro Mobility Market report?
While the report offers comprehensive insights, it's advisable to review the specific contents or supplementary materials provided to ascertain if additional resources or data are available.
14. How can I stay updated on further developments or reports in the Micro Mobility Market?
To stay informed about further developments, trends, and reports in the Micro Mobility Market, consider subscribing to industry newsletters, following relevant companies and organizations, or regularly checking reputable industry news sources and publications.
Methodology
Step 1 - Identification of Relevant Samples Size from Population Database


Step 2 - Approaches for Defining Global Market Size (Value, Volume* & Price*)

Note*: In applicable scenarios
Step 3 - Data Sources
Primary Research
- Web Analytics
- Survey Reports
- Research Institute
- Latest Research Reports
- Opinion Leaders
Secondary Research
- Annual Reports
- White Paper
- Latest Press Release
- Industry Association
- Paid Database
- Investor Presentations

Step 4 - Data Triangulation
Involves using different sources of information in order to increase the validity of a study
These sources are likely to be stakeholders in a program - participants, other researchers, program staff, other community members, and so on.
Then we put all data in single framework & apply various statistical tools to find out the dynamic on the market.
During the analysis stage, feedback from the stakeholder groups would be compared to determine areas of agreement as well as areas of divergence


