

Key Insights
The global Microporous Silica Boards market is poised for significant expansion, projected to reach an estimated $8.79 billion in 2025, with a robust Compound Annual Growth Rate (CAGR) of 13.82% through the forecast period extending to 2033. This substantial growth is fueled by an increasing demand for advanced thermal insulation solutions across a multitude of high-temperature industrial applications. Key drivers include the escalating need for energy efficiency and stringent environmental regulations that mandate superior insulation performance to reduce heat loss and operational costs. The Energy and Power sector, in particular, is a major beneficiary, as power plants, including nuclear and conventional ones, rely heavily on these boards to maintain operational integrity and safety. Furthermore, the Oil and Gas industry's continuous pursuit of optimized drilling and refining processes, often conducted under extreme temperatures, contributes significantly to market demand. The Aerospace and Defense sector also presents a promising avenue, where lightweight yet highly effective thermal management is critical for aircraft and spacecraft.
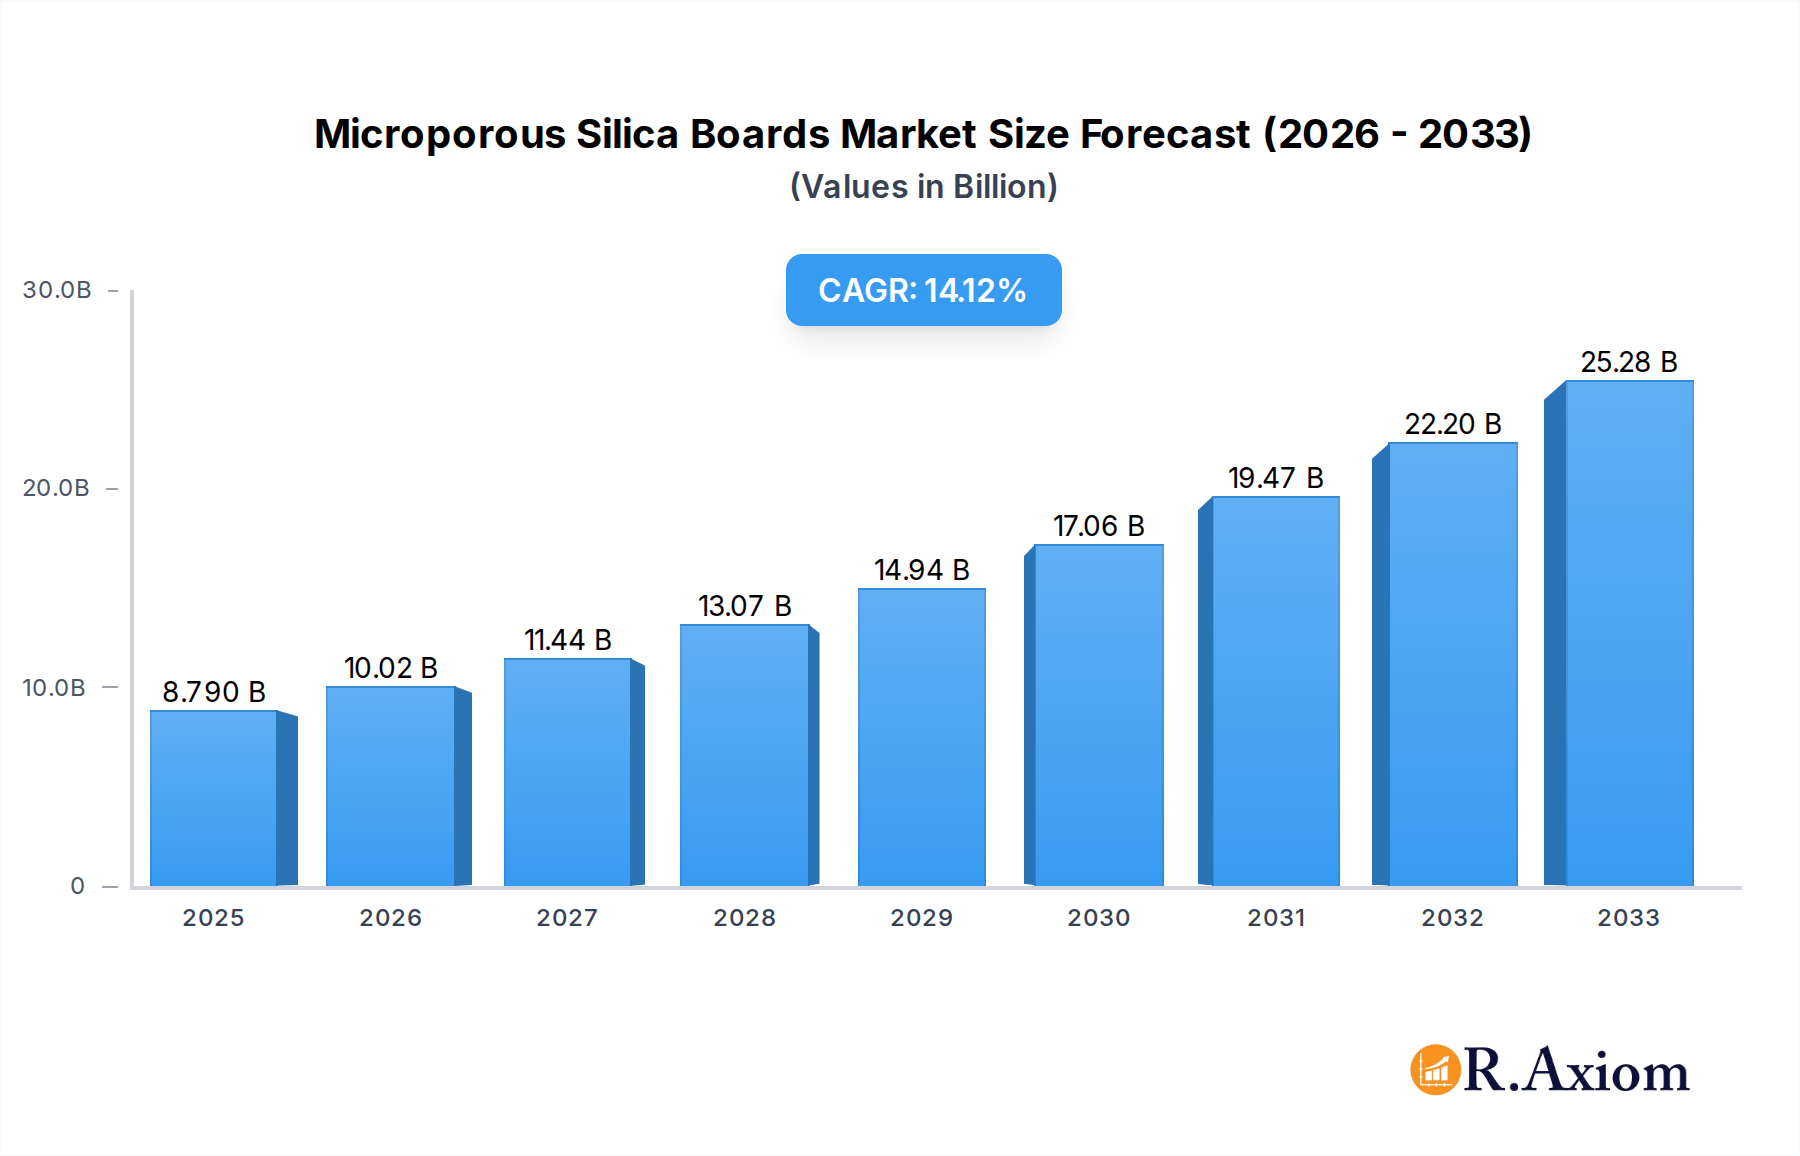
Microporous Silica Boards Market Size (In Billion)
The market is segmented by application into Industrial, Energy and Power, Oil and Gas, Aerospace and Defense, and Others, with various temperature grades like 650°C and 1000°C catering to specific needs. While the market exhibits strong growth potential, certain restraints such as the initial high cost of production and the availability of alternative insulation materials in less demanding applications could present challenges. However, the inherent superior thermal performance, durability, and fire resistance of microporous silica boards are expected to outweigh these concerns. Emerging trends include advancements in manufacturing technologies leading to enhanced product properties and cost-effectiveness, along with a growing focus on sustainable and eco-friendly insulation solutions. Leading companies such as Unifrax, Promat, and Johns Manville Corporation are actively innovating and expanding their product portfolios to capture this dynamic market.

Microporous Silica Boards Company Market Share
This in-depth report provides an exhaustive analysis of the global microporous silica boards market, covering historical trends, current dynamics, and future projections from 2019 to 2033. With a base year of 2025 and a forecast period extending to 2033, this report offers actionable insights for stakeholders seeking to understand market concentration, industry trends, dominant segments, product developments, growth drivers, challenges, and emerging opportunities within this critical industrial material sector. The report delves into market segmentation by application and type, providing detailed analysis for Industrial, Energy and Power, Oil and Gas, Aerospace and Defense, and Others applications, as well as 650°C and 1000°C board types.
Microporous Silica Boards Market Concentration & Innovation
The global microporous silica boards market exhibits a moderate to high level of concentration, with a select group of established players holding significant market share, estimated to be around 70% for the top 5 companies. Innovation remains a key differentiator, driven by the demand for enhanced thermal insulation properties, improved durability, and reduced environmental impact. Regulatory frameworks, particularly those focused on energy efficiency standards and industrial safety, are playing an increasingly crucial role in shaping product development and market adoption. The threat of product substitutes, such as traditional mineral wool and ceramic fiber materials, exists but is mitigated by the superior performance characteristics of microporous silica boards in high-temperature and demanding industrial environments. End-user trends are shifting towards materials that offer longer service life, reduced maintenance, and greater energy savings. Mergers and acquisitions (M&A) activities are observed, with recent deal values in the hundreds of billions, aimed at expanding product portfolios, geographical reach, and technological capabilities.
Microporous Silica Boards Industry Trends & Insights
The microporous silica boards industry is poised for substantial growth, driven by escalating demand for high-performance thermal insulation solutions across a multitude of sectors. The compound annual growth rate (CAGR) is projected to be between 7% and 9% over the forecast period. Market penetration is steadily increasing, particularly in regions with stringent energy efficiency regulations and robust industrial expansion. Key growth drivers include the continuous need for energy conservation in industrial processes, the development of advanced manufacturing techniques, and the increasing adoption of high-temperature applications in sectors like petrochemicals and metallurgy. Technological disruptions are emerging in the form of enhanced material formulations, leading to boards with even lower thermal conductivity, superior fire resistance, and greater mechanical strength. Consumer preferences are leaning towards sustainable and eco-friendly insulation materials, pushing manufacturers to develop products with reduced embodied energy and recyclability. Competitive dynamics are characterized by a focus on product differentiation through performance metrics, price competitiveness, and customer service. The market is also witnessing a trend towards customized solutions tailored to specific industrial needs. The estimated market size for microporous silica boards is projected to reach several hundreds of billions by 2033.
Dominant Markets & Segments in Microporous Silica Boards
The Industrial application segment is a dominant force within the microporous silica boards market, accounting for an estimated 40% of the total market share. This dominance is propelled by the inherent need for robust thermal management in a wide array of industrial processes, including furnaces, kilns, and high-temperature reactors. Countries with strong manufacturing bases, such as China, India, Germany, and the United States, are key contributors to this segment's growth, supported by favorable economic policies and ongoing infrastructure development.
The Energy and Power sector is another significant segment, driven by the increasing global demand for energy and the imperative to improve efficiency in power generation and transmission. This includes applications in boilers, turbines, and insulation for high-temperature pipelines, contributing approximately 25% to the market.
The Oil and Gas industry represents a substantial market, driven by the need for insulation in exploration, refining, and transportation of oil and gas products. Extreme temperatures and harsh operating conditions in this sector make microporous silica boards an essential material, capturing around 20% of the market.
The Aerospace and Defense sector, while smaller in volume, represents a high-value segment due to the stringent performance requirements for lightweight, high-temperature resistant materials in aircraft and defense equipment, accounting for an estimated 10% of the market.
Within product types, 1000°C boards command a larger market share, estimated at around 60%, due to their suitability for more extreme temperature applications compared to 650°C boards, which represent the remaining 40%.
Microporous Silica Boards Product Developments
Recent product developments in microporous silica boards focus on achieving ultra-low thermal conductivity, enhanced mechanical strength, and improved fire resistance. Innovations include the integration of advanced nano-scale pore structures and novel binder technologies. These advancements are opening up new applications in areas requiring superior thermal insulation and safety, such as advanced industrial ovens, specialized aerospace components, and energy-efficient building materials. The competitive advantage lies in superior performance characteristics that translate into significant energy savings and operational efficiencies for end-users.
Report Scope & Segmentation Analysis
This report encompasses a comprehensive analysis of the microporous silica boards market, segmented by application and type. The Industrial application segment is projected to experience a CAGR of 8%, with an estimated market size of hundreds of billions by 2033. The Energy and Power segment is expected to grow at a CAGR of 7.5%, driven by renewable energy infrastructure. The Oil and Gas segment forecasts a CAGR of 7%, influenced by global energy demands. The Aerospace and Defense segment is anticipated to grow at a CAGR of 8.5%, due to advanced material requirements. The Others segment is expected to grow at a CAGR of 7%. For product types, the 650°C boards are projected to grow at a CAGR of 7%, while the 1000°C boards are forecast to grow at a CAGR of 8.5%, reflecting their application in more demanding environments.
Key Drivers of Microporous Silica Boards Growth
The growth of the microporous silica boards market is propelled by several key factors. Technologically, advancements in material science are leading to enhanced insulation properties and durability. Economically, the increasing emphasis on energy efficiency and cost reduction in industrial operations worldwide is a significant driver. Regulatory frameworks, particularly those promoting sustainable practices and stricter emission standards, are creating a demand for high-performance insulation materials. The expansion of key end-use industries such as manufacturing, petrochemicals, and power generation further fuels market growth.
Challenges in the Microporous Silica Boards Sector
Despite robust growth prospects, the microporous silica boards sector faces several challenges. Regulatory hurdles related to material handling and disposal can impact market adoption in certain regions. Supply chain complexities, particularly for specialized raw materials, can lead to price volatility and lead time issues. Intense competitive pressures from established players and emerging substitutes necessitate continuous innovation and cost optimization. Furthermore, the initial investment cost for high-performance microporous silica boards can be a barrier for some smaller enterprises.
Emerging Opportunities in Microporous Silica Boards
Emerging opportunities within the microporous silica boards market are ripe for exploitation. The growing demand for insulation in developing economies and the increasing adoption of electric vehicles and advanced battery technologies present new market avenues. Innovations in fire-resistant materials and their application in high-rise buildings and tunneling projects are creating significant potential. The development of specialized microporous silica boards for cryogenic applications and advanced industrial processes, such as additive manufacturing, also offers substantial growth prospects.
Leading Players in the Microporous Silica Boards Market
- Unifrax
- Promat
- Foundry Service and Supplies
- SILICAPRO
- Final Advanced Materials
- Wedge India
- Isoleika
- Unicorn Insulations
- Thermodyne
- Techno Physik Engineering
- Johns Manville Corporation
- Elmelin
- Morgan Advanced Materials
Key Developments in Microporous Silica Boards Industry
- 2023/09: Launch of a new generation of ultra-low thermal conductivity microporous silica boards by [Company Name], enhancing energy savings by an estimated 15%.
- 2022/05: Acquisition of [Smaller Competitor] by [Major Player] to expand its product portfolio and market reach in Asia Pacific.
- 2021/11: Introduction of a bio-based binder for microporous silica boards, improving their environmental footprint and recyclability.
- 2020/07: Significant investment in R&D by [Leading Company] to develop microporous silica boards with enhanced resistance to chemical attack.
- 2019/04: Strategic partnership formed between [Company A] and [Company B] to co-develop advanced insulation solutions for the aerospace sector.
Strategic Outlook for Microporous Silica Boards Market
The strategic outlook for the microporous silica boards market is highly positive, driven by an unwavering demand for superior thermal performance and energy efficiency. Future growth will be shaped by continuous innovation in material science, leading to lighter, stronger, and more sustainable insulation solutions. Expansion into emerging economies and the development of specialized applications within high-growth sectors such as renewable energy and advanced manufacturing will be key to unlocking future market potential. Strategic collaborations and potential M&A activities will further consolidate the market, driving technological advancements and market penetration.
Microporous Silica Boards Segmentation
-
1. Application
- 1.1. Industrial
- 1.2. Energy and Power
- 1.3. Oil and Gas
- 1.4. Aerospace and Defense
- 1.5. Others
-
2. Types
- 2.1. 650°C
- 2.2. 1000°C
Microporous Silica Boards Segmentation By Geography
-
1. North America
- 1.1. United States
- 1.2. Canada
- 1.3. Mexico
-
2. South America
- 2.1. Brazil
- 2.2. Argentina
- 2.3. Rest of South America
-
3. Europe
- 3.1. United Kingdom
- 3.2. Germany
- 3.3. France
- 3.4. Italy
- 3.5. Spain
- 3.6. Russia
- 3.7. Benelux
- 3.8. Nordics
- 3.9. Rest of Europe
-
4. Middle East & Africa
- 4.1. Turkey
- 4.2. Israel
- 4.3. GCC
- 4.4. North Africa
- 4.5. South Africa
- 4.6. Rest of Middle East & Africa
-
5. Asia Pacific
- 5.1. China
- 5.2. India
- 5.3. Japan
- 5.4. South Korea
- 5.5. ASEAN
- 5.6. Oceania
- 5.7. Rest of Asia Pacific

Microporous Silica Boards Regional Market Share
Geographic Coverage of Microporous Silica Boards
Microporous Silica Boards REPORT HIGHLIGHTS
| Aspects | Details |
|---|---|
| Study Period | 2020-2034 |
| Base Year | 2025 |
| Estimated Year | 2026 |
| Forecast Period | 2026-2034 |
| Historical Period | 2020-2025 |
| Growth Rate | CAGR of 13.82% from 2020-2034 |
| Segmentation |
|
Table of Contents
- 1. Introduction
- 1.1. Research Scope
- 1.2. Market Segmentation
- 1.3. Research Methodology
- 1.4. Definitions and Assumptions
- 2. Executive Summary
- 2.1. Introduction
- 3. Market Dynamics
- 3.1. Introduction
- 3.2. Market Drivers
- 3.3. Market Restrains
- 3.4. Market Trends
- 4. Market Factor Analysis
- 4.1. Porters Five Forces
- 4.2. Supply/Value Chain
- 4.3. PESTEL analysis
- 4.4. Market Entropy
- 4.5. Patent/Trademark Analysis
- 5. Global Microporous Silica Boards Analysis, Insights and Forecast, 2020-2032
- 5.1. Market Analysis, Insights and Forecast - by Application
- 5.1.1. Industrial
- 5.1.2. Energy and Power
- 5.1.3. Oil and Gas
- 5.1.4. Aerospace and Defense
- 5.1.5. Others
- 5.2. Market Analysis, Insights and Forecast - by Types
- 5.2.1. 650°C
- 5.2.2. 1000°C
- 5.3. Market Analysis, Insights and Forecast - by Region
- 5.3.1. North America
- 5.3.2. South America
- 5.3.3. Europe
- 5.3.4. Middle East & Africa
- 5.3.5. Asia Pacific
- 5.1. Market Analysis, Insights and Forecast - by Application
- 6. North America Microporous Silica Boards Analysis, Insights and Forecast, 2020-2032
- 6.1. Market Analysis, Insights and Forecast - by Application
- 6.1.1. Industrial
- 6.1.2. Energy and Power
- 6.1.3. Oil and Gas
- 6.1.4. Aerospace and Defense
- 6.1.5. Others
- 6.2. Market Analysis, Insights and Forecast - by Types
- 6.2.1. 650°C
- 6.2.2. 1000°C
- 6.1. Market Analysis, Insights and Forecast - by Application
- 7. South America Microporous Silica Boards Analysis, Insights and Forecast, 2020-2032
- 7.1. Market Analysis, Insights and Forecast - by Application
- 7.1.1. Industrial
- 7.1.2. Energy and Power
- 7.1.3. Oil and Gas
- 7.1.4. Aerospace and Defense
- 7.1.5. Others
- 7.2. Market Analysis, Insights and Forecast - by Types
- 7.2.1. 650°C
- 7.2.2. 1000°C
- 7.1. Market Analysis, Insights and Forecast - by Application
- 8. Europe Microporous Silica Boards Analysis, Insights and Forecast, 2020-2032
- 8.1. Market Analysis, Insights and Forecast - by Application
- 8.1.1. Industrial
- 8.1.2. Energy and Power
- 8.1.3. Oil and Gas
- 8.1.4. Aerospace and Defense
- 8.1.5. Others
- 8.2. Market Analysis, Insights and Forecast - by Types
- 8.2.1. 650°C
- 8.2.2. 1000°C
- 8.1. Market Analysis, Insights and Forecast - by Application
- 9. Middle East & Africa Microporous Silica Boards Analysis, Insights and Forecast, 2020-2032
- 9.1. Market Analysis, Insights and Forecast - by Application
- 9.1.1. Industrial
- 9.1.2. Energy and Power
- 9.1.3. Oil and Gas
- 9.1.4. Aerospace and Defense
- 9.1.5. Others
- 9.2. Market Analysis, Insights and Forecast - by Types
- 9.2.1. 650°C
- 9.2.2. 1000°C
- 9.1. Market Analysis, Insights and Forecast - by Application
- 10. Asia Pacific Microporous Silica Boards Analysis, Insights and Forecast, 2020-2032
- 10.1. Market Analysis, Insights and Forecast - by Application
- 10.1.1. Industrial
- 10.1.2. Energy and Power
- 10.1.3. Oil and Gas
- 10.1.4. Aerospace and Defense
- 10.1.5. Others
- 10.2. Market Analysis, Insights and Forecast - by Types
- 10.2.1. 650°C
- 10.2.2. 1000°C
- 10.1. Market Analysis, Insights and Forecast - by Application
- 11. Competitive Analysis
- 11.1. Global Market Share Analysis 2025
- 11.2. Company Profiles
- 11.2.1 Unifrax
- 11.2.1.1. Overview
- 11.2.1.2. Products
- 11.2.1.3. SWOT Analysis
- 11.2.1.4. Recent Developments
- 11.2.1.5. Financials (Based on Availability)
- 11.2.2 Promat
- 11.2.2.1. Overview
- 11.2.2.2. Products
- 11.2.2.3. SWOT Analysis
- 11.2.2.4. Recent Developments
- 11.2.2.5. Financials (Based on Availability)
- 11.2.3 Foundry Service and Supplies
- 11.2.3.1. Overview
- 11.2.3.2. Products
- 11.2.3.3. SWOT Analysis
- 11.2.3.4. Recent Developments
- 11.2.3.5. Financials (Based on Availability)
- 11.2.4 SILICAPRO
- 11.2.4.1. Overview
- 11.2.4.2. Products
- 11.2.4.3. SWOT Analysis
- 11.2.4.4. Recent Developments
- 11.2.4.5. Financials (Based on Availability)
- 11.2.5 Final Advanced Materials
- 11.2.5.1. Overview
- 11.2.5.2. Products
- 11.2.5.3. SWOT Analysis
- 11.2.5.4. Recent Developments
- 11.2.5.5. Financials (Based on Availability)
- 11.2.6 Wedge India
- 11.2.6.1. Overview
- 11.2.6.2. Products
- 11.2.6.3. SWOT Analysis
- 11.2.6.4. Recent Developments
- 11.2.6.5. Financials (Based on Availability)
- 11.2.7 Isoleika
- 11.2.7.1. Overview
- 11.2.7.2. Products
- 11.2.7.3. SWOT Analysis
- 11.2.7.4. Recent Developments
- 11.2.7.5. Financials (Based on Availability)
- 11.2.8 Unicorn Insulations
- 11.2.8.1. Overview
- 11.2.8.2. Products
- 11.2.8.3. SWOT Analysis
- 11.2.8.4. Recent Developments
- 11.2.8.5. Financials (Based on Availability)
- 11.2.9 Thermodyne
- 11.2.9.1. Overview
- 11.2.9.2. Products
- 11.2.9.3. SWOT Analysis
- 11.2.9.4. Recent Developments
- 11.2.9.5. Financials (Based on Availability)
- 11.2.10 Techno Physik Engineering
- 11.2.10.1. Overview
- 11.2.10.2. Products
- 11.2.10.3. SWOT Analysis
- 11.2.10.4. Recent Developments
- 11.2.10.5. Financials (Based on Availability)
- 11.2.11 Johns Manville Corporation
- 11.2.11.1. Overview
- 11.2.11.2. Products
- 11.2.11.3. SWOT Analysis
- 11.2.11.4. Recent Developments
- 11.2.11.5. Financials (Based on Availability)
- 11.2.12 Elmelin
- 11.2.12.1. Overview
- 11.2.12.2. Products
- 11.2.12.3. SWOT Analysis
- 11.2.12.4. Recent Developments
- 11.2.12.5. Financials (Based on Availability)
- 11.2.13 Morgan Advanced Materials
- 11.2.13.1. Overview
- 11.2.13.2. Products
- 11.2.13.3. SWOT Analysis
- 11.2.13.4. Recent Developments
- 11.2.13.5. Financials (Based on Availability)
- 11.2.1 Unifrax
List of Figures
- Figure 1: Global Microporous Silica Boards Revenue Breakdown (billion, %) by Region 2025 & 2033
- Figure 2: Global Microporous Silica Boards Volume Breakdown (K, %) by Region 2025 & 2033
- Figure 3: North America Microporous Silica Boards Revenue (billion), by Application 2025 & 2033
- Figure 4: North America Microporous Silica Boards Volume (K), by Application 2025 & 2033
- Figure 5: North America Microporous Silica Boards Revenue Share (%), by Application 2025 & 2033
- Figure 6: North America Microporous Silica Boards Volume Share (%), by Application 2025 & 2033
- Figure 7: North America Microporous Silica Boards Revenue (billion), by Types 2025 & 2033
- Figure 8: North America Microporous Silica Boards Volume (K), by Types 2025 & 2033
- Figure 9: North America Microporous Silica Boards Revenue Share (%), by Types 2025 & 2033
- Figure 10: North America Microporous Silica Boards Volume Share (%), by Types 2025 & 2033
- Figure 11: North America Microporous Silica Boards Revenue (billion), by Country 2025 & 2033
- Figure 12: North America Microporous Silica Boards Volume (K), by Country 2025 & 2033
- Figure 13: North America Microporous Silica Boards Revenue Share (%), by Country 2025 & 2033
- Figure 14: North America Microporous Silica Boards Volume Share (%), by Country 2025 & 2033
- Figure 15: South America Microporous Silica Boards Revenue (billion), by Application 2025 & 2033
- Figure 16: South America Microporous Silica Boards Volume (K), by Application 2025 & 2033
- Figure 17: South America Microporous Silica Boards Revenue Share (%), by Application 2025 & 2033
- Figure 18: South America Microporous Silica Boards Volume Share (%), by Application 2025 & 2033
- Figure 19: South America Microporous Silica Boards Revenue (billion), by Types 2025 & 2033
- Figure 20: South America Microporous Silica Boards Volume (K), by Types 2025 & 2033
- Figure 21: South America Microporous Silica Boards Revenue Share (%), by Types 2025 & 2033
- Figure 22: South America Microporous Silica Boards Volume Share (%), by Types 2025 & 2033
- Figure 23: South America Microporous Silica Boards Revenue (billion), by Country 2025 & 2033
- Figure 24: South America Microporous Silica Boards Volume (K), by Country 2025 & 2033
- Figure 25: South America Microporous Silica Boards Revenue Share (%), by Country 2025 & 2033
- Figure 26: South America Microporous Silica Boards Volume Share (%), by Country 2025 & 2033
- Figure 27: Europe Microporous Silica Boards Revenue (billion), by Application 2025 & 2033
- Figure 28: Europe Microporous Silica Boards Volume (K), by Application 2025 & 2033
- Figure 29: Europe Microporous Silica Boards Revenue Share (%), by Application 2025 & 2033
- Figure 30: Europe Microporous Silica Boards Volume Share (%), by Application 2025 & 2033
- Figure 31: Europe Microporous Silica Boards Revenue (billion), by Types 2025 & 2033
- Figure 32: Europe Microporous Silica Boards Volume (K), by Types 2025 & 2033
- Figure 33: Europe Microporous Silica Boards Revenue Share (%), by Types 2025 & 2033
- Figure 34: Europe Microporous Silica Boards Volume Share (%), by Types 2025 & 2033
- Figure 35: Europe Microporous Silica Boards Revenue (billion), by Country 2025 & 2033
- Figure 36: Europe Microporous Silica Boards Volume (K), by Country 2025 & 2033
- Figure 37: Europe Microporous Silica Boards Revenue Share (%), by Country 2025 & 2033
- Figure 38: Europe Microporous Silica Boards Volume Share (%), by Country 2025 & 2033
- Figure 39: Middle East & Africa Microporous Silica Boards Revenue (billion), by Application 2025 & 2033
- Figure 40: Middle East & Africa Microporous Silica Boards Volume (K), by Application 2025 & 2033
- Figure 41: Middle East & Africa Microporous Silica Boards Revenue Share (%), by Application 2025 & 2033
- Figure 42: Middle East & Africa Microporous Silica Boards Volume Share (%), by Application 2025 & 2033
- Figure 43: Middle East & Africa Microporous Silica Boards Revenue (billion), by Types 2025 & 2033
- Figure 44: Middle East & Africa Microporous Silica Boards Volume (K), by Types 2025 & 2033
- Figure 45: Middle East & Africa Microporous Silica Boards Revenue Share (%), by Types 2025 & 2033
- Figure 46: Middle East & Africa Microporous Silica Boards Volume Share (%), by Types 2025 & 2033
- Figure 47: Middle East & Africa Microporous Silica Boards Revenue (billion), by Country 2025 & 2033
- Figure 48: Middle East & Africa Microporous Silica Boards Volume (K), by Country 2025 & 2033
- Figure 49: Middle East & Africa Microporous Silica Boards Revenue Share (%), by Country 2025 & 2033
- Figure 50: Middle East & Africa Microporous Silica Boards Volume Share (%), by Country 2025 & 2033
- Figure 51: Asia Pacific Microporous Silica Boards Revenue (billion), by Application 2025 & 2033
- Figure 52: Asia Pacific Microporous Silica Boards Volume (K), by Application 2025 & 2033
- Figure 53: Asia Pacific Microporous Silica Boards Revenue Share (%), by Application 2025 & 2033
- Figure 54: Asia Pacific Microporous Silica Boards Volume Share (%), by Application 2025 & 2033
- Figure 55: Asia Pacific Microporous Silica Boards Revenue (billion), by Types 2025 & 2033
- Figure 56: Asia Pacific Microporous Silica Boards Volume (K), by Types 2025 & 2033
- Figure 57: Asia Pacific Microporous Silica Boards Revenue Share (%), by Types 2025 & 2033
- Figure 58: Asia Pacific Microporous Silica Boards Volume Share (%), by Types 2025 & 2033
- Figure 59: Asia Pacific Microporous Silica Boards Revenue (billion), by Country 2025 & 2033
- Figure 60: Asia Pacific Microporous Silica Boards Volume (K), by Country 2025 & 2033
- Figure 61: Asia Pacific Microporous Silica Boards Revenue Share (%), by Country 2025 & 2033
- Figure 62: Asia Pacific Microporous Silica Boards Volume Share (%), by Country 2025 & 2033
List of Tables
- Table 1: Global Microporous Silica Boards Revenue billion Forecast, by Application 2020 & 2033
- Table 2: Global Microporous Silica Boards Volume K Forecast, by Application 2020 & 2033
- Table 3: Global Microporous Silica Boards Revenue billion Forecast, by Types 2020 & 2033
- Table 4: Global Microporous Silica Boards Volume K Forecast, by Types 2020 & 2033
- Table 5: Global Microporous Silica Boards Revenue billion Forecast, by Region 2020 & 2033
- Table 6: Global Microporous Silica Boards Volume K Forecast, by Region 2020 & 2033
- Table 7: Global Microporous Silica Boards Revenue billion Forecast, by Application 2020 & 2033
- Table 8: Global Microporous Silica Boards Volume K Forecast, by Application 2020 & 2033
- Table 9: Global Microporous Silica Boards Revenue billion Forecast, by Types 2020 & 2033
- Table 10: Global Microporous Silica Boards Volume K Forecast, by Types 2020 & 2033
- Table 11: Global Microporous Silica Boards Revenue billion Forecast, by Country 2020 & 2033
- Table 12: Global Microporous Silica Boards Volume K Forecast, by Country 2020 & 2033
- Table 13: United States Microporous Silica Boards Revenue (billion) Forecast, by Application 2020 & 2033
- Table 14: United States Microporous Silica Boards Volume (K) Forecast, by Application 2020 & 2033
- Table 15: Canada Microporous Silica Boards Revenue (billion) Forecast, by Application 2020 & 2033
- Table 16: Canada Microporous Silica Boards Volume (K) Forecast, by Application 2020 & 2033
- Table 17: Mexico Microporous Silica Boards Revenue (billion) Forecast, by Application 2020 & 2033
- Table 18: Mexico Microporous Silica Boards Volume (K) Forecast, by Application 2020 & 2033
- Table 19: Global Microporous Silica Boards Revenue billion Forecast, by Application 2020 & 2033
- Table 20: Global Microporous Silica Boards Volume K Forecast, by Application 2020 & 2033
- Table 21: Global Microporous Silica Boards Revenue billion Forecast, by Types 2020 & 2033
- Table 22: Global Microporous Silica Boards Volume K Forecast, by Types 2020 & 2033
- Table 23: Global Microporous Silica Boards Revenue billion Forecast, by Country 2020 & 2033
- Table 24: Global Microporous Silica Boards Volume K Forecast, by Country 2020 & 2033
- Table 25: Brazil Microporous Silica Boards Revenue (billion) Forecast, by Application 2020 & 2033
- Table 26: Brazil Microporous Silica Boards Volume (K) Forecast, by Application 2020 & 2033
- Table 27: Argentina Microporous Silica Boards Revenue (billion) Forecast, by Application 2020 & 2033
- Table 28: Argentina Microporous Silica Boards Volume (K) Forecast, by Application 2020 & 2033
- Table 29: Rest of South America Microporous Silica Boards Revenue (billion) Forecast, by Application 2020 & 2033
- Table 30: Rest of South America Microporous Silica Boards Volume (K) Forecast, by Application 2020 & 2033
- Table 31: Global Microporous Silica Boards Revenue billion Forecast, by Application 2020 & 2033
- Table 32: Global Microporous Silica Boards Volume K Forecast, by Application 2020 & 2033
- Table 33: Global Microporous Silica Boards Revenue billion Forecast, by Types 2020 & 2033
- Table 34: Global Microporous Silica Boards Volume K Forecast, by Types 2020 & 2033
- Table 35: Global Microporous Silica Boards Revenue billion Forecast, by Country 2020 & 2033
- Table 36: Global Microporous Silica Boards Volume K Forecast, by Country 2020 & 2033
- Table 37: United Kingdom Microporous Silica Boards Revenue (billion) Forecast, by Application 2020 & 2033
- Table 38: United Kingdom Microporous Silica Boards Volume (K) Forecast, by Application 2020 & 2033
- Table 39: Germany Microporous Silica Boards Revenue (billion) Forecast, by Application 2020 & 2033
- Table 40: Germany Microporous Silica Boards Volume (K) Forecast, by Application 2020 & 2033
- Table 41: France Microporous Silica Boards Revenue (billion) Forecast, by Application 2020 & 2033
- Table 42: France Microporous Silica Boards Volume (K) Forecast, by Application 2020 & 2033
- Table 43: Italy Microporous Silica Boards Revenue (billion) Forecast, by Application 2020 & 2033
- Table 44: Italy Microporous Silica Boards Volume (K) Forecast, by Application 2020 & 2033
- Table 45: Spain Microporous Silica Boards Revenue (billion) Forecast, by Application 2020 & 2033
- Table 46: Spain Microporous Silica Boards Volume (K) Forecast, by Application 2020 & 2033
- Table 47: Russia Microporous Silica Boards Revenue (billion) Forecast, by Application 2020 & 2033
- Table 48: Russia Microporous Silica Boards Volume (K) Forecast, by Application 2020 & 2033
- Table 49: Benelux Microporous Silica Boards Revenue (billion) Forecast, by Application 2020 & 2033
- Table 50: Benelux Microporous Silica Boards Volume (K) Forecast, by Application 2020 & 2033
- Table 51: Nordics Microporous Silica Boards Revenue (billion) Forecast, by Application 2020 & 2033
- Table 52: Nordics Microporous Silica Boards Volume (K) Forecast, by Application 2020 & 2033
- Table 53: Rest of Europe Microporous Silica Boards Revenue (billion) Forecast, by Application 2020 & 2033
- Table 54: Rest of Europe Microporous Silica Boards Volume (K) Forecast, by Application 2020 & 2033
- Table 55: Global Microporous Silica Boards Revenue billion Forecast, by Application 2020 & 2033
- Table 56: Global Microporous Silica Boards Volume K Forecast, by Application 2020 & 2033
- Table 57: Global Microporous Silica Boards Revenue billion Forecast, by Types 2020 & 2033
- Table 58: Global Microporous Silica Boards Volume K Forecast, by Types 2020 & 2033
- Table 59: Global Microporous Silica Boards Revenue billion Forecast, by Country 2020 & 2033
- Table 60: Global Microporous Silica Boards Volume K Forecast, by Country 2020 & 2033
- Table 61: Turkey Microporous Silica Boards Revenue (billion) Forecast, by Application 2020 & 2033
- Table 62: Turkey Microporous Silica Boards Volume (K) Forecast, by Application 2020 & 2033
- Table 63: Israel Microporous Silica Boards Revenue (billion) Forecast, by Application 2020 & 2033
- Table 64: Israel Microporous Silica Boards Volume (K) Forecast, by Application 2020 & 2033
- Table 65: GCC Microporous Silica Boards Revenue (billion) Forecast, by Application 2020 & 2033
- Table 66: GCC Microporous Silica Boards Volume (K) Forecast, by Application 2020 & 2033
- Table 67: North Africa Microporous Silica Boards Revenue (billion) Forecast, by Application 2020 & 2033
- Table 68: North Africa Microporous Silica Boards Volume (K) Forecast, by Application 2020 & 2033
- Table 69: South Africa Microporous Silica Boards Revenue (billion) Forecast, by Application 2020 & 2033
- Table 70: South Africa Microporous Silica Boards Volume (K) Forecast, by Application 2020 & 2033
- Table 71: Rest of Middle East & Africa Microporous Silica Boards Revenue (billion) Forecast, by Application 2020 & 2033
- Table 72: Rest of Middle East & Africa Microporous Silica Boards Volume (K) Forecast, by Application 2020 & 2033
- Table 73: Global Microporous Silica Boards Revenue billion Forecast, by Application 2020 & 2033
- Table 74: Global Microporous Silica Boards Volume K Forecast, by Application 2020 & 2033
- Table 75: Global Microporous Silica Boards Revenue billion Forecast, by Types 2020 & 2033
- Table 76: Global Microporous Silica Boards Volume K Forecast, by Types 2020 & 2033
- Table 77: Global Microporous Silica Boards Revenue billion Forecast, by Country 2020 & 2033
- Table 78: Global Microporous Silica Boards Volume K Forecast, by Country 2020 & 2033
- Table 79: China Microporous Silica Boards Revenue (billion) Forecast, by Application 2020 & 2033
- Table 80: China Microporous Silica Boards Volume (K) Forecast, by Application 2020 & 2033
- Table 81: India Microporous Silica Boards Revenue (billion) Forecast, by Application 2020 & 2033
- Table 82: India Microporous Silica Boards Volume (K) Forecast, by Application 2020 & 2033
- Table 83: Japan Microporous Silica Boards Revenue (billion) Forecast, by Application 2020 & 2033
- Table 84: Japan Microporous Silica Boards Volume (K) Forecast, by Application 2020 & 2033
- Table 85: South Korea Microporous Silica Boards Revenue (billion) Forecast, by Application 2020 & 2033
- Table 86: South Korea Microporous Silica Boards Volume (K) Forecast, by Application 2020 & 2033
- Table 87: ASEAN Microporous Silica Boards Revenue (billion) Forecast, by Application 2020 & 2033
- Table 88: ASEAN Microporous Silica Boards Volume (K) Forecast, by Application 2020 & 2033
- Table 89: Oceania Microporous Silica Boards Revenue (billion) Forecast, by Application 2020 & 2033
- Table 90: Oceania Microporous Silica Boards Volume (K) Forecast, by Application 2020 & 2033
- Table 91: Rest of Asia Pacific Microporous Silica Boards Revenue (billion) Forecast, by Application 2020 & 2033
- Table 92: Rest of Asia Pacific Microporous Silica Boards Volume (K) Forecast, by Application 2020 & 2033
Frequently Asked Questions
1. What is the projected Compound Annual Growth Rate (CAGR) of the Microporous Silica Boards?
The projected CAGR is approximately 13.82%.
2. Which companies are prominent players in the Microporous Silica Boards?
Key companies in the market include Unifrax, Promat, Foundry Service and Supplies, SILICAPRO, Final Advanced Materials, Wedge India, Isoleika, Unicorn Insulations, Thermodyne, Techno Physik Engineering, Johns Manville Corporation, Elmelin, Morgan Advanced Materials.
3. What are the main segments of the Microporous Silica Boards?
The market segments include Application, Types.
4. Can you provide details about the market size?
The market size is estimated to be USD 8.79 billion as of 2022.
5. What are some drivers contributing to market growth?
N/A
6. What are the notable trends driving market growth?
N/A
7. Are there any restraints impacting market growth?
N/A
8. Can you provide examples of recent developments in the market?
N/A
9. What pricing options are available for accessing the report?
Pricing options include single-user, multi-user, and enterprise licenses priced at USD 3950.00, USD 5925.00, and USD 7900.00 respectively.
10. Is the market size provided in terms of value or volume?
The market size is provided in terms of value, measured in billion and volume, measured in K.
11. Are there any specific market keywords associated with the report?
Yes, the market keyword associated with the report is "Microporous Silica Boards," which aids in identifying and referencing the specific market segment covered.
12. How do I determine which pricing option suits my needs best?
The pricing options vary based on user requirements and access needs. Individual users may opt for single-user licenses, while businesses requiring broader access may choose multi-user or enterprise licenses for cost-effective access to the report.
13. Are there any additional resources or data provided in the Microporous Silica Boards report?
While the report offers comprehensive insights, it's advisable to review the specific contents or supplementary materials provided to ascertain if additional resources or data are available.
14. How can I stay updated on further developments or reports in the Microporous Silica Boards?
To stay informed about further developments, trends, and reports in the Microporous Silica Boards, consider subscribing to industry newsletters, following relevant companies and organizations, or regularly checking reputable industry news sources and publications.
Methodology
Step 1 - Identification of Relevant Samples Size from Population Database


Step 2 - Approaches for Defining Global Market Size (Value, Volume* & Price*)

Note*: In applicable scenarios
Step 3 - Data Sources
Primary Research
- Web Analytics
- Survey Reports
- Research Institute
- Latest Research Reports
- Opinion Leaders
Secondary Research
- Annual Reports
- White Paper
- Latest Press Release
- Industry Association
- Paid Database
- Investor Presentations

Step 4 - Data Triangulation
Involves using different sources of information in order to increase the validity of a study
These sources are likely to be stakeholders in a program - participants, other researchers, program staff, other community members, and so on.
Then we put all data in single framework & apply various statistical tools to find out the dynamic on the market.
During the analysis stage, feedback from the stakeholder groups would be compared to determine areas of agreement as well as areas of divergence