

Key Insights
The global Neodymium market is poised for significant expansion, projected to reach a valuation of $21.98 billion by 2025. This robust growth trajectory is underpinned by a compelling Compound Annual Growth Rate (CAGR) of 6.4% throughout the forecast period of 2025-2033. A primary driver of this upward trend is the escalating demand for high-performance magnets, particularly Neodymium-Iron-Boron (NdFeB) magnets, which are indispensable in a wide array of modern technologies. The burgeoning automotive sector, with its increasing adoption of electric vehicles (EVs) and advanced driver-assistance systems (ADAS), is a substantial contributor. Furthermore, the renewable energy sector, especially wind turbines, relies heavily on these powerful magnets for efficient energy generation. The electrical and electronics industry, encompassing everything from smartphones and laptops to advanced medical devices, also represents a consistent and growing demand base. The market's dynamism is further fueled by ongoing technological advancements and innovation in rare earth processing and magnet manufacturing, leading to enhanced performance and new applications.
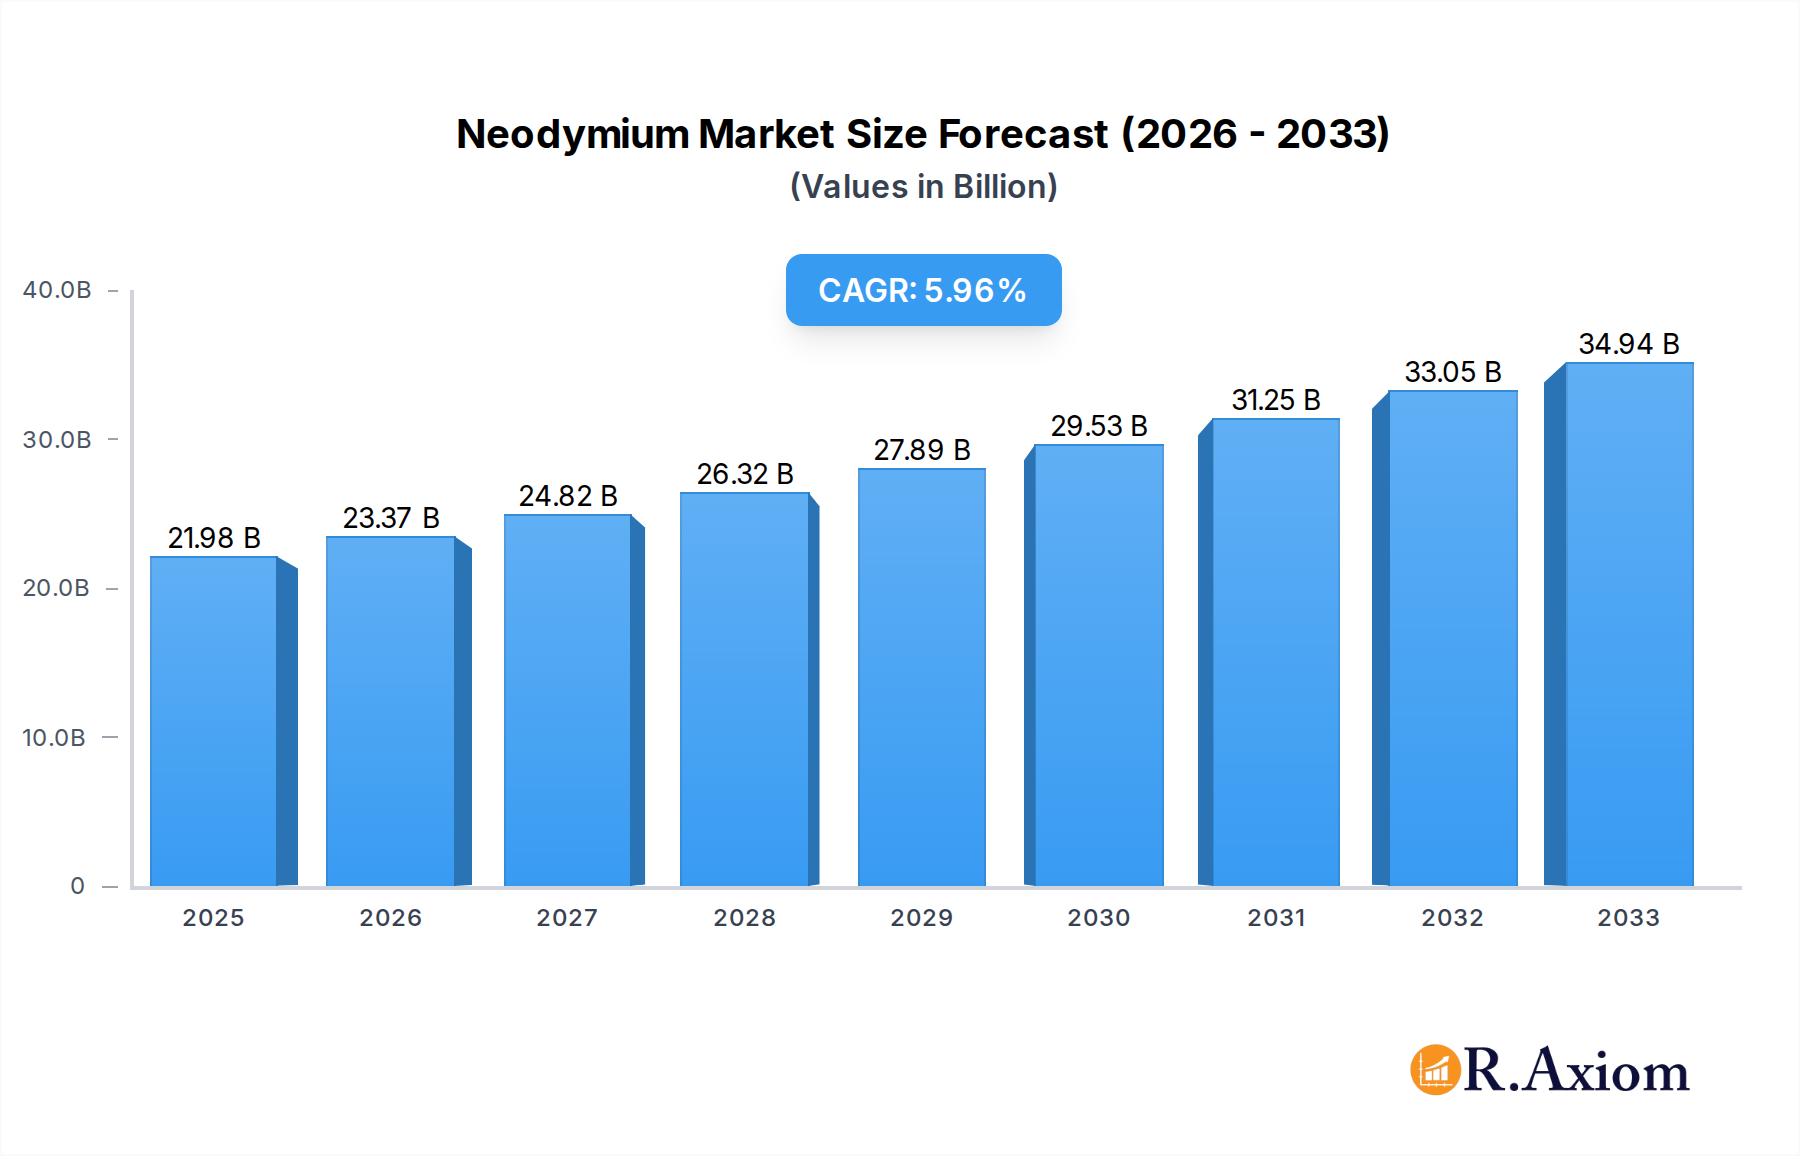
Neodymium Market Market Size (In Billion)
The market's expansion, however, is not without its challenges. Geopolitical factors and supply chain vulnerabilities associated with the concentration of rare earth mining and processing in specific regions can introduce volatility and price fluctuations, acting as a restraint. Nonetheless, strategic initiatives by various nations to diversify supply chains and develop domestic rare earth capabilities are expected to mitigate these risks over the long term. The segmentation of the market by application reveals the dominance of magnets, followed by catalysts, glass and ceramics, and other niche applications. In terms of end-user industries, automotive, electrical and electronics, and wind energy are the leading segments. The Asia Pacific region, particularly China, is anticipated to maintain its dominant position in both production and consumption, driven by its extensive industrial base and significant role in the global rare earth supply chain. Emerging trends include the development of more sustainable and environmentally friendly rare earth extraction and processing methods, as well as the exploration of new applications for Neodymium in advanced materials and technologies.

Neodymium Market Company Market Share
This in-depth report provides a thorough analysis of the global Neodymium market, offering critical insights into its current state, future trajectory, and strategic opportunities. Covering the historical period from 2019-2024 and projecting growth through 2033, with a base and estimated year of 2025, this study is an indispensable resource for stakeholders navigating the complexities of the rare earth elements sector. The report delves into market dynamics, segmentation, key players, technological advancements, and emerging trends, providing actionable intelligence for investors, manufacturers, and policymakers. With an estimated market size expected to reach billions by 2025 and continue its upward trend, understanding the factors driving this growth and the challenges ahead is paramount. The report examines the pivotal role of neodymium in high-tech applications, from electric vehicles and wind turbines to consumer electronics, highlighting its strategic importance in the global transition to a sustainable economy.
Neodymium Market Market Concentration & Innovation
The global Neodymium market is characterized by moderate to high concentration, with a significant portion of production capacity historically centered in China. However, recent geopolitical shifts and a growing emphasis on supply chain diversification are fostering a more distributed landscape. Key players like Lynas Rare Earths Ltd., China Rare Earth Holdings Limited, and MP Materials are at the forefront of expanding production capabilities and exploring novel extraction and processing techniques. Innovation within the Neodymium sector is primarily driven by the relentless demand for higher-performance magnets and advanced materials. This includes advancements in magnet manufacturing for electric vehicles (EVs) and wind turbines, leading to increased energy efficiency and reduced environmental impact. Regulatory frameworks are evolving globally, with governments incentivizing domestic rare earth production and imposing stricter environmental standards. Product substitutes, while limited for high-grade Neodymium-iron-boron (NdFeB) magnets, are being explored in niche applications. End-user trends show a strong preference for sustainable and domestically sourced materials. Mergers and acquisitions (M&A) activity, with deal values in the billions, are expected to continue as companies seek to secure raw material supply and enhance technological capabilities. For instance, the estimated market value of strategic investments and M&A in the rare earth sector is projected to be in the billions by 2025.
- Market Concentration: Moderate to high, with efforts towards diversification.
- Innovation Drivers: Demand for high-performance magnets, energy efficiency, sustainable alternatives.
- Regulatory Frameworks: Increasing focus on domestic production, environmental compliance.
- Product Substitutes: Limited for high-performance applications, but emerging in niche areas.
- End-User Trends: Growing demand for sustainable, traceable, and ethically sourced materials.
- M&A Activities: Significant investment in securing supply chains and technological advancements, with billions projected in deal values.
Neodymium Market Industry Trends & Insights
The Neodymium market is poised for substantial growth, driven by the accelerating global energy transition and the increasing adoption of advanced technologies. The compound annual growth rate (CAGR) is projected to be robust, reaching billions in market value by the forecast period. This expansion is fueled by several key trends. Firstly, the surging demand for electric vehicles is a primary market driver, as Neodymium is a critical component in the powerful permanent magnets used in EV motors. As automotive manufacturers worldwide commit to electrifying their fleets, the demand for Neodymium is set to skyrocket. Secondly, the renewable energy sector, particularly wind energy, represents another significant growth avenue. Large-scale wind turbines rely on Neodymium magnets for efficient power generation, and the global push towards decarbonization is spurring massive investment in wind power infrastructure. Technological disruptions are also shaping the industry. Advancements in magnet recycling and the development of less Neodymium-intensive magnet alloys are emerging, aiming to mitigate supply chain vulnerabilities and reduce costs. However, the inherent scarcity and geopolitical concentration of Neodymium reserves continue to pose challenges. Consumer preferences are increasingly leaning towards products with a lower carbon footprint and transparent supply chains, pushing manufacturers to seek out sustainable sources of rare earth elements. The competitive dynamics are intensifying, with both established players and new entrants vying for market share. Companies are investing heavily in research and development to improve extraction efficiency, reduce environmental impact, and develop proprietary technologies. The overall market penetration of Neodymium in key applications like magnets is expected to deepen significantly. The projected market size for Neodymium is expected to reach billions in the forecast period, reflecting its indispensable role in modern industries.
Dominant Markets & Segments in Neodymium Market
The Neodymium market's dominance is intrinsically linked to the application of its derived compounds, particularly Neodymium-iron-boron (NdFeB) magnets. The Magnets segment is unequivocally the largest and most dominant application, driven by unparalleled demand from the Automotive and Wind Energy end-user industries. The sheer volume of NdFeB magnets required for electric vehicle motors, coupled with the growing size and number of wind turbines globally, positions this segment as the primary growth engine. The Automotive industry's transition towards electrification is a monumental shift, with billions invested in developing and producing EVs, directly translating into a massive uptake of Neodymium. Similarly, the global imperative for renewable energy sources has propelled the Wind Energy sector to unprecedented growth, making it another cornerstone of Neodymium demand, with significant investments in offshore and onshore wind farms driving the need for powerful and efficient generators.
Dominant Application Segment: Magnets.
- Key Drivers: Essential for high-performance NdFeB magnets used in EV motors and wind turbines, driving billions in demand.
- Market Penetration: Deep and expanding, with increasing adoption in advanced motor designs.
Dominant End-User Industry: Automotive and Wind Energy.
- Automotive Drivers: Electric vehicle production ramp-up, government mandates for EV adoption, advancements in motor technology. Billions of dollars are being poured into EV manufacturing.
- Wind Energy Drivers: Global push for renewable energy, expansion of wind power capacity (onshore and offshore), efficiency requirements for generators. Investments are in the billions to meet climate targets.
The Electrical and Electronics sector also represents a significant, albeit secondary, market for Neodymium. This includes its use in consumer electronics such as smartphones, laptops, and hard disk drives, where it contributes to miniaturization and performance enhancement. While the volume per unit may be smaller compared to EVs or wind turbines, the sheer breadth of consumer electronics applications contributes substantially to overall demand, with the sector's overall market value reaching billions. The Glass and Ceramics segment, while less impactful in terms of volume compared to magnets, utilizes Neodymium for its coloring and polishing properties. It finds application in specialized glass for lenses, optical filters, and as a polishing agent for high-precision optics, contributing a consistent, albeit smaller, market share in the billions. The Other Applications segment, encompassing uses in lasers, medical equipment, and industrial catalysts, collectively adds to the diversified demand for Neodymium, further solidifying its strategic importance across multiple industrial verticals.
Neodymium Market Product Developments
Product developments in the Neodymium market are primarily focused on enhancing the performance and sustainability of NdFeB magnets. Innovations aim to increase magnetic strength, improve thermal stability, and reduce the reliance on heavy rare earth elements like dysprosium. Companies are developing advanced manufacturing techniques, such as additive manufacturing (3D printing) of magnets, which allows for complex geometries and customized magnetic field designs, offering significant competitive advantages in specialized applications. Furthermore, research into novel alloys and compositions is yielding magnets with superior coercivity and energy product, crucial for the next generation of high-efficiency electric motors and generators. The development of more efficient recycling processes for spent magnets is also a critical area, aiming to create a closed-loop supply chain and reduce the environmental footprint.
Report Scope & Segmentation Analysis
This report encompasses a comprehensive analysis of the global Neodymium market, meticulously segmented to provide granular insights. The primary segmentation considers the Application of Neodymium and its compounds, including Magnets, Catalysts, Glass and Ceramics, and Other Applications. A detailed examination of each segment's market size, growth projections, and competitive dynamics is provided.
- Magnets: This segment, predominantly Neodymium-iron-boron (NdFeB) magnets, is expected to witness the highest growth, driven by the automotive and wind energy sectors. Market size is projected to reach billions by 2033, with a strong CAGR.
- Catalysts: Neodymium catalysts are used in various industrial processes, including fluid catalytic cracking in petroleum refining. This segment shows steady growth, contributing billions to the overall market.
- Glass and Ceramics: Neodymium is employed for its unique optical properties, such as pink or red coloration in glass and as a polishing agent. This segment offers stable, albeit smaller, market potential in the billions.
- Other Applications: This broad category includes uses in lasers, medical imaging, and specialized alloys, contributing a diverse and growing market share in the billions.
The report also segments the market by End-User Industry, specifically focusing on Automotive, Electrical and Electronics, Wind Energy, and Other End-user Industries. Growth projections and competitive landscapes within these industries are thoroughly analyzed, highlighting the impact of evolving consumer demands and technological advancements on Neodymium consumption. The projected market size for these segments collectively is in the billions.
Key Drivers of Neodymium Market Growth
The Neodymium market's growth trajectory is propelled by several interconnected drivers, predominantly centered around technological advancement and global sustainability initiatives.
- Electric Vehicle (EV) Revolution: The burgeoning EV market is a primary demand driver. Neodymium's crucial role in high-performance permanent magnets for EV motors directly correlates with the exponential growth in EV sales worldwide. Billions are being invested in EV production, creating unprecedented demand.
- Renewable Energy Expansion: The global push for clean energy sources, particularly wind power, necessitates the use of powerful magnets in wind turbines. The expansion of onshore and offshore wind farms, supported by substantial government incentives and climate targets, fuels significant Neodymium consumption, with project values reaching billions.
- Technological Innovation: Continuous innovation in applications requiring high-strength magnets, such as advanced robotics, aerospace, and consumer electronics, contributes to sustained demand. Improved magnetic properties and miniaturization are key benefits derived from Neodymium.
- Supply Chain Diversification Efforts: Geopolitical concerns and a desire for supply security are driving investments in non-Chinese rare earth production, creating new market opportunities and potentially stabilizing prices. These efforts are leading to billions in new project developments.
Challenges in the Neodymium Market Sector
Despite its robust growth prospects, the Neodymium market faces several significant challenges that could impact its expansion and market dynamics.
- Supply Chain Concentration and Geopolitical Risk: The historical dominance of a few countries, particularly China, in Neodymium production and processing creates inherent geopolitical risks and supply chain vulnerabilities. This concentration can lead to price volatility and potential disruptions. The market value affected by these risks is in the billions.
- Environmental Concerns and Regulatory Hurdles: The extraction and processing of rare earth elements, including Neodymium, can be environmentally intensive, leading to stringent regulations and public scrutiny. Obtaining permits and adhering to environmental standards can be costly and time-consuming, potentially slowing down new project developments.
- Price Volatility: Fluctuations in Neodymium prices, driven by supply-demand imbalances and geopolitical factors, can pose challenges for manufacturers and investors. This volatility can impact the profitability of downstream products and the economic viability of new mining operations.
- Limited Substitutability in High-Performance Applications: While efforts are underway to find alternatives, direct substitutes for Neodymium in high-performance NdFeB magnets are scarce, making the market heavily reliant on this specific element.
Emerging Opportunities in Neodymium Market
The Neodymium market is ripe with emerging opportunities driven by technological advancements, evolving consumer preferences, and strategic policy shifts.
- Recycling and Circular Economy: The development of efficient and cost-effective Neodymium magnet recycling technologies presents a significant opportunity to reduce reliance on primary mining, mitigate environmental impacts, and create a more sustainable supply chain. Investments in this area are poised to grow into the billions.
- Emerging Markets and Applications: The expansion of electric mobility in developing economies and the growing adoption of advanced technologies in sectors like robotics, defense, and healthcare are opening up new markets and applications for Neodymium.
- Technological Advancements in Extraction and Processing: Innovations aimed at reducing the environmental footprint and increasing the efficiency of Neodymium extraction and processing can unlock new reserves and make existing operations more economically viable.
- Government Support and Incentives: Increasing government support for domestic rare earth production and critical mineral supply chains, through subsidies, tax incentives, and strategic investments, is creating a favorable environment for market growth.
Leading Players in the Neodymium Market Market
- Lynas Rare Earths Ltd
- China Rare Earth Holdings Limited
- METALL RARE EARTH LIMITED
- MP MATERIALS
- NEO
- Australian Strategic Materials Ltd
- HEFA Rare Earth Canada Co Ltd
- Arafura Resources
- Peak Rare Earths
- Rainbow Rare Earths Limited
Key Developments in Neodymium Market Industry
- February 2023: MP Materials and Sumitomo Corporation entered into an agreement to diversify and strengthen rare earth supplies in Japan. Under the agreement, Sumitomo Corporation becomes the exclusive distributor of neodymium and praseodymium (NdPr) oxide produced by MP Materials, signaling a significant step towards supply chain resilience.
- November 2022: Arafura Resources Limited signed a supply deal with South Korea's Hyundai Motor Co. and its unit Kia Corp. to supply up to 1,500 metric tons of neodymium-praseodymium (NdPr) oxide per year. Under the agreement, the company will supply contract quantities of NdPr oxide over seven years, highlighting strong demand from the automotive sector.
- August 2022: Australia's Lynas Rare Earths Ltd. expanded capacity at its Western Australia-based Mt Weld mine, which has deposits of neodymium (Nd) and praseodymium (Pr). The company anticipated expansion work to begin by early 2023, with full operation planned for 2024, demonstrating efforts to increase global supply.
- July 2022: Arafura Resources Limited and GE Renewable Energy signed a non-binding memorandum of understanding (MoU) to jointly cooperate in the establishment of a sustainable supply chain for neodymium and praseodymium (NdPr), which is central to the energy transition, underscoring the strategic importance of these elements in the renewable energy sector.
Strategic Outlook for Neodymium Market Market
The strategic outlook for the Neodymium market is exceptionally positive, driven by the indispensable role of Neodymium in the global transition towards a sustainable and technologically advanced future. The burgeoning demand from the electric vehicle and renewable energy sectors, projected to reach billions in value, will continue to be the primary growth catalyst. Strategic investments in supply chain diversification, aimed at mitigating geopolitical risks and ensuring stable access to this critical mineral, will shape the market landscape. Furthermore, advancements in recycling technologies and the development of innovative applications will unlock new opportunities and enhance the market's sustainability. Companies that focus on technological innovation, sustainable sourcing, and strategic partnerships will be best positioned to capitalize on the immense growth potential of the Neodymium market, estimated to be in the billions throughout the forecast period.
Neodymium Market Segmentation
-
1. Application
- 1.1. Magnets
- 1.2. Catalysts
- 1.3. Glass and Ceramics
- 1.4. Other Applications
-
2. End-User Industry
- 2.1. Automotive
- 2.2. Electrical and Electronics
- 2.3. Wind Energy
- 2.4. Other End-user Industries
Neodymium Market Segmentation By Geography
-
1. Asia Pacific
- 1.1. China
- 1.2. India
- 1.3. Japan
- 1.4. South Korea
- 1.5. Rest of Asia Pacific
-
2. North America
- 2.1. United States
- 2.2. Canada
- 2.3. Mexico
-
3. Europe
- 3.1. Germany
- 3.2. United Kingdom
- 3.3. Italy
- 3.4. France
- 3.5. Rest of Europe
-
4. South America
- 4.1. Brazil
- 4.2. Argentina
- 4.3. Rest of South America
- 5. Middle East
-
6. Saudi Arabia
- 6.1. South Africa
- 6.2. Rest of Middle East
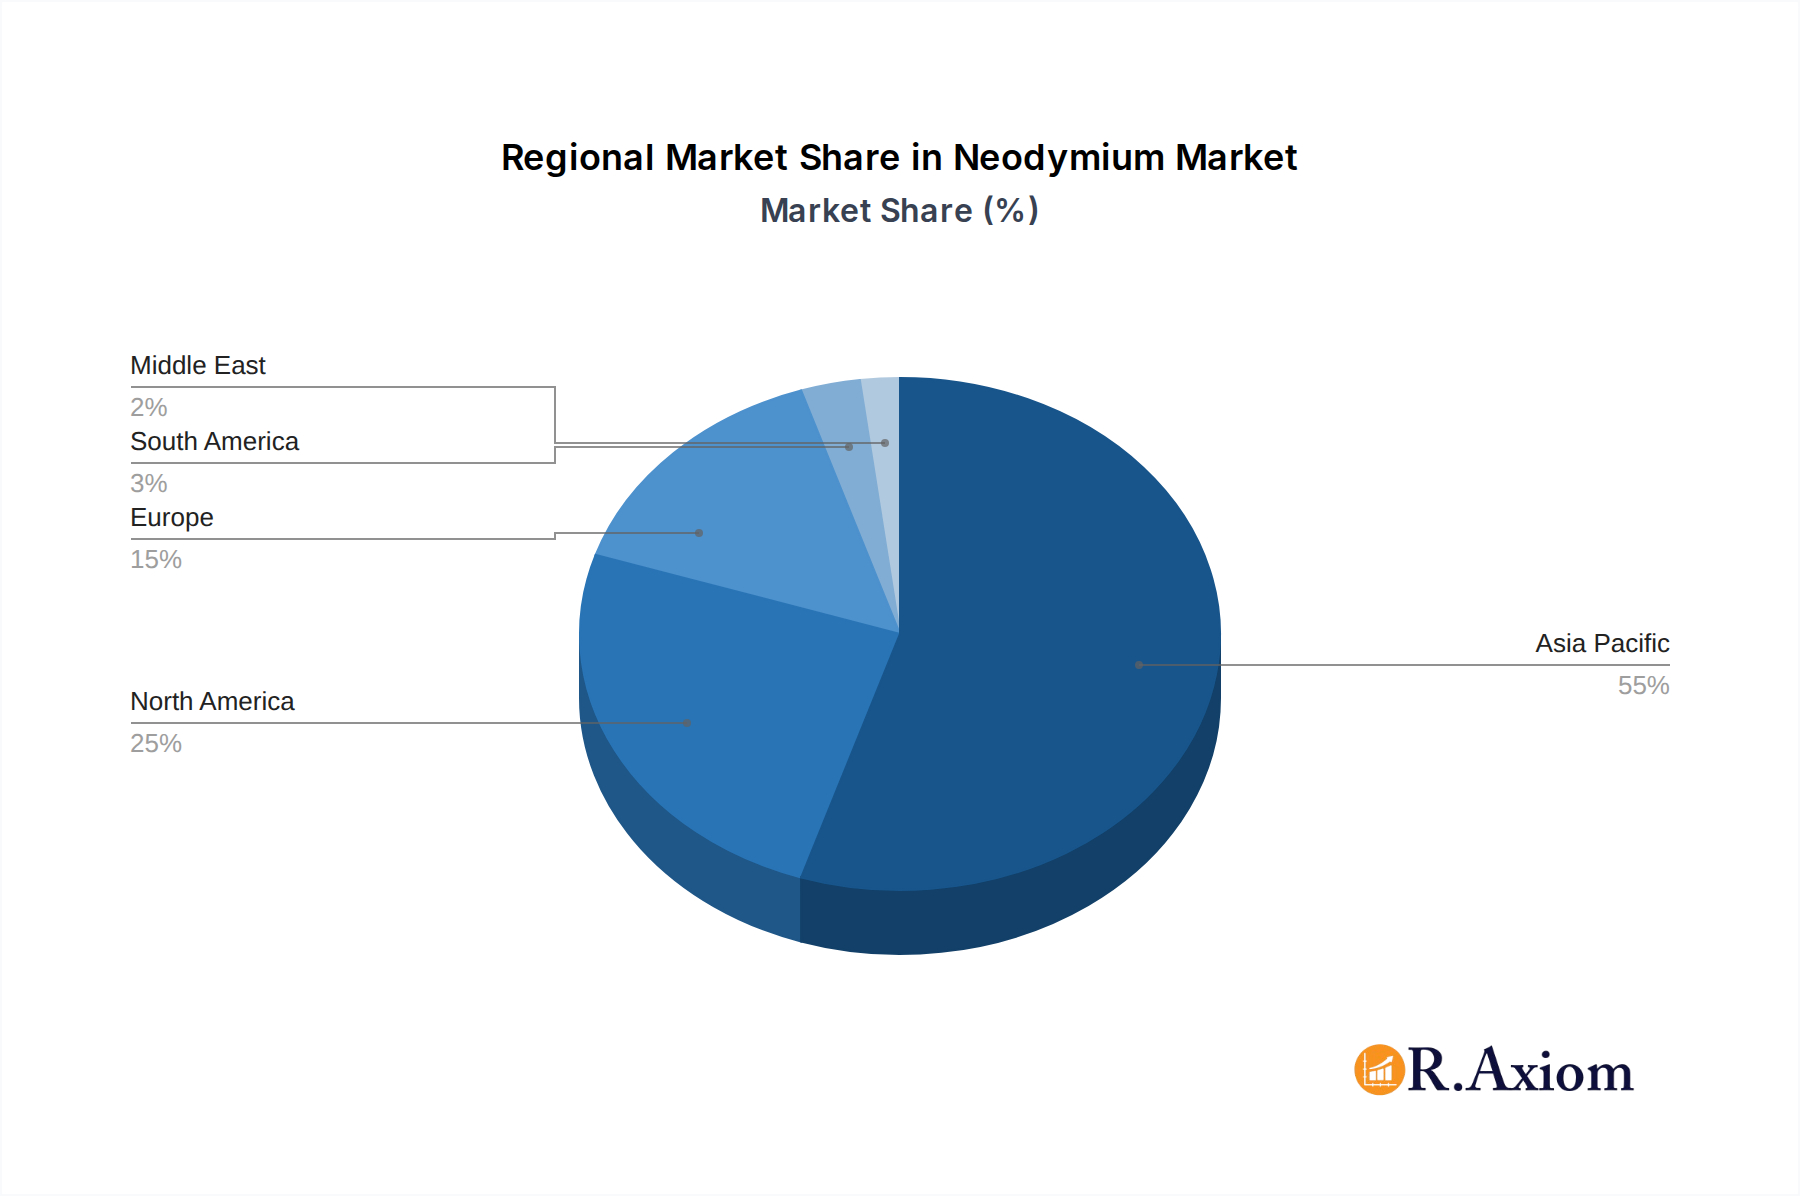
Neodymium Market Regional Market Share
Geographic Coverage of Neodymium Market
Neodymium Market REPORT HIGHLIGHTS
| Aspects | Details |
|---|---|
| Study Period | 2020-2034 |
| Base Year | 2025 |
| Estimated Year | 2026 |
| Forecast Period | 2026-2034 |
| Historical Period | 2020-2025 |
| Growth Rate | CAGR of 6.7% from 2020-2034 |
| Segmentation |
|
Table of Contents
- 1. Introduction
- 1.1. Research Scope
- 1.2. Market Segmentation
- 1.3. Research Objective
- 1.4. Definitions and Assumptions
- 2. Executive Summary
- 2.1. Market Snapshot
- 3. Market Dynamics
- 3.1. Market Drivers
- 3.2. Market Restrains
- 3.3. Market Trends
- 3.4. Market Opportunities
- 4. Market Factor Analysis
- 4.1. Porters Five Forces
- 4.1.1. Bargaining Power of Suppliers
- 4.1.2. Bargaining Power of Buyers
- 4.1.3. Threat of New Entrants
- 4.1.4. Threat of Substitutes
- 4.1.5. Competitive Rivalry
- 4.2. PESTEL analysis
- 4.3. BCG Analysis
- 4.3.1. Stars (High Growth, High Market Share)
- 4.3.2. Cash Cows (Low Growth, High Market Share)
- 4.3.3. Question Mark (High Growth, Low Market Share)
- 4.3.4. Dogs (Low Growth, Low Market Share)
- 4.4. Ansoff Matrix Analysis
- 4.5. Supply Chain Analysis
- 4.6. Regulatory Landscape
- 4.7. Current Market Potential and Opportunity Assessment (TAM–SAM–SOM Framework)
- 4.8. RAX Analyst Note
- 4.1. Porters Five Forces
- 5. Market Analysis, Insights and Forecast 2021-2033
- 5.1. Market Analysis, Insights and Forecast - by Application
- 5.1.1. Magnets
- 5.1.2. Catalysts
- 5.1.3. Glass and Ceramics
- 5.1.4. Other Applications
- 5.2. Market Analysis, Insights and Forecast - by End-User Industry
- 5.2.1. Automotive
- 5.2.2. Electrical and Electronics
- 5.2.3. Wind Energy
- 5.2.4. Other End-user Industries
- 5.3. Market Analysis, Insights and Forecast - by Region
- 5.3.1. Asia Pacific
- 5.3.2. North America
- 5.3.3. Europe
- 5.3.4. South America
- 5.3.5. Middle East
- 5.3.6. Saudi Arabia
- 5.1. Market Analysis, Insights and Forecast - by Application
- 6. Global Neodymium Market Analysis, Insights and Forecast, 2021-2033
- 6.1. Market Analysis, Insights and Forecast - by Application
- 6.1.1. Magnets
- 6.1.2. Catalysts
- 6.1.3. Glass and Ceramics
- 6.1.4. Other Applications
- 6.2. Market Analysis, Insights and Forecast - by End-User Industry
- 6.2.1. Automotive
- 6.2.2. Electrical and Electronics
- 6.2.3. Wind Energy
- 6.2.4. Other End-user Industries
- 6.1. Market Analysis, Insights and Forecast - by Application
- 7. Asia Pacific Neodymium Market Analysis, Insights and Forecast, 2020-2032
- 7.1. Market Analysis, Insights and Forecast - by Application
- 7.1.1. Magnets
- 7.1.2. Catalysts
- 7.1.3. Glass and Ceramics
- 7.1.4. Other Applications
- 7.2. Market Analysis, Insights and Forecast - by End-User Industry
- 7.2.1. Automotive
- 7.2.2. Electrical and Electronics
- 7.2.3. Wind Energy
- 7.2.4. Other End-user Industries
- 7.1. Market Analysis, Insights and Forecast - by Application
- 8. North America Neodymium Market Analysis, Insights and Forecast, 2020-2032
- 8.1. Market Analysis, Insights and Forecast - by Application
- 8.1.1. Magnets
- 8.1.2. Catalysts
- 8.1.3. Glass and Ceramics
- 8.1.4. Other Applications
- 8.2. Market Analysis, Insights and Forecast - by End-User Industry
- 8.2.1. Automotive
- 8.2.2. Electrical and Electronics
- 8.2.3. Wind Energy
- 8.2.4. Other End-user Industries
- 8.1. Market Analysis, Insights and Forecast - by Application
- 9. Europe Neodymium Market Analysis, Insights and Forecast, 2020-2032
- 9.1. Market Analysis, Insights and Forecast - by Application
- 9.1.1. Magnets
- 9.1.2. Catalysts
- 9.1.3. Glass and Ceramics
- 9.1.4. Other Applications
- 9.2. Market Analysis, Insights and Forecast - by End-User Industry
- 9.2.1. Automotive
- 9.2.2. Electrical and Electronics
- 9.2.3. Wind Energy
- 9.2.4. Other End-user Industries
- 9.1. Market Analysis, Insights and Forecast - by Application
- 10. South America Neodymium Market Analysis, Insights and Forecast, 2020-2032
- 10.1. Market Analysis, Insights and Forecast - by Application
- 10.1.1. Magnets
- 10.1.2. Catalysts
- 10.1.3. Glass and Ceramics
- 10.1.4. Other Applications
- 10.2. Market Analysis, Insights and Forecast - by End-User Industry
- 10.2.1. Automotive
- 10.2.2. Electrical and Electronics
- 10.2.3. Wind Energy
- 10.2.4. Other End-user Industries
- 10.1. Market Analysis, Insights and Forecast - by Application
- 11. Middle East Neodymium Market Analysis, Insights and Forecast, 2020-2032
- 11.1. Market Analysis, Insights and Forecast - by Application
- 11.1.1. Magnets
- 11.1.2. Catalysts
- 11.1.3. Glass and Ceramics
- 11.1.4. Other Applications
- 11.2. Market Analysis, Insights and Forecast - by End-User Industry
- 11.2.1. Automotive
- 11.2.2. Electrical and Electronics
- 11.2.3. Wind Energy
- 11.2.4. Other End-user Industries
- 11.1. Market Analysis, Insights and Forecast - by Application
- 12. Saudi Arabia Neodymium Market Analysis, Insights and Forecast, 2020-2032
- 12.1. Market Analysis, Insights and Forecast - by Application
- 12.1.1. Magnets
- 12.1.2. Catalysts
- 12.1.3. Glass and Ceramics
- 12.1.4. Other Applications
- 12.2. Market Analysis, Insights and Forecast - by End-User Industry
- 12.2.1. Automotive
- 12.2.2. Electrical and Electronics
- 12.2.3. Wind Energy
- 12.2.4. Other End-user Industries
- 12.1. Market Analysis, Insights and Forecast - by Application
- 13. Competitive Analysis
- 13.1. Company Profiles
- 13.1.1 Lynas Rare Earths Ltd
- 13.1.1.1. Company Overview
- 13.1.1.2. Products
- 13.1.1.3. Company Financials
- 13.1.1.4. SWOT Analysis
- 13.1.2 China Rare Earth Holdings Limited
- 13.1.2.1. Company Overview
- 13.1.2.2. Products
- 13.1.2.3. Company Financials
- 13.1.2.4. SWOT Analysis
- 13.1.3 METALL RARE EARTH LIMITED
- 13.1.3.1. Company Overview
- 13.1.3.2. Products
- 13.1.3.3. Company Financials
- 13.1.3.4. SWOT Analysis
- 13.1.4 MP MATERIALS
- 13.1.4.1. Company Overview
- 13.1.4.2. Products
- 13.1.4.3. Company Financials
- 13.1.4.4. SWOT Analysis
- 13.1.5 NEO
- 13.1.5.1. Company Overview
- 13.1.5.2. Products
- 13.1.5.3. Company Financials
- 13.1.5.4. SWOT Analysis
- 13.1.6 Australian Strategic Materials Ltd
- 13.1.6.1. Company Overview
- 13.1.6.2. Products
- 13.1.6.3. Company Financials
- 13.1.6.4. SWOT Analysis
- 13.1.7 HEFA Rare Earth Canada Co Ltd
- 13.1.7.1. Company Overview
- 13.1.7.2. Products
- 13.1.7.3. Company Financials
- 13.1.7.4. SWOT Analysis
- 13.1.8 Arafura Resources
- 13.1.8.1. Company Overview
- 13.1.8.2. Products
- 13.1.8.3. Company Financials
- 13.1.8.4. SWOT Analysis
- 13.1.9 Peak Rare Earths
- 13.1.9.1. Company Overview
- 13.1.9.2. Products
- 13.1.9.3. Company Financials
- 13.1.9.4. SWOT Analysis
- 13.1.10 Rainbow Rare Earths Limited
- 13.1.10.1. Company Overview
- 13.1.10.2. Products
- 13.1.10.3. Company Financials
- 13.1.10.4. SWOT Analysis
- 13.1.1 Lynas Rare Earths Ltd
- 13.2. Market Entropy
- 13.2.1 Company's Key Areas Served
- 13.2.2 Recent Developments
- 13.3. Company Market Share Analysis 2025
- 13.3.1 Top 5 Companies Market Share Analysis
- 13.3.2 Top 3 Companies Market Share Analysis
- 13.4. List of Potential Customers
- 14. Research Methodology
List of Figures
- Figure 1: Global Neodymium Market Revenue Breakdown (billion, %) by Region 2025 & 2033
- Figure 2: Global Neodymium Market Volume Breakdown (K Tons, %) by Region 2025 & 2033
- Figure 3: Asia Pacific Neodymium Market Revenue (billion), by Application 2025 & 2033
- Figure 4: Asia Pacific Neodymium Market Volume (K Tons), by Application 2025 & 2033
- Figure 5: Asia Pacific Neodymium Market Revenue Share (%), by Application 2025 & 2033
- Figure 6: Asia Pacific Neodymium Market Volume Share (%), by Application 2025 & 2033
- Figure 7: Asia Pacific Neodymium Market Revenue (billion), by End-User Industry 2025 & 2033
- Figure 8: Asia Pacific Neodymium Market Volume (K Tons), by End-User Industry 2025 & 2033
- Figure 9: Asia Pacific Neodymium Market Revenue Share (%), by End-User Industry 2025 & 2033
- Figure 10: Asia Pacific Neodymium Market Volume Share (%), by End-User Industry 2025 & 2033
- Figure 11: Asia Pacific Neodymium Market Revenue (billion), by Country 2025 & 2033
- Figure 12: Asia Pacific Neodymium Market Volume (K Tons), by Country 2025 & 2033
- Figure 13: Asia Pacific Neodymium Market Revenue Share (%), by Country 2025 & 2033
- Figure 14: Asia Pacific Neodymium Market Volume Share (%), by Country 2025 & 2033
- Figure 15: North America Neodymium Market Revenue (billion), by Application 2025 & 2033
- Figure 16: North America Neodymium Market Volume (K Tons), by Application 2025 & 2033
- Figure 17: North America Neodymium Market Revenue Share (%), by Application 2025 & 2033
- Figure 18: North America Neodymium Market Volume Share (%), by Application 2025 & 2033
- Figure 19: North America Neodymium Market Revenue (billion), by End-User Industry 2025 & 2033
- Figure 20: North America Neodymium Market Volume (K Tons), by End-User Industry 2025 & 2033
- Figure 21: North America Neodymium Market Revenue Share (%), by End-User Industry 2025 & 2033
- Figure 22: North America Neodymium Market Volume Share (%), by End-User Industry 2025 & 2033
- Figure 23: North America Neodymium Market Revenue (billion), by Country 2025 & 2033
- Figure 24: North America Neodymium Market Volume (K Tons), by Country 2025 & 2033
- Figure 25: North America Neodymium Market Revenue Share (%), by Country 2025 & 2033
- Figure 26: North America Neodymium Market Volume Share (%), by Country 2025 & 2033
- Figure 27: Europe Neodymium Market Revenue (billion), by Application 2025 & 2033
- Figure 28: Europe Neodymium Market Volume (K Tons), by Application 2025 & 2033
- Figure 29: Europe Neodymium Market Revenue Share (%), by Application 2025 & 2033
- Figure 30: Europe Neodymium Market Volume Share (%), by Application 2025 & 2033
- Figure 31: Europe Neodymium Market Revenue (billion), by End-User Industry 2025 & 2033
- Figure 32: Europe Neodymium Market Volume (K Tons), by End-User Industry 2025 & 2033
- Figure 33: Europe Neodymium Market Revenue Share (%), by End-User Industry 2025 & 2033
- Figure 34: Europe Neodymium Market Volume Share (%), by End-User Industry 2025 & 2033
- Figure 35: Europe Neodymium Market Revenue (billion), by Country 2025 & 2033
- Figure 36: Europe Neodymium Market Volume (K Tons), by Country 2025 & 2033
- Figure 37: Europe Neodymium Market Revenue Share (%), by Country 2025 & 2033
- Figure 38: Europe Neodymium Market Volume Share (%), by Country 2025 & 2033
- Figure 39: South America Neodymium Market Revenue (billion), by Application 2025 & 2033
- Figure 40: South America Neodymium Market Volume (K Tons), by Application 2025 & 2033
- Figure 41: South America Neodymium Market Revenue Share (%), by Application 2025 & 2033
- Figure 42: South America Neodymium Market Volume Share (%), by Application 2025 & 2033
- Figure 43: South America Neodymium Market Revenue (billion), by End-User Industry 2025 & 2033
- Figure 44: South America Neodymium Market Volume (K Tons), by End-User Industry 2025 & 2033
- Figure 45: South America Neodymium Market Revenue Share (%), by End-User Industry 2025 & 2033
- Figure 46: South America Neodymium Market Volume Share (%), by End-User Industry 2025 & 2033
- Figure 47: South America Neodymium Market Revenue (billion), by Country 2025 & 2033
- Figure 48: South America Neodymium Market Volume (K Tons), by Country 2025 & 2033
- Figure 49: South America Neodymium Market Revenue Share (%), by Country 2025 & 2033
- Figure 50: South America Neodymium Market Volume Share (%), by Country 2025 & 2033
- Figure 51: Middle East Neodymium Market Revenue (billion), by Application 2025 & 2033
- Figure 52: Middle East Neodymium Market Volume (K Tons), by Application 2025 & 2033
- Figure 53: Middle East Neodymium Market Revenue Share (%), by Application 2025 & 2033
- Figure 54: Middle East Neodymium Market Volume Share (%), by Application 2025 & 2033
- Figure 55: Middle East Neodymium Market Revenue (billion), by End-User Industry 2025 & 2033
- Figure 56: Middle East Neodymium Market Volume (K Tons), by End-User Industry 2025 & 2033
- Figure 57: Middle East Neodymium Market Revenue Share (%), by End-User Industry 2025 & 2033
- Figure 58: Middle East Neodymium Market Volume Share (%), by End-User Industry 2025 & 2033
- Figure 59: Middle East Neodymium Market Revenue (billion), by Country 2025 & 2033
- Figure 60: Middle East Neodymium Market Volume (K Tons), by Country 2025 & 2033
- Figure 61: Middle East Neodymium Market Revenue Share (%), by Country 2025 & 2033
- Figure 62: Middle East Neodymium Market Volume Share (%), by Country 2025 & 2033
- Figure 63: Saudi Arabia Neodymium Market Revenue (billion), by Application 2025 & 2033
- Figure 64: Saudi Arabia Neodymium Market Volume (K Tons), by Application 2025 & 2033
- Figure 65: Saudi Arabia Neodymium Market Revenue Share (%), by Application 2025 & 2033
- Figure 66: Saudi Arabia Neodymium Market Volume Share (%), by Application 2025 & 2033
- Figure 67: Saudi Arabia Neodymium Market Revenue (billion), by End-User Industry 2025 & 2033
- Figure 68: Saudi Arabia Neodymium Market Volume (K Tons), by End-User Industry 2025 & 2033
- Figure 69: Saudi Arabia Neodymium Market Revenue Share (%), by End-User Industry 2025 & 2033
- Figure 70: Saudi Arabia Neodymium Market Volume Share (%), by End-User Industry 2025 & 2033
- Figure 71: Saudi Arabia Neodymium Market Revenue (billion), by Country 2025 & 2033
- Figure 72: Saudi Arabia Neodymium Market Volume (K Tons), by Country 2025 & 2033
- Figure 73: Saudi Arabia Neodymium Market Revenue Share (%), by Country 2025 & 2033
- Figure 74: Saudi Arabia Neodymium Market Volume Share (%), by Country 2025 & 2033
List of Tables
- Table 1: Global Neodymium Market Revenue billion Forecast, by Application 2020 & 2033
- Table 2: Global Neodymium Market Volume K Tons Forecast, by Application 2020 & 2033
- Table 3: Global Neodymium Market Revenue billion Forecast, by End-User Industry 2020 & 2033
- Table 4: Global Neodymium Market Volume K Tons Forecast, by End-User Industry 2020 & 2033
- Table 5: Global Neodymium Market Revenue billion Forecast, by Region 2020 & 2033
- Table 6: Global Neodymium Market Volume K Tons Forecast, by Region 2020 & 2033
- Table 7: Global Neodymium Market Revenue billion Forecast, by Application 2020 & 2033
- Table 8: Global Neodymium Market Volume K Tons Forecast, by Application 2020 & 2033
- Table 9: Global Neodymium Market Revenue billion Forecast, by End-User Industry 2020 & 2033
- Table 10: Global Neodymium Market Volume K Tons Forecast, by End-User Industry 2020 & 2033
- Table 11: Global Neodymium Market Revenue billion Forecast, by Country 2020 & 2033
- Table 12: Global Neodymium Market Volume K Tons Forecast, by Country 2020 & 2033
- Table 13: China Neodymium Market Revenue (billion) Forecast, by Application 2020 & 2033
- Table 14: China Neodymium Market Volume (K Tons) Forecast, by Application 2020 & 2033
- Table 15: India Neodymium Market Revenue (billion) Forecast, by Application 2020 & 2033
- Table 16: India Neodymium Market Volume (K Tons) Forecast, by Application 2020 & 2033
- Table 17: Japan Neodymium Market Revenue (billion) Forecast, by Application 2020 & 2033
- Table 18: Japan Neodymium Market Volume (K Tons) Forecast, by Application 2020 & 2033
- Table 19: South Korea Neodymium Market Revenue (billion) Forecast, by Application 2020 & 2033
- Table 20: South Korea Neodymium Market Volume (K Tons) Forecast, by Application 2020 & 2033
- Table 21: Rest of Asia Pacific Neodymium Market Revenue (billion) Forecast, by Application 2020 & 2033
- Table 22: Rest of Asia Pacific Neodymium Market Volume (K Tons) Forecast, by Application 2020 & 2033
- Table 23: Global Neodymium Market Revenue billion Forecast, by Application 2020 & 2033
- Table 24: Global Neodymium Market Volume K Tons Forecast, by Application 2020 & 2033
- Table 25: Global Neodymium Market Revenue billion Forecast, by End-User Industry 2020 & 2033
- Table 26: Global Neodymium Market Volume K Tons Forecast, by End-User Industry 2020 & 2033
- Table 27: Global Neodymium Market Revenue billion Forecast, by Country 2020 & 2033
- Table 28: Global Neodymium Market Volume K Tons Forecast, by Country 2020 & 2033
- Table 29: United States Neodymium Market Revenue (billion) Forecast, by Application 2020 & 2033
- Table 30: United States Neodymium Market Volume (K Tons) Forecast, by Application 2020 & 2033
- Table 31: Canada Neodymium Market Revenue (billion) Forecast, by Application 2020 & 2033
- Table 32: Canada Neodymium Market Volume (K Tons) Forecast, by Application 2020 & 2033
- Table 33: Mexico Neodymium Market Revenue (billion) Forecast, by Application 2020 & 2033
- Table 34: Mexico Neodymium Market Volume (K Tons) Forecast, by Application 2020 & 2033
- Table 35: Global Neodymium Market Revenue billion Forecast, by Application 2020 & 2033
- Table 36: Global Neodymium Market Volume K Tons Forecast, by Application 2020 & 2033
- Table 37: Global Neodymium Market Revenue billion Forecast, by End-User Industry 2020 & 2033
- Table 38: Global Neodymium Market Volume K Tons Forecast, by End-User Industry 2020 & 2033
- Table 39: Global Neodymium Market Revenue billion Forecast, by Country 2020 & 2033
- Table 40: Global Neodymium Market Volume K Tons Forecast, by Country 2020 & 2033
- Table 41: Germany Neodymium Market Revenue (billion) Forecast, by Application 2020 & 2033
- Table 42: Germany Neodymium Market Volume (K Tons) Forecast, by Application 2020 & 2033
- Table 43: United Kingdom Neodymium Market Revenue (billion) Forecast, by Application 2020 & 2033
- Table 44: United Kingdom Neodymium Market Volume (K Tons) Forecast, by Application 2020 & 2033
- Table 45: Italy Neodymium Market Revenue (billion) Forecast, by Application 2020 & 2033
- Table 46: Italy Neodymium Market Volume (K Tons) Forecast, by Application 2020 & 2033
- Table 47: France Neodymium Market Revenue (billion) Forecast, by Application 2020 & 2033
- Table 48: France Neodymium Market Volume (K Tons) Forecast, by Application 2020 & 2033
- Table 49: Rest of Europe Neodymium Market Revenue (billion) Forecast, by Application 2020 & 2033
- Table 50: Rest of Europe Neodymium Market Volume (K Tons) Forecast, by Application 2020 & 2033
- Table 51: Global Neodymium Market Revenue billion Forecast, by Application 2020 & 2033
- Table 52: Global Neodymium Market Volume K Tons Forecast, by Application 2020 & 2033
- Table 53: Global Neodymium Market Revenue billion Forecast, by End-User Industry 2020 & 2033
- Table 54: Global Neodymium Market Volume K Tons Forecast, by End-User Industry 2020 & 2033
- Table 55: Global Neodymium Market Revenue billion Forecast, by Country 2020 & 2033
- Table 56: Global Neodymium Market Volume K Tons Forecast, by Country 2020 & 2033
- Table 57: Brazil Neodymium Market Revenue (billion) Forecast, by Application 2020 & 2033
- Table 58: Brazil Neodymium Market Volume (K Tons) Forecast, by Application 2020 & 2033
- Table 59: Argentina Neodymium Market Revenue (billion) Forecast, by Application 2020 & 2033
- Table 60: Argentina Neodymium Market Volume (K Tons) Forecast, by Application 2020 & 2033
- Table 61: Rest of South America Neodymium Market Revenue (billion) Forecast, by Application 2020 & 2033
- Table 62: Rest of South America Neodymium Market Volume (K Tons) Forecast, by Application 2020 & 2033
- Table 63: Global Neodymium Market Revenue billion Forecast, by Application 2020 & 2033
- Table 64: Global Neodymium Market Volume K Tons Forecast, by Application 2020 & 2033
- Table 65: Global Neodymium Market Revenue billion Forecast, by End-User Industry 2020 & 2033
- Table 66: Global Neodymium Market Volume K Tons Forecast, by End-User Industry 2020 & 2033
- Table 67: Global Neodymium Market Revenue billion Forecast, by Country 2020 & 2033
- Table 68: Global Neodymium Market Volume K Tons Forecast, by Country 2020 & 2033
- Table 69: Global Neodymium Market Revenue billion Forecast, by Application 2020 & 2033
- Table 70: Global Neodymium Market Volume K Tons Forecast, by Application 2020 & 2033
- Table 71: Global Neodymium Market Revenue billion Forecast, by End-User Industry 2020 & 2033
- Table 72: Global Neodymium Market Volume K Tons Forecast, by End-User Industry 2020 & 2033
- Table 73: Global Neodymium Market Revenue billion Forecast, by Country 2020 & 2033
- Table 74: Global Neodymium Market Volume K Tons Forecast, by Country 2020 & 2033
- Table 75: South Africa Neodymium Market Revenue (billion) Forecast, by Application 2020 & 2033
- Table 76: South Africa Neodymium Market Volume (K Tons) Forecast, by Application 2020 & 2033
- Table 77: Rest of Middle East Neodymium Market Revenue (billion) Forecast, by Application 2020 & 2033
- Table 78: Rest of Middle East Neodymium Market Volume (K Tons) Forecast, by Application 2020 & 2033
Frequently Asked Questions
1. What is the projected Compound Annual Growth Rate (CAGR) of the Neodymium Market?
The projected CAGR is approximately 6.7%.
2. Which companies are prominent players in the Neodymium Market?
Key companies in the market include Lynas Rare Earths Ltd, China Rare Earth Holdings Limited, METALL RARE EARTH LIMITED, MP MATERIALS, NEO, Australian Strategic Materials Ltd, HEFA Rare Earth Canada Co Ltd, Arafura Resources, Peak Rare Earths, Rainbow Rare Earths Limited.
3. What are the main segments of the Neodymium Market?
The market segments include Application, End-User Industry.
4. Can you provide details about the market size?
The market size is estimated to be USD 5.28 billion as of 2022.
5. What are some drivers contributing to market growth?
Rising Demand for Neodymium Magnets from Wind Energy and Electric Vehicle Industries; Other Drivers.
6. What are the notable trends driving market growth?
Automotive Segment to Dominate the Market.
7. Are there any restraints impacting market growth?
Availability of Less-Expensive Substitutes; Other Restraints.
8. Can you provide examples of recent developments in the market?
February 2023: MP Materials and Sumitomo Corporation entered into an agreement to diversify and strengthen rare earth supplies in Japan. Under the agreement, Sumitomo Corporation becomes the exclusive distributor of neodymium and praseodymium (NdPr) oxide produced by MP Materials.
9. What pricing options are available for accessing the report?
Pricing options include single-user, multi-user, and enterprise licenses priced at USD 4750, USD 5250, and USD 8750 respectively.
10. Is the market size provided in terms of value or volume?
The market size is provided in terms of value, measured in billion and volume, measured in K Tons.
11. Are there any specific market keywords associated with the report?
Yes, the market keyword associated with the report is "Neodymium Market," which aids in identifying and referencing the specific market segment covered.
12. How do I determine which pricing option suits my needs best?
The pricing options vary based on user requirements and access needs. Individual users may opt for single-user licenses, while businesses requiring broader access may choose multi-user or enterprise licenses for cost-effective access to the report.
13. Are there any additional resources or data provided in the Neodymium Market report?
While the report offers comprehensive insights, it's advisable to review the specific contents or supplementary materials provided to ascertain if additional resources or data are available.
14. How can I stay updated on further developments or reports in the Neodymium Market?
To stay informed about further developments, trends, and reports in the Neodymium Market, consider subscribing to industry newsletters, following relevant companies and organizations, or regularly checking reputable industry news sources and publications.
Methodology
Step 1 - Identification of Relevant Samples Size from Population Database


Step 2 - Approaches for Defining Global Market Size (Value, Volume* & Price*)

Note*: In applicable scenarios
Step 3 - Data Sources
Primary Research
- Web Analytics
- Survey Reports
- Research Institute
- Latest Research Reports
- Opinion Leaders
Secondary Research
- Annual Reports
- White Paper
- Latest Press Release
- Industry Association
- Paid Database
- Investor Presentations

Step 4 - Data Triangulation
Involves using different sources of information in order to increase the validity of a study
These sources are likely to be stakeholders in a program - participants, other researchers, program staff, other community members, and so on.
Then we put all data in single framework & apply various statistical tools to find out the dynamic on the market.
During the analysis stage, feedback from the stakeholder groups would be compared to determine areas of agreement as well as areas of divergence