

Key Insights
The global Slip Additives market is poised for significant expansion, projected to reach $7.09 billion by 2025, driven by an impressive Compound Annual Growth Rate (CAGR) of 15.52%. This robust growth is fueled by escalating demand from the packaging sector, particularly for food and beverages, consumer goods, and healthcare products. The increasing adoption of advanced packaging solutions designed for enhanced product protection, extended shelf life, and improved handling directly translates to a higher requirement for slip additives, which reduce friction between plastic surfaces. Furthermore, the non-packaging applications, encompassing automotive components, textiles, and industrial machinery, are also contributing to market momentum through their need for wear resistance and smooth surface functionalities.
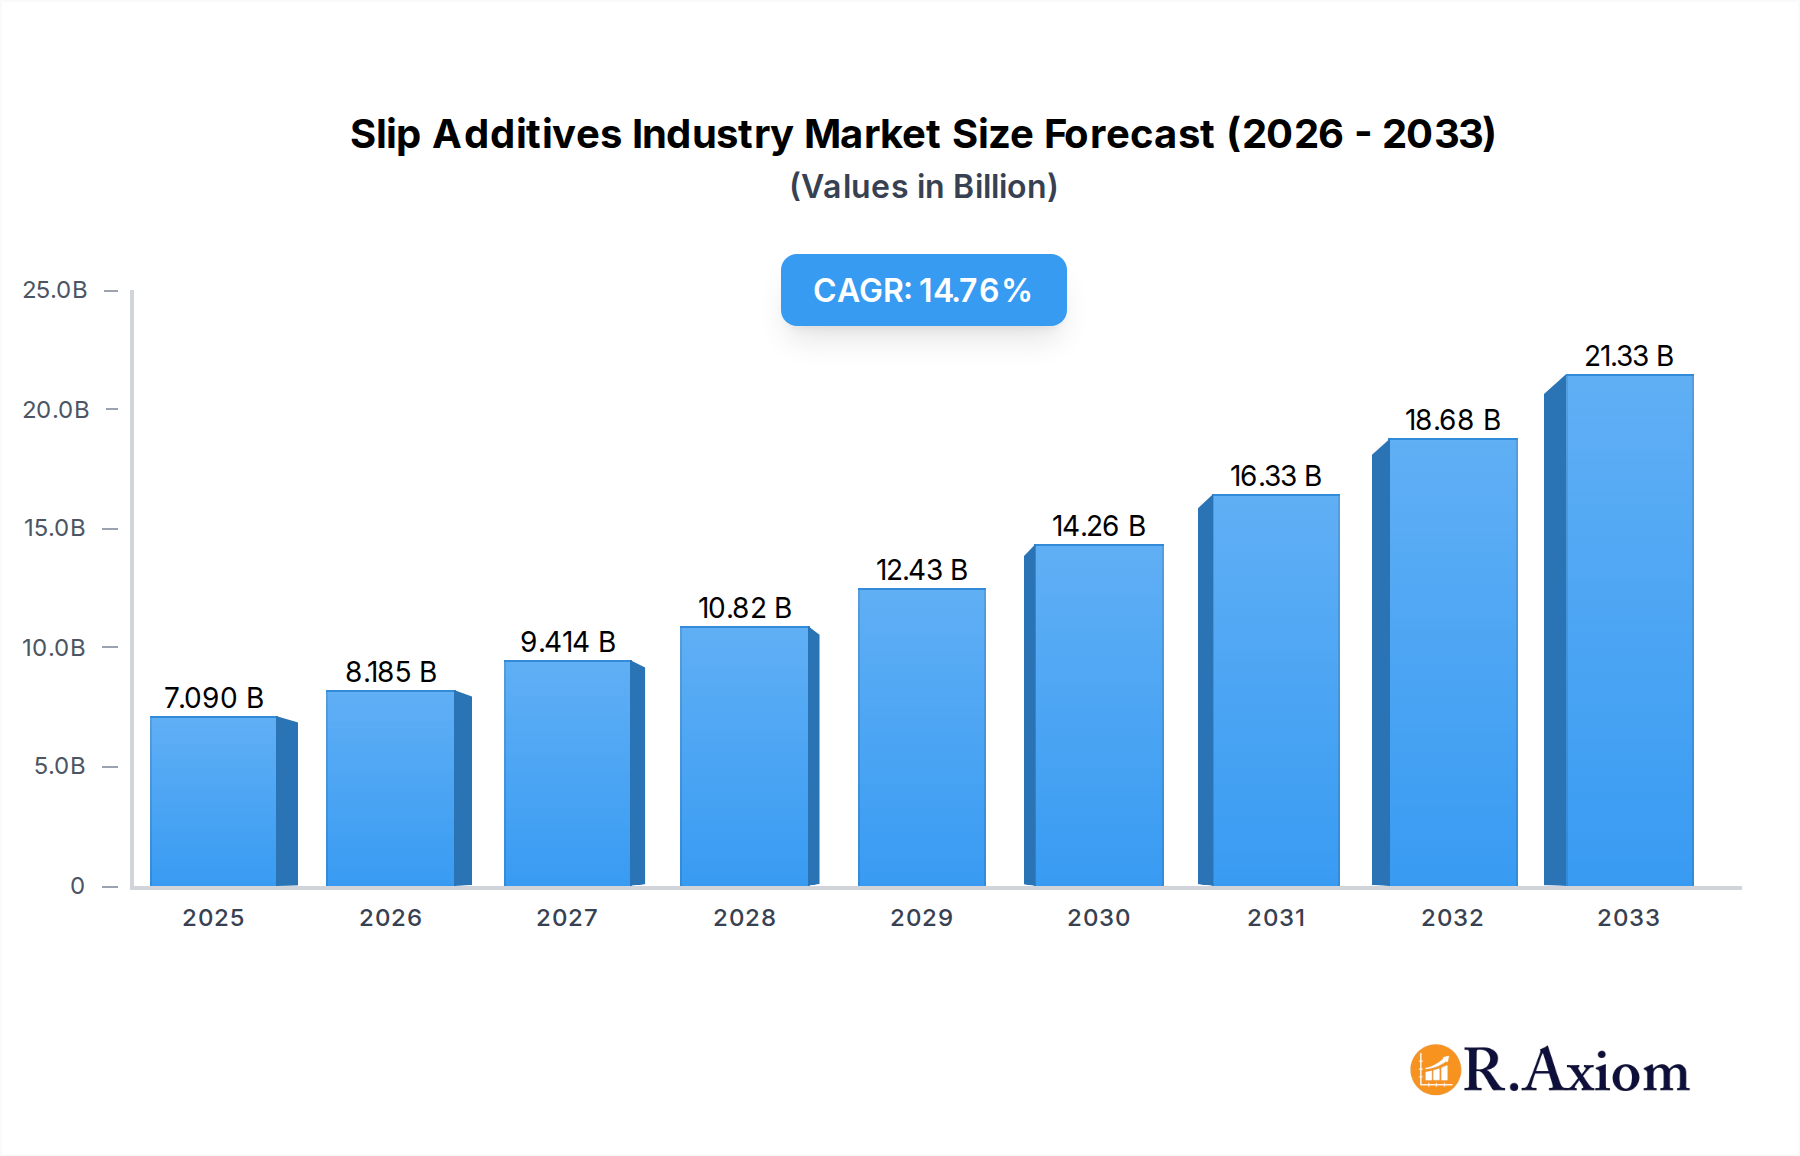
Slip Additives Industry Market Size (In Billion)
Key market drivers include the growing emphasis on sustainable and recyclable packaging materials, where slip additives play a crucial role in processing and end-use performance. Innovations in fatty amides, waxes, and polysiloxanes are leading to more efficient and specialized slip additive solutions, catering to diverse polymer types like polyethylene and polypropylene. Emerging economies, especially in the Asia Pacific region, represent a substantial growth frontier due to rapid industrialization and a burgeoning middle class driving consumer spending. While the market benefits from strong demand, potential restraints could arise from stringent regulatory landscapes concerning the use of certain chemical additives and fluctuations in raw material prices. Despite these challenges, the market's inherent growth trajectory, supported by continuous technological advancements and expanding application areas, indicates a highly promising outlook.

Slip Additives Industry Company Market Share
Global Slip Additives Market Report: Comprehensive Analysis and Forecast (2019-2033)
This in-depth market research report provides a comprehensive analysis of the global Slip Additives market, a critical component in polymer processing that significantly enhances surface lubricity and prevents adhesion. The study spans a detailed historical period (2019-2024), a base year analysis (2025), an estimated year (2025), and a robust forecast period (2025-2033), projecting market trajectory with a projected market value in the billions. With an estimated market size of billions in 2025, the market is poised for substantial growth driven by increasing demand in packaging, automotive, and consumer goods sectors. The report delves into market concentration, key trends, dominant segments, product developments, and strategic outlook, offering actionable insights for stakeholders, including manufacturers, suppliers, formulators, and investors in the slip additives market. High-traffic keywords such as "slip agents," "polymer additives," "anti-block additives," "polymer processing aids," "plastic lubricants," and "film additives" are intricately woven throughout the report to maximize search engine visibility and industry engagement.
Slip Additives Industry Market Concentration & Innovation
The global Slip Additives market exhibits a moderate level of market concentration, with several key players dominating the landscape. Major companies like Fine Organics, PMC Group Inc, Evonik Industries AG, Croda International Inc, BASF SE, and The Lubrizol Corporation hold significant market shares, driving innovation through continuous research and development. Innovation in this sector is primarily fueled by the demand for enhanced processing efficiency, improved product performance, and sustainable solutions. Regulatory frameworks, particularly those concerning food contact materials and environmental safety, also play a crucial role in shaping product development and market entry strategies. The emergence of bio-based and biodegradable slip additives is a testament to this evolving landscape. Product substitutes, while present in the broader additives market, are less direct for specialized slip agent functionalities. End-user trends, especially within the packaging industry's pursuit of thinner, more flexible films with superior slip properties, are significant innovation drivers. Mergers and acquisitions (M&A) activities, with deal values reaching into the billions, have been instrumental in consolidating market share and expanding product portfolios. For instance, recent M&A activities indicate a strategic consolidation aimed at capturing emerging market opportunities and enhancing technological capabilities.
Slip Additives Industry Industry Trends & Insights
The Slip Additives market is experiencing robust growth, projected to expand at a significant Compound Annual Growth Rate (CAGR) of xx% from 2025 to 2033, reflecting a market value projected to reach billions. This growth is primarily propelled by the escalating demand for enhanced polymer processing capabilities across a diverse range of applications, most notably in the packaging sector, which accounts for a substantial portion of market penetration. The increasing consumption of flexible packaging, driven by consumer convenience and the need for efficient material usage, directly translates to a higher demand for effective slip agents. Furthermore, advancements in polymer science and processing technologies are creating new avenues for slip additive utilization, enabling the production of thinner, stronger, and more durable plastic films and components. Technological disruptions, such as the development of novel additive formulations with improved performance at lower concentrations and enhanced compatibility with a wider array of polymers, are reshaping the competitive landscape. Consumer preferences for sustainable and eco-friendly packaging solutions are also influencing product development, with a growing emphasis on slip additives derived from renewable resources and those that contribute to recyclability. The competitive dynamics are characterized by intense R&D efforts, strategic partnerships, and a focus on providing tailored solutions to meet specific end-user requirements. The market penetration of specialized slip additives is also on the rise as manufacturers recognize their critical role in achieving desired product characteristics and optimizing production costs.
Dominant Markets & Segments in Slip Additives Industry
The Slip Additives industry demonstrates significant dominance across various geographical regions and product segments. North America and Europe currently lead the market, driven by sophisticated manufacturing bases and stringent quality standards, with projected market values in the billions. The Asia-Pacific region, however, is emerging as the fastest-growing market due to rapid industrialization, expanding packaging industries, and increasing per capita consumption of plastic products, with significant growth anticipated in countries like China and India.
Carrier Resin Dominance:
- Polyethylene (PE): This segment holds the largest market share due to the widespread use of PE in films, bags, and containers, which heavily rely on slip additives for processing and performance. The demand for PE films in food and beverage packaging, particularly in emerging economies, is a key driver.
- Polypropylene (PP): PP, another major commodity plastic, also contributes significantly to the slip additives market, especially in applications requiring good clarity and stiffness, such as in rigid packaging and textiles.
- Other Carrier Resins: While smaller in volume, specialized applications in engineering plastics and other polymers are also contributing to the growth of this segment.
Type Dominance:
- Fatty Amides: This category, including erucamide and oleamide, remains the dominant type of slip additive owing to their cost-effectiveness and proven performance in enhancing slip and anti-block properties in polyolefins. Their widespread adoption in flexible packaging applications underscores their market supremacy.
- Waxes and Polysiloxanes: These types are gaining traction due to their superior performance characteristics, such as higher temperature resistance and improved clarity. Polysiloxanes, in particular, offer excellent slip and are increasingly used in demanding applications.
- Other Types (Esters, Salts, etc.): This segment represents niche applications and emerging additive chemistries that cater to specific performance requirements, contributing to the overall diversification of the market.
Application Dominance:
- Packaging: This is by far the largest application segment, with sub-segments showing varied dominance.
- Food and Beverage Packaging: Dominates due to the massive volume of flexible films and containers used for food preservation and consumer appeal, requiring excellent slip for easy opening and stacking.
- Consumer Goods Packaging: Significant demand from applications like detergent bags, personal care product packaging, and retail bags.
- Healthcare Packaging: Growing demand for specialized films and components requiring regulatory compliance and high-performance slip properties.
- Non-Packaging: This segment encompasses automotive components, consumer electronics, textiles, and industrial applications, showcasing consistent growth as manufacturers seek improved material handling and surface properties.
Slip Additives Industry Product Developments
Product development in the Slip Additives industry is intensely focused on enhancing performance and sustainability. Innovations are geared towards creating additives with lower migration rates for food contact applications, improved thermal stability for higher processing temperatures, and increased efficiency at lower dosages. Companies are also investing in bio-based and biodegradable slip additives to meet growing environmental concerns. These developments provide competitive advantages by enabling manufacturers to offer differentiated products that meet stringent regulatory requirements and evolving consumer demands for eco-friendly materials. Technological trends are leading to multifunctional additives that offer combined slip, anti-block, and anti-static properties.
Report Scope & Segmentation Analysis
The global Slip Additives market is meticulously segmented to provide a granular understanding of its dynamics. The segmentation includes Carrier Resin (Polyethylene, Polypropylene, Other Carrier Resins), Type (Fatty Amides, Waxes and Polysiloxanes, Other Types like Esters and Salts), and Application (Packaging – including Food and Beverage, Consumer Goods, Healthcare – and Non-Packaging). This comprehensive segmentation allows for detailed analysis of market sizes, growth projections for each segment, and the competitive landscape within each category. For instance, the Polyethylene segment is projected to witness a market size of billions by 2033, driven by its extensive use in films and bags. The Fatty Amides segment is expected to maintain its dominance in the forecast period.
Key Drivers of Slip Additives Industry Growth
The Slip Additives market is propelled by several key drivers, including the burgeoning demand from the global packaging industry, particularly for flexible and food-grade packaging solutions. Advancements in polymer processing technologies, enabling higher extrusion speeds and improved film quality, directly necessitate advanced slip agent formulations. The increasing use of plastics in automotive interiors, consumer electronics, and medical devices further fuels demand for specialized slip additives that enhance durability and aesthetic appeal. Furthermore, regulatory mandates for improved product safety and environmental sustainability are driving innovation towards low-migration and bio-based slip additives.
Challenges in the Slip Additives Industry Sector
Despite the robust growth, the Slip Additives industry faces several challenges. Fluctuations in raw material prices, particularly for fatty acids and derivatives, can impact production costs and profit margins. Stringent regulatory requirements for food contact materials and environmental compliance necessitate significant investment in R&D and product reformulation. The threat of regulatory changes or outright bans on certain additive chemistries also poses a risk. Furthermore, intense competition among established players and the emergence of new entrants can lead to price pressures and market fragmentation. Supply chain disruptions, as witnessed in recent global events, can also impede the timely availability of raw materials and finished products, impacting market stability.
Emerging Opportunities in Slip Additives Industry
Emerging opportunities in the Slip Additives industry are centered around the growing demand for sustainable and bio-based slip agents, driven by increasing environmental consciousness and stringent regulations. The expansion of the e-commerce sector, leading to a surge in demand for protective and flexible packaging, presents significant growth prospects. Advancements in additive technology, such as the development of high-performance, multifunctional additives that offer combined slip, anti-block, and anti-static properties, are creating new market niches. Furthermore, the increasing adoption of plastics in emerging economies, particularly in the automotive, construction, and consumer goods sectors, offers substantial untapped potential for slip additive manufacturers.
Leading Players in the Slip Additives Industry Market
- Fine Organics
- PMC Group Inc
- Evonik Industries AG
- Croda International Inc
- Afron
- Emery Oleochemicals
- ALTANA
- BASF SE
- Honeywell International
- The Lubrizol Corporation
- Lonza
Key Developments in Slip Additives Industry Industry
- 2023/2024: Major players are focusing on expanding their product portfolios with sustainable and bio-based slip additives to meet growing environmental regulations and consumer demand.
- 2022/2023: Several companies have announced strategic partnerships or acquisitions aimed at strengthening their market presence in high-growth regions like Asia-Pacific and enhancing their R&D capabilities for advanced additive formulations.
- 2021/2022: Introduction of novel slip additives with improved thermal stability and lower migration rates, catering to stringent requirements in food packaging and high-temperature polymer processing.
- 2020/2021: Increased investment in capacity expansion and technological upgrades to meet the rising demand for slip additives in the flexible packaging and consumer goods sectors.
Strategic Outlook for Slip Additives Industry Market
The strategic outlook for the Slip Additives market remains exceptionally positive, with sustained growth expected to continue through the forecast period. Key growth catalysts include the increasing global demand for flexible packaging, driven by evolving consumer lifestyles and the need for efficient product protection. The ongoing innovation in polymer science and processing technologies will continue to create opportunities for advanced slip additive solutions. Furthermore, the growing emphasis on sustainability and the development of eco-friendly alternatives will shape future product development and market strategies. Companies that focus on R&D, strategic partnerships, and expanding their reach into emerging markets are well-positioned to capitalize on the significant opportunities within this dynamic industry. The projected market value reaching billions underscores the long-term potential and strategic importance of slip additives in the global materials landscape.
Slip Additives Industry Segmentation
-
1. Carrier Resin
- 1.1. Polyethylene
- 1.2. Polypropylene
- 1.3. Other Ca
-
2. Type
- 2.1. Fatty Amides
- 2.2. Waxes and Polysiloxanes
- 2.3. Other Types (Esters, Salts, etc.)
-
3. Application
-
3.1. Packaging
- 3.1.1. Food and Beverage
- 3.1.2. Consumer Goods
- 3.1.3. Healthcare
- 3.2. Non-Packaging
-
3.1. Packaging
Slip Additives Industry Segmentation By Geography
-
1. Asia Pacific
- 1.1. China
- 1.2. India
- 1.3. Japan
- 1.4. South Korea
- 1.5. Rest of Asia Pacific
-
2. North America
- 2.1. United States
- 2.2. Canada
- 2.3. Mexico
-
3. Europe
- 3.1. Germany
- 3.2. United Kingdom
- 3.3. Italy
- 3.4. France
- 3.5. Rest of Europe
-
4. South America
- 4.1. Brazil
- 4.2. Argentina
- 4.3. Rest of South America
-
5. Middle East and Africa
- 5.1. Saudi Arabia
- 5.2. South Africa
- 5.3. Rest of Middle East and Africa
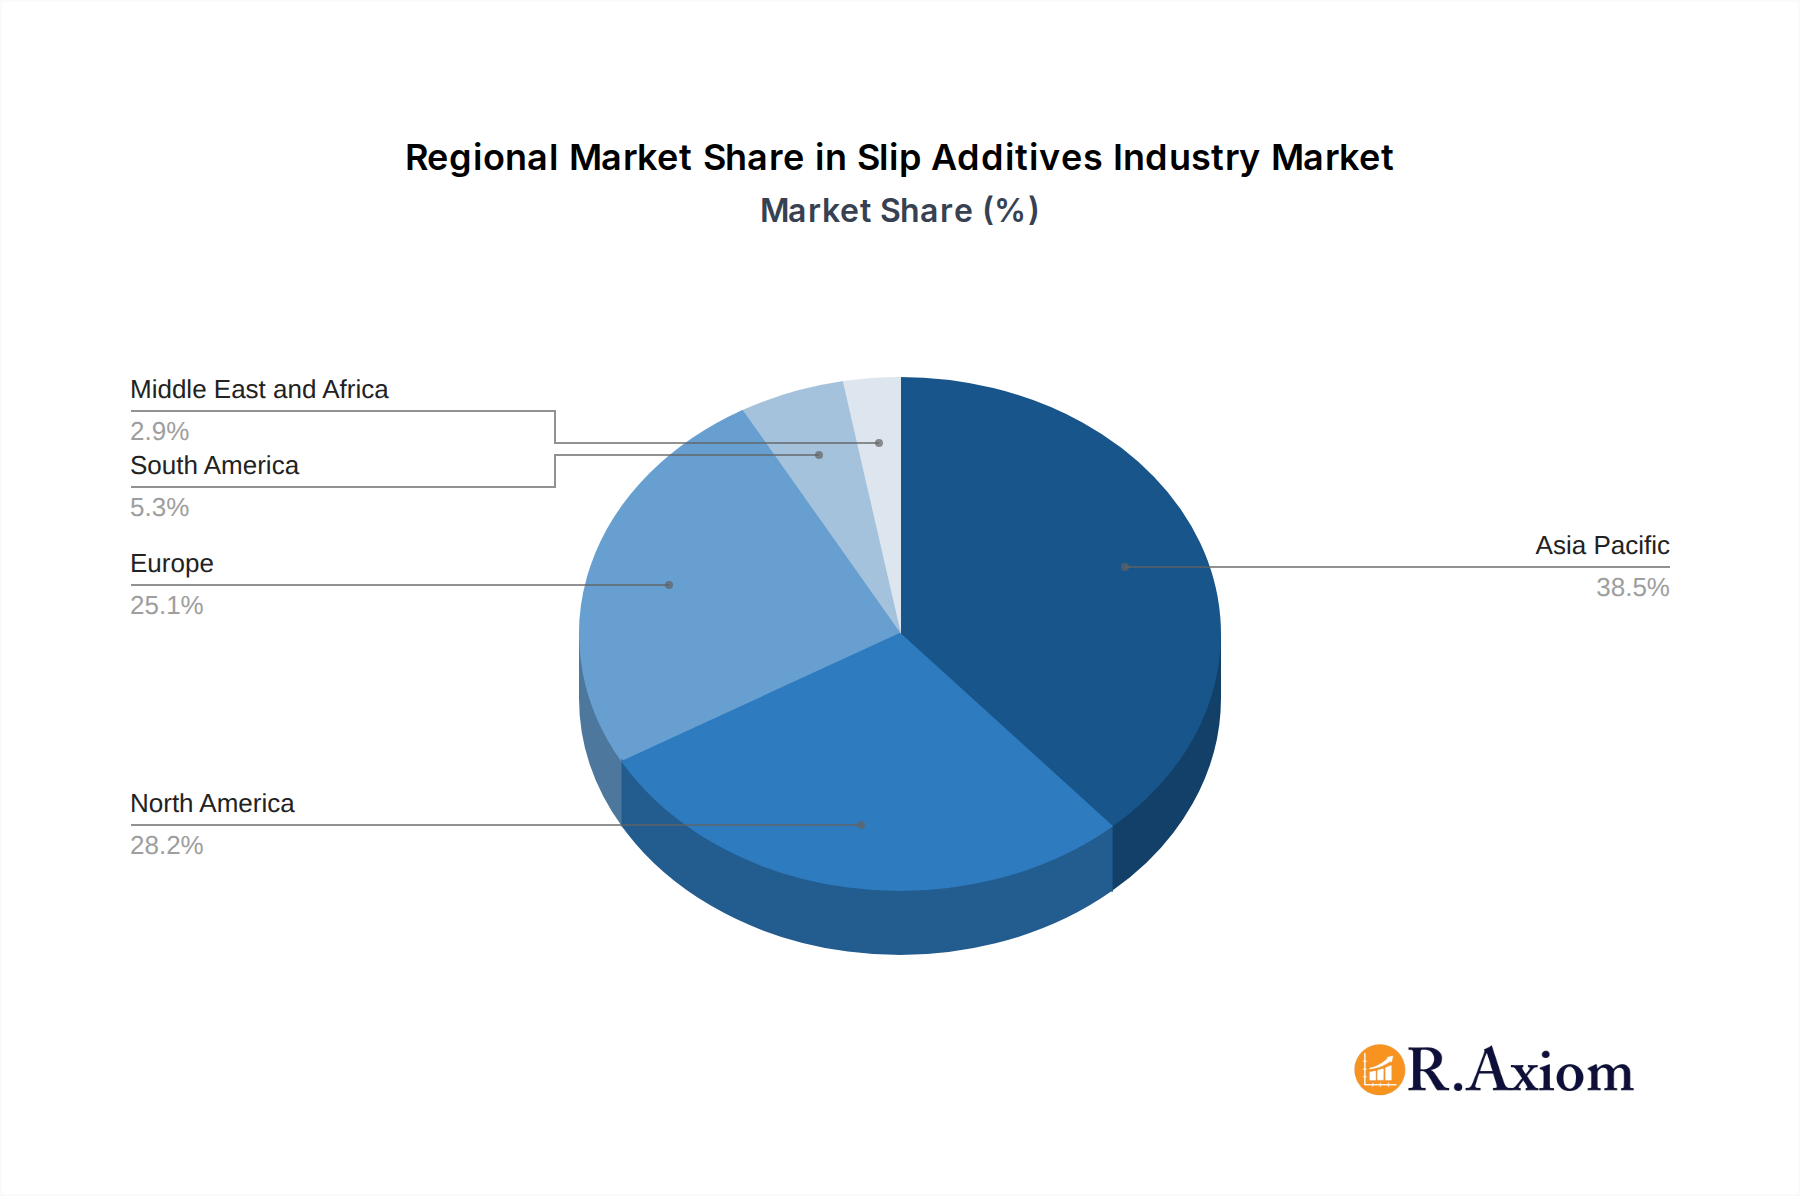
Slip Additives Industry Regional Market Share
Geographic Coverage of Slip Additives Industry
Slip Additives Industry REPORT HIGHLIGHTS
| Aspects | Details |
|---|---|
| Study Period | 2020-2034 |
| Base Year | 2025 |
| Estimated Year | 2026 |
| Forecast Period | 2026-2034 |
| Historical Period | 2020-2025 |
| Growth Rate | CAGR of 5.04% from 2020-2034 |
| Segmentation |
|
Table of Contents
- 1. Introduction
- 1.1. Research Scope
- 1.2. Market Segmentation
- 1.3. Research Objective
- 1.4. Definitions and Assumptions
- 2. Executive Summary
- 2.1. Market Snapshot
- 3. Market Dynamics
- 3.1. Market Drivers
- 3.2. Market Restrains
- 3.3. Market Trends
- 3.4. Market Opportunities
- 4. Market Factor Analysis
- 4.1. Porters Five Forces
- 4.1.1. Bargaining Power of Suppliers
- 4.1.2. Bargaining Power of Buyers
- 4.1.3. Threat of New Entrants
- 4.1.4. Threat of Substitutes
- 4.1.5. Competitive Rivalry
- 4.2. PESTEL analysis
- 4.3. BCG Analysis
- 4.3.1. Stars (High Growth, High Market Share)
- 4.3.2. Cash Cows (Low Growth, High Market Share)
- 4.3.3. Question Mark (High Growth, Low Market Share)
- 4.3.4. Dogs (Low Growth, Low Market Share)
- 4.4. Ansoff Matrix Analysis
- 4.5. Supply Chain Analysis
- 4.6. Regulatory Landscape
- 4.7. Current Market Potential and Opportunity Assessment (TAM–SAM–SOM Framework)
- 4.8. RAX Analyst Note
- 4.1. Porters Five Forces
- 5. Market Analysis, Insights and Forecast 2021-2033
- 5.1. Market Analysis, Insights and Forecast - by Carrier Resin
- 5.1.1. Polyethylene
- 5.1.2. Polypropylene
- 5.1.3. Other Ca
- 5.2. Market Analysis, Insights and Forecast - by Type
- 5.2.1. Fatty Amides
- 5.2.2. Waxes and Polysiloxanes
- 5.2.3. Other Types (Esters, Salts, etc.)
- 5.3. Market Analysis, Insights and Forecast - by Application
- 5.3.1. Packaging
- 5.3.1.1. Food and Beverage
- 5.3.1.2. Consumer Goods
- 5.3.1.3. Healthcare
- 5.3.2. Non-Packaging
- 5.3.1. Packaging
- 5.4. Market Analysis, Insights and Forecast - by Region
- 5.4.1. Asia Pacific
- 5.4.2. North America
- 5.4.3. Europe
- 5.4.4. South America
- 5.4.5. Middle East and Africa
- 5.1. Market Analysis, Insights and Forecast - by Carrier Resin
- 6. Global Slip Additives Industry Analysis, Insights and Forecast, 2021-2033
- 6.1. Market Analysis, Insights and Forecast - by Carrier Resin
- 6.1.1. Polyethylene
- 6.1.2. Polypropylene
- 6.1.3. Other Ca
- 6.2. Market Analysis, Insights and Forecast - by Type
- 6.2.1. Fatty Amides
- 6.2.2. Waxes and Polysiloxanes
- 6.2.3. Other Types (Esters, Salts, etc.)
- 6.3. Market Analysis, Insights and Forecast - by Application
- 6.3.1. Packaging
- 6.3.1.1. Food and Beverage
- 6.3.1.2. Consumer Goods
- 6.3.1.3. Healthcare
- 6.3.2. Non-Packaging
- 6.3.1. Packaging
- 6.1. Market Analysis, Insights and Forecast - by Carrier Resin
- 7. Asia Pacific Slip Additives Industry Analysis, Insights and Forecast, 2020-2032
- 7.1. Market Analysis, Insights and Forecast - by Carrier Resin
- 7.1.1. Polyethylene
- 7.1.2. Polypropylene
- 7.1.3. Other Ca
- 7.2. Market Analysis, Insights and Forecast - by Type
- 7.2.1. Fatty Amides
- 7.2.2. Waxes and Polysiloxanes
- 7.2.3. Other Types (Esters, Salts, etc.)
- 7.3. Market Analysis, Insights and Forecast - by Application
- 7.3.1. Packaging
- 7.3.1.1. Food and Beverage
- 7.3.1.2. Consumer Goods
- 7.3.1.3. Healthcare
- 7.3.2. Non-Packaging
- 7.3.1. Packaging
- 7.1. Market Analysis, Insights and Forecast - by Carrier Resin
- 8. North America Slip Additives Industry Analysis, Insights and Forecast, 2020-2032
- 8.1. Market Analysis, Insights and Forecast - by Carrier Resin
- 8.1.1. Polyethylene
- 8.1.2. Polypropylene
- 8.1.3. Other Ca
- 8.2. Market Analysis, Insights and Forecast - by Type
- 8.2.1. Fatty Amides
- 8.2.2. Waxes and Polysiloxanes
- 8.2.3. Other Types (Esters, Salts, etc.)
- 8.3. Market Analysis, Insights and Forecast - by Application
- 8.3.1. Packaging
- 8.3.1.1. Food and Beverage
- 8.3.1.2. Consumer Goods
- 8.3.1.3. Healthcare
- 8.3.2. Non-Packaging
- 8.3.1. Packaging
- 8.1. Market Analysis, Insights and Forecast - by Carrier Resin
- 9. Europe Slip Additives Industry Analysis, Insights and Forecast, 2020-2032
- 9.1. Market Analysis, Insights and Forecast - by Carrier Resin
- 9.1.1. Polyethylene
- 9.1.2. Polypropylene
- 9.1.3. Other Ca
- 9.2. Market Analysis, Insights and Forecast - by Type
- 9.2.1. Fatty Amides
- 9.2.2. Waxes and Polysiloxanes
- 9.2.3. Other Types (Esters, Salts, etc.)
- 9.3. Market Analysis, Insights and Forecast - by Application
- 9.3.1. Packaging
- 9.3.1.1. Food and Beverage
- 9.3.1.2. Consumer Goods
- 9.3.1.3. Healthcare
- 9.3.2. Non-Packaging
- 9.3.1. Packaging
- 9.1. Market Analysis, Insights and Forecast - by Carrier Resin
- 10. South America Slip Additives Industry Analysis, Insights and Forecast, 2020-2032
- 10.1. Market Analysis, Insights and Forecast - by Carrier Resin
- 10.1.1. Polyethylene
- 10.1.2. Polypropylene
- 10.1.3. Other Ca
- 10.2. Market Analysis, Insights and Forecast - by Type
- 10.2.1. Fatty Amides
- 10.2.2. Waxes and Polysiloxanes
- 10.2.3. Other Types (Esters, Salts, etc.)
- 10.3. Market Analysis, Insights and Forecast - by Application
- 10.3.1. Packaging
- 10.3.1.1. Food and Beverage
- 10.3.1.2. Consumer Goods
- 10.3.1.3. Healthcare
- 10.3.2. Non-Packaging
- 10.3.1. Packaging
- 10.1. Market Analysis, Insights and Forecast - by Carrier Resin
- 11. Middle East and Africa Slip Additives Industry Analysis, Insights and Forecast, 2020-2032
- 11.1. Market Analysis, Insights and Forecast - by Carrier Resin
- 11.1.1. Polyethylene
- 11.1.2. Polypropylene
- 11.1.3. Other Ca
- 11.2. Market Analysis, Insights and Forecast - by Type
- 11.2.1. Fatty Amides
- 11.2.2. Waxes and Polysiloxanes
- 11.2.3. Other Types (Esters, Salts, etc.)
- 11.3. Market Analysis, Insights and Forecast - by Application
- 11.3.1. Packaging
- 11.3.1.1. Food and Beverage
- 11.3.1.2. Consumer Goods
- 11.3.1.3. Healthcare
- 11.3.2. Non-Packaging
- 11.3.1. Packaging
- 11.1. Market Analysis, Insights and Forecast - by Carrier Resin
- 12. Competitive Analysis
- 12.1. Company Profiles
- 12.1.1 Fine Organics
- 12.1.1.1. Company Overview
- 12.1.1.2. Products
- 12.1.1.3. Company Financials
- 12.1.1.4. SWOT Analysis
- 12.1.2 PMC Group Inc *List Not Exhaustive
- 12.1.2.1. Company Overview
- 12.1.2.2. Products
- 12.1.2.3. Company Financials
- 12.1.2.4. SWOT Analysis
- 12.1.3 Evonik Industries AG
- 12.1.3.1. Company Overview
- 12.1.3.2. Products
- 12.1.3.3. Company Financials
- 12.1.3.4. SWOT Analysis
- 12.1.4 Croda International Inc
- 12.1.4.1. Company Overview
- 12.1.4.2. Products
- 12.1.4.3. Company Financials
- 12.1.4.4. SWOT Analysis
- 12.1.5 Afron
- 12.1.5.1. Company Overview
- 12.1.5.2. Products
- 12.1.5.3. Company Financials
- 12.1.5.4. SWOT Analysis
- 12.1.6 Emery Oleochemicals
- 12.1.6.1. Company Overview
- 12.1.6.2. Products
- 12.1.6.3. Company Financials
- 12.1.6.4. SWOT Analysis
- 12.1.7 ALTANA
- 12.1.7.1. Company Overview
- 12.1.7.2. Products
- 12.1.7.3. Company Financials
- 12.1.7.4. SWOT Analysis
- 12.1.8 BASF SE
- 12.1.8.1. Company Overview
- 12.1.8.2. Products
- 12.1.8.3. Company Financials
- 12.1.8.4. SWOT Analysis
- 12.1.9 Honeywell International
- 12.1.9.1. Company Overview
- 12.1.9.2. Products
- 12.1.9.3. Company Financials
- 12.1.9.4. SWOT Analysis
- 12.1.10 The Lubrizol Corporation
- 12.1.10.1. Company Overview
- 12.1.10.2. Products
- 12.1.10.3. Company Financials
- 12.1.10.4. SWOT Analysis
- 12.1.11 Lonza
- 12.1.11.1. Company Overview
- 12.1.11.2. Products
- 12.1.11.3. Company Financials
- 12.1.11.4. SWOT Analysis
- 12.1.1 Fine Organics
- 12.2. Market Entropy
- 12.2.1 Company's Key Areas Served
- 12.2.2 Recent Developments
- 12.3. Company Market Share Analysis 2025
- 12.3.1 Top 5 Companies Market Share Analysis
- 12.3.2 Top 3 Companies Market Share Analysis
- 12.4. List of Potential Customers
- 13. Research Methodology
List of Figures
- Figure 1: Global Slip Additives Industry Revenue Breakdown (million, %) by Region 2025 & 2033
- Figure 2: Global Slip Additives Industry Volume Breakdown (kilotons, %) by Region 2025 & 2033
- Figure 3: Asia Pacific Slip Additives Industry Revenue (million), by Carrier Resin 2025 & 2033
- Figure 4: Asia Pacific Slip Additives Industry Volume (kilotons), by Carrier Resin 2025 & 2033
- Figure 5: Asia Pacific Slip Additives Industry Revenue Share (%), by Carrier Resin 2025 & 2033
- Figure 6: Asia Pacific Slip Additives Industry Volume Share (%), by Carrier Resin 2025 & 2033
- Figure 7: Asia Pacific Slip Additives Industry Revenue (million), by Type 2025 & 2033
- Figure 8: Asia Pacific Slip Additives Industry Volume (kilotons), by Type 2025 & 2033
- Figure 9: Asia Pacific Slip Additives Industry Revenue Share (%), by Type 2025 & 2033
- Figure 10: Asia Pacific Slip Additives Industry Volume Share (%), by Type 2025 & 2033
- Figure 11: Asia Pacific Slip Additives Industry Revenue (million), by Application 2025 & 2033
- Figure 12: Asia Pacific Slip Additives Industry Volume (kilotons), by Application 2025 & 2033
- Figure 13: Asia Pacific Slip Additives Industry Revenue Share (%), by Application 2025 & 2033
- Figure 14: Asia Pacific Slip Additives Industry Volume Share (%), by Application 2025 & 2033
- Figure 15: Asia Pacific Slip Additives Industry Revenue (million), by Country 2025 & 2033
- Figure 16: Asia Pacific Slip Additives Industry Volume (kilotons), by Country 2025 & 2033
- Figure 17: Asia Pacific Slip Additives Industry Revenue Share (%), by Country 2025 & 2033
- Figure 18: Asia Pacific Slip Additives Industry Volume Share (%), by Country 2025 & 2033
- Figure 19: North America Slip Additives Industry Revenue (million), by Carrier Resin 2025 & 2033
- Figure 20: North America Slip Additives Industry Volume (kilotons), by Carrier Resin 2025 & 2033
- Figure 21: North America Slip Additives Industry Revenue Share (%), by Carrier Resin 2025 & 2033
- Figure 22: North America Slip Additives Industry Volume Share (%), by Carrier Resin 2025 & 2033
- Figure 23: North America Slip Additives Industry Revenue (million), by Type 2025 & 2033
- Figure 24: North America Slip Additives Industry Volume (kilotons), by Type 2025 & 2033
- Figure 25: North America Slip Additives Industry Revenue Share (%), by Type 2025 & 2033
- Figure 26: North America Slip Additives Industry Volume Share (%), by Type 2025 & 2033
- Figure 27: North America Slip Additives Industry Revenue (million), by Application 2025 & 2033
- Figure 28: North America Slip Additives Industry Volume (kilotons), by Application 2025 & 2033
- Figure 29: North America Slip Additives Industry Revenue Share (%), by Application 2025 & 2033
- Figure 30: North America Slip Additives Industry Volume Share (%), by Application 2025 & 2033
- Figure 31: North America Slip Additives Industry Revenue (million), by Country 2025 & 2033
- Figure 32: North America Slip Additives Industry Volume (kilotons), by Country 2025 & 2033
- Figure 33: North America Slip Additives Industry Revenue Share (%), by Country 2025 & 2033
- Figure 34: North America Slip Additives Industry Volume Share (%), by Country 2025 & 2033
- Figure 35: Europe Slip Additives Industry Revenue (million), by Carrier Resin 2025 & 2033
- Figure 36: Europe Slip Additives Industry Volume (kilotons), by Carrier Resin 2025 & 2033
- Figure 37: Europe Slip Additives Industry Revenue Share (%), by Carrier Resin 2025 & 2033
- Figure 38: Europe Slip Additives Industry Volume Share (%), by Carrier Resin 2025 & 2033
- Figure 39: Europe Slip Additives Industry Revenue (million), by Type 2025 & 2033
- Figure 40: Europe Slip Additives Industry Volume (kilotons), by Type 2025 & 2033
- Figure 41: Europe Slip Additives Industry Revenue Share (%), by Type 2025 & 2033
- Figure 42: Europe Slip Additives Industry Volume Share (%), by Type 2025 & 2033
- Figure 43: Europe Slip Additives Industry Revenue (million), by Application 2025 & 2033
- Figure 44: Europe Slip Additives Industry Volume (kilotons), by Application 2025 & 2033
- Figure 45: Europe Slip Additives Industry Revenue Share (%), by Application 2025 & 2033
- Figure 46: Europe Slip Additives Industry Volume Share (%), by Application 2025 & 2033
- Figure 47: Europe Slip Additives Industry Revenue (million), by Country 2025 & 2033
- Figure 48: Europe Slip Additives Industry Volume (kilotons), by Country 2025 & 2033
- Figure 49: Europe Slip Additives Industry Revenue Share (%), by Country 2025 & 2033
- Figure 50: Europe Slip Additives Industry Volume Share (%), by Country 2025 & 2033
- Figure 51: South America Slip Additives Industry Revenue (million), by Carrier Resin 2025 & 2033
- Figure 52: South America Slip Additives Industry Volume (kilotons), by Carrier Resin 2025 & 2033
- Figure 53: South America Slip Additives Industry Revenue Share (%), by Carrier Resin 2025 & 2033
- Figure 54: South America Slip Additives Industry Volume Share (%), by Carrier Resin 2025 & 2033
- Figure 55: South America Slip Additives Industry Revenue (million), by Type 2025 & 2033
- Figure 56: South America Slip Additives Industry Volume (kilotons), by Type 2025 & 2033
- Figure 57: South America Slip Additives Industry Revenue Share (%), by Type 2025 & 2033
- Figure 58: South America Slip Additives Industry Volume Share (%), by Type 2025 & 2033
- Figure 59: South America Slip Additives Industry Revenue (million), by Application 2025 & 2033
- Figure 60: South America Slip Additives Industry Volume (kilotons), by Application 2025 & 2033
- Figure 61: South America Slip Additives Industry Revenue Share (%), by Application 2025 & 2033
- Figure 62: South America Slip Additives Industry Volume Share (%), by Application 2025 & 2033
- Figure 63: South America Slip Additives Industry Revenue (million), by Country 2025 & 2033
- Figure 64: South America Slip Additives Industry Volume (kilotons), by Country 2025 & 2033
- Figure 65: South America Slip Additives Industry Revenue Share (%), by Country 2025 & 2033
- Figure 66: South America Slip Additives Industry Volume Share (%), by Country 2025 & 2033
- Figure 67: Middle East and Africa Slip Additives Industry Revenue (million), by Carrier Resin 2025 & 2033
- Figure 68: Middle East and Africa Slip Additives Industry Volume (kilotons), by Carrier Resin 2025 & 2033
- Figure 69: Middle East and Africa Slip Additives Industry Revenue Share (%), by Carrier Resin 2025 & 2033
- Figure 70: Middle East and Africa Slip Additives Industry Volume Share (%), by Carrier Resin 2025 & 2033
- Figure 71: Middle East and Africa Slip Additives Industry Revenue (million), by Type 2025 & 2033
- Figure 72: Middle East and Africa Slip Additives Industry Volume (kilotons), by Type 2025 & 2033
- Figure 73: Middle East and Africa Slip Additives Industry Revenue Share (%), by Type 2025 & 2033
- Figure 74: Middle East and Africa Slip Additives Industry Volume Share (%), by Type 2025 & 2033
- Figure 75: Middle East and Africa Slip Additives Industry Revenue (million), by Application 2025 & 2033
- Figure 76: Middle East and Africa Slip Additives Industry Volume (kilotons), by Application 2025 & 2033
- Figure 77: Middle East and Africa Slip Additives Industry Revenue Share (%), by Application 2025 & 2033
- Figure 78: Middle East and Africa Slip Additives Industry Volume Share (%), by Application 2025 & 2033
- Figure 79: Middle East and Africa Slip Additives Industry Revenue (million), by Country 2025 & 2033
- Figure 80: Middle East and Africa Slip Additives Industry Volume (kilotons), by Country 2025 & 2033
- Figure 81: Middle East and Africa Slip Additives Industry Revenue Share (%), by Country 2025 & 2033
- Figure 82: Middle East and Africa Slip Additives Industry Volume Share (%), by Country 2025 & 2033
List of Tables
- Table 1: Global Slip Additives Industry Revenue million Forecast, by Carrier Resin 2020 & 2033
- Table 2: Global Slip Additives Industry Volume kilotons Forecast, by Carrier Resin 2020 & 2033
- Table 3: Global Slip Additives Industry Revenue million Forecast, by Type 2020 & 2033
- Table 4: Global Slip Additives Industry Volume kilotons Forecast, by Type 2020 & 2033
- Table 5: Global Slip Additives Industry Revenue million Forecast, by Application 2020 & 2033
- Table 6: Global Slip Additives Industry Volume kilotons Forecast, by Application 2020 & 2033
- Table 7: Global Slip Additives Industry Revenue million Forecast, by Region 2020 & 2033
- Table 8: Global Slip Additives Industry Volume kilotons Forecast, by Region 2020 & 2033
- Table 9: Global Slip Additives Industry Revenue million Forecast, by Carrier Resin 2020 & 2033
- Table 10: Global Slip Additives Industry Volume kilotons Forecast, by Carrier Resin 2020 & 2033
- Table 11: Global Slip Additives Industry Revenue million Forecast, by Type 2020 & 2033
- Table 12: Global Slip Additives Industry Volume kilotons Forecast, by Type 2020 & 2033
- Table 13: Global Slip Additives Industry Revenue million Forecast, by Application 2020 & 2033
- Table 14: Global Slip Additives Industry Volume kilotons Forecast, by Application 2020 & 2033
- Table 15: Global Slip Additives Industry Revenue million Forecast, by Country 2020 & 2033
- Table 16: Global Slip Additives Industry Volume kilotons Forecast, by Country 2020 & 2033
- Table 17: China Slip Additives Industry Revenue (million) Forecast, by Application 2020 & 2033
- Table 18: China Slip Additives Industry Volume (kilotons) Forecast, by Application 2020 & 2033
- Table 19: India Slip Additives Industry Revenue (million) Forecast, by Application 2020 & 2033
- Table 20: India Slip Additives Industry Volume (kilotons) Forecast, by Application 2020 & 2033
- Table 21: Japan Slip Additives Industry Revenue (million) Forecast, by Application 2020 & 2033
- Table 22: Japan Slip Additives Industry Volume (kilotons) Forecast, by Application 2020 & 2033
- Table 23: South Korea Slip Additives Industry Revenue (million) Forecast, by Application 2020 & 2033
- Table 24: South Korea Slip Additives Industry Volume (kilotons) Forecast, by Application 2020 & 2033
- Table 25: Rest of Asia Pacific Slip Additives Industry Revenue (million) Forecast, by Application 2020 & 2033
- Table 26: Rest of Asia Pacific Slip Additives Industry Volume (kilotons) Forecast, by Application 2020 & 2033
- Table 27: Global Slip Additives Industry Revenue million Forecast, by Carrier Resin 2020 & 2033
- Table 28: Global Slip Additives Industry Volume kilotons Forecast, by Carrier Resin 2020 & 2033
- Table 29: Global Slip Additives Industry Revenue million Forecast, by Type 2020 & 2033
- Table 30: Global Slip Additives Industry Volume kilotons Forecast, by Type 2020 & 2033
- Table 31: Global Slip Additives Industry Revenue million Forecast, by Application 2020 & 2033
- Table 32: Global Slip Additives Industry Volume kilotons Forecast, by Application 2020 & 2033
- Table 33: Global Slip Additives Industry Revenue million Forecast, by Country 2020 & 2033
- Table 34: Global Slip Additives Industry Volume kilotons Forecast, by Country 2020 & 2033
- Table 35: United States Slip Additives Industry Revenue (million) Forecast, by Application 2020 & 2033
- Table 36: United States Slip Additives Industry Volume (kilotons) Forecast, by Application 2020 & 2033
- Table 37: Canada Slip Additives Industry Revenue (million) Forecast, by Application 2020 & 2033
- Table 38: Canada Slip Additives Industry Volume (kilotons) Forecast, by Application 2020 & 2033
- Table 39: Mexico Slip Additives Industry Revenue (million) Forecast, by Application 2020 & 2033
- Table 40: Mexico Slip Additives Industry Volume (kilotons) Forecast, by Application 2020 & 2033
- Table 41: Global Slip Additives Industry Revenue million Forecast, by Carrier Resin 2020 & 2033
- Table 42: Global Slip Additives Industry Volume kilotons Forecast, by Carrier Resin 2020 & 2033
- Table 43: Global Slip Additives Industry Revenue million Forecast, by Type 2020 & 2033
- Table 44: Global Slip Additives Industry Volume kilotons Forecast, by Type 2020 & 2033
- Table 45: Global Slip Additives Industry Revenue million Forecast, by Application 2020 & 2033
- Table 46: Global Slip Additives Industry Volume kilotons Forecast, by Application 2020 & 2033
- Table 47: Global Slip Additives Industry Revenue million Forecast, by Country 2020 & 2033
- Table 48: Global Slip Additives Industry Volume kilotons Forecast, by Country 2020 & 2033
- Table 49: Germany Slip Additives Industry Revenue (million) Forecast, by Application 2020 & 2033
- Table 50: Germany Slip Additives Industry Volume (kilotons) Forecast, by Application 2020 & 2033
- Table 51: United Kingdom Slip Additives Industry Revenue (million) Forecast, by Application 2020 & 2033
- Table 52: United Kingdom Slip Additives Industry Volume (kilotons) Forecast, by Application 2020 & 2033
- Table 53: Italy Slip Additives Industry Revenue (million) Forecast, by Application 2020 & 2033
- Table 54: Italy Slip Additives Industry Volume (kilotons) Forecast, by Application 2020 & 2033
- Table 55: France Slip Additives Industry Revenue (million) Forecast, by Application 2020 & 2033
- Table 56: France Slip Additives Industry Volume (kilotons) Forecast, by Application 2020 & 2033
- Table 57: Rest of Europe Slip Additives Industry Revenue (million) Forecast, by Application 2020 & 2033
- Table 58: Rest of Europe Slip Additives Industry Volume (kilotons) Forecast, by Application 2020 & 2033
- Table 59: Global Slip Additives Industry Revenue million Forecast, by Carrier Resin 2020 & 2033
- Table 60: Global Slip Additives Industry Volume kilotons Forecast, by Carrier Resin 2020 & 2033
- Table 61: Global Slip Additives Industry Revenue million Forecast, by Type 2020 & 2033
- Table 62: Global Slip Additives Industry Volume kilotons Forecast, by Type 2020 & 2033
- Table 63: Global Slip Additives Industry Revenue million Forecast, by Application 2020 & 2033
- Table 64: Global Slip Additives Industry Volume kilotons Forecast, by Application 2020 & 2033
- Table 65: Global Slip Additives Industry Revenue million Forecast, by Country 2020 & 2033
- Table 66: Global Slip Additives Industry Volume kilotons Forecast, by Country 2020 & 2033
- Table 67: Brazil Slip Additives Industry Revenue (million) Forecast, by Application 2020 & 2033
- Table 68: Brazil Slip Additives Industry Volume (kilotons) Forecast, by Application 2020 & 2033
- Table 69: Argentina Slip Additives Industry Revenue (million) Forecast, by Application 2020 & 2033
- Table 70: Argentina Slip Additives Industry Volume (kilotons) Forecast, by Application 2020 & 2033
- Table 71: Rest of South America Slip Additives Industry Revenue (million) Forecast, by Application 2020 & 2033
- Table 72: Rest of South America Slip Additives Industry Volume (kilotons) Forecast, by Application 2020 & 2033
- Table 73: Global Slip Additives Industry Revenue million Forecast, by Carrier Resin 2020 & 2033
- Table 74: Global Slip Additives Industry Volume kilotons Forecast, by Carrier Resin 2020 & 2033
- Table 75: Global Slip Additives Industry Revenue million Forecast, by Type 2020 & 2033
- Table 76: Global Slip Additives Industry Volume kilotons Forecast, by Type 2020 & 2033
- Table 77: Global Slip Additives Industry Revenue million Forecast, by Application 2020 & 2033
- Table 78: Global Slip Additives Industry Volume kilotons Forecast, by Application 2020 & 2033
- Table 79: Global Slip Additives Industry Revenue million Forecast, by Country 2020 & 2033
- Table 80: Global Slip Additives Industry Volume kilotons Forecast, by Country 2020 & 2033
- Table 81: Saudi Arabia Slip Additives Industry Revenue (million) Forecast, by Application 2020 & 2033
- Table 82: Saudi Arabia Slip Additives Industry Volume (kilotons) Forecast, by Application 2020 & 2033
- Table 83: South Africa Slip Additives Industry Revenue (million) Forecast, by Application 2020 & 2033
- Table 84: South Africa Slip Additives Industry Volume (kilotons) Forecast, by Application 2020 & 2033
- Table 85: Rest of Middle East and Africa Slip Additives Industry Revenue (million) Forecast, by Application 2020 & 2033
- Table 86: Rest of Middle East and Africa Slip Additives Industry Volume (kilotons) Forecast, by Application 2020 & 2033
Frequently Asked Questions
1. What is the projected Compound Annual Growth Rate (CAGR) of the Slip Additives Industry?
The projected CAGR is approximately 5.04%.
2. Which companies are prominent players in the Slip Additives Industry?
Key companies in the market include Fine Organics, PMC Group Inc *List Not Exhaustive, Evonik Industries AG, Croda International Inc, Afron, Emery Oleochemicals, ALTANA, BASF SE, Honeywell International, The Lubrizol Corporation, Lonza.
3. What are the main segments of the Slip Additives Industry?
The market segments include Carrier Resin, Type, Application.
4. Can you provide details about the market size?
The market size is estimated to be USD 280.54 million as of 2022.
5. What are some drivers contributing to market growth?
Increasing Demand from Food & Beverage Packaging Industry; Availability at Low Price Compared to Substitutes; Other Drivers.
6. What are the notable trends driving market growth?
Packaging Application to Dominate the Market.
7. Are there any restraints impacting market growth?
Stringent Environmental Regulations on The Use of Plastics; Other Restraints.
8. Can you provide examples of recent developments in the market?
The recent developments pertaining to the major players in the market are being covered in the complete study.
9. What pricing options are available for accessing the report?
Pricing options include single-user, multi-user, and enterprise licenses priced at USD 4750, USD 5250, and USD 8750 respectively.
10. Is the market size provided in terms of value or volume?
The market size is provided in terms of value, measured in million and volume, measured in kilotons.
11. Are there any specific market keywords associated with the report?
Yes, the market keyword associated with the report is "Slip Additives Industry," which aids in identifying and referencing the specific market segment covered.
12. How do I determine which pricing option suits my needs best?
The pricing options vary based on user requirements and access needs. Individual users may opt for single-user licenses, while businesses requiring broader access may choose multi-user or enterprise licenses for cost-effective access to the report.
13. Are there any additional resources or data provided in the Slip Additives Industry report?
While the report offers comprehensive insights, it's advisable to review the specific contents or supplementary materials provided to ascertain if additional resources or data are available.
14. How can I stay updated on further developments or reports in the Slip Additives Industry?
To stay informed about further developments, trends, and reports in the Slip Additives Industry, consider subscribing to industry newsletters, following relevant companies and organizations, or regularly checking reputable industry news sources and publications.
Methodology
Step 1 - Identification of Relevant Samples Size from Population Database


Step 2 - Approaches for Defining Global Market Size (Value, Volume* & Price*)

Note*: In applicable scenarios
Step 3 - Data Sources
Primary Research
- Web Analytics
- Survey Reports
- Research Institute
- Latest Research Reports
- Opinion Leaders
Secondary Research
- Annual Reports
- White Paper
- Latest Press Release
- Industry Association
- Paid Database
- Investor Presentations

Step 4 - Data Triangulation
Involves using different sources of information in order to increase the validity of a study
These sources are likely to be stakeholders in a program - participants, other researchers, program staff, other community members, and so on.
Then we put all data in single framework & apply various statistical tools to find out the dynamic on the market.
During the analysis stage, feedback from the stakeholder groups would be compared to determine areas of agreement as well as areas of divergence