
Key Insights
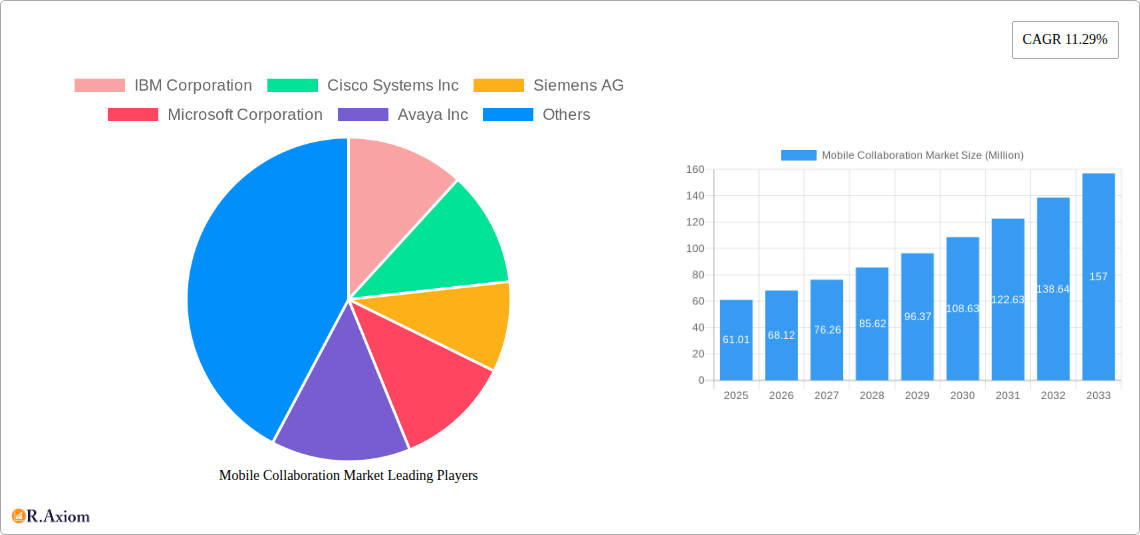
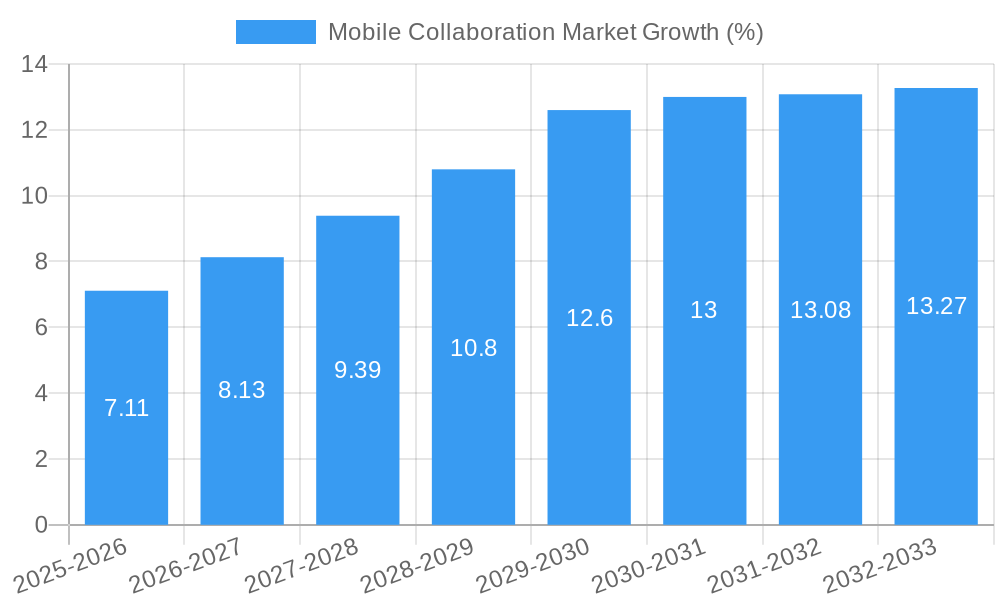
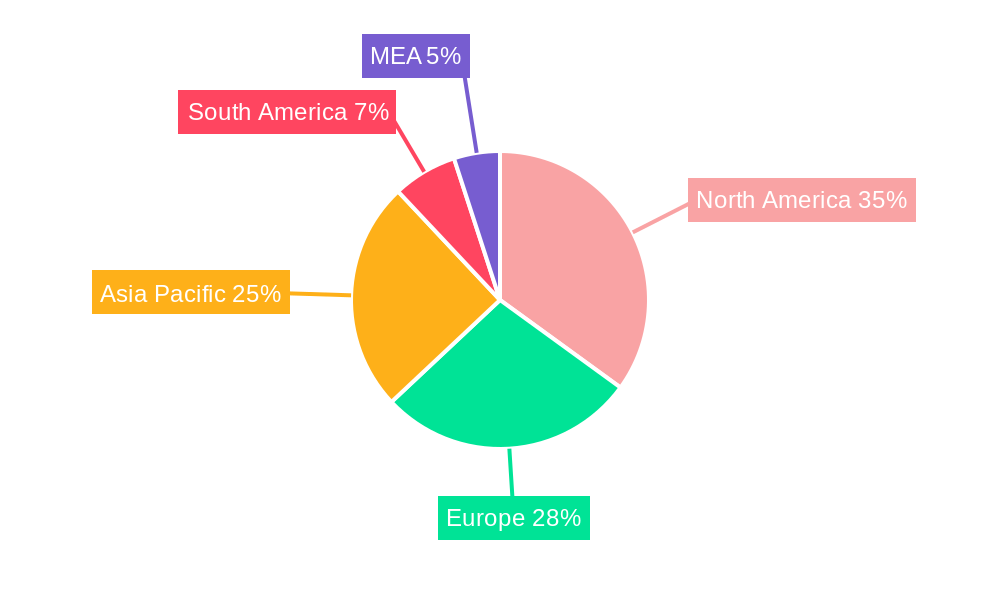
The global mobile collaboration market, valued at $61.01 million in 2025, is experiencing robust growth, projected to expand at a Compound Annual Growth Rate (CAGR) of 11.29% from 2025 to 2033. This expansion is fueled by several key drivers. The increasing adoption of mobile devices and the widespread shift towards remote work and hybrid work models are significantly boosting demand for mobile collaboration solutions. Businesses are increasingly recognizing the importance of seamless communication and collaboration to enhance productivity and efficiency, regardless of employee location. Furthermore, the rising need for real-time communication and data sharing, especially amongst geographically dispersed teams, fuels the adoption of mobile collaboration tools such as enterprise social networks, file-sharing platforms, and video conferencing applications. Advanced features like enhanced security, integration with existing enterprise systems, and improved user experience are further driving market growth. The BFSI, public sector, and healthcare sectors are prominent adopters, followed by the energy and utilities, retail, IT and telecom, and travel and hospitality industries. Growth is geographically diverse, with North America and Europe currently leading, although the Asia-Pacific region demonstrates significant potential for future expansion due to increasing digitalization and smartphone penetration.
However, certain challenges constrain market growth. Data security and privacy concerns remain a significant hurdle, particularly concerning the sensitive nature of data exchanged through mobile collaboration platforms. Integration complexities with legacy systems and the need for robust IT infrastructure can also impede widespread adoption. Moreover, the cost of implementation and ongoing maintenance of these solutions may present a barrier for smaller businesses. Despite these constraints, the overall market trend is optimistic, propelled by technological advancements, evolving work patterns, and the growing need for improved communication and collaboration across organizations of all sizes. The market is segmented by service type (managed and professional services), end-user industry (BFSI, public sector, etc.), and solution type (portals, file sharing, video conferencing, etc.), offering diverse opportunities for market players like IBM, Cisco, Siemens, Microsoft, Avaya, NEC, Oracle, Ribbon Communications, and Alcatel-Lucent. The continuous innovation in mobile collaboration technologies and the increasing focus on user experience are expected to further accelerate market expansion in the coming years.
Mobile Collaboration Market: A Comprehensive Report (2019-2033)
This in-depth report provides a comprehensive analysis of the Mobile Collaboration Market, covering market size, segmentation, growth drivers, challenges, and key players. The study period spans from 2019 to 2033, with 2025 serving as the base and estimated year. The forecast period is 2025-2033, and the historical period covers 2019-2024. This report is invaluable for industry stakeholders, investors, and anyone seeking to understand the dynamics of this rapidly evolving market.
Mobile Collaboration Market Concentration & Innovation
This section analyzes the competitive landscape, innovation drivers, and regulatory influences shaping the Mobile Collaboration Market. The market exhibits a moderately concentrated structure, with key players like IBM Corporation, Cisco Systems Inc, Microsoft Corporation, and others holding significant market share. However, the entry of nimble startups and the continuous evolution of technology contribute to a dynamic environment. The market share of the top 5 players is estimated at xx% in 2025.
- Innovation Drivers: Advancements in cloud computing, AI-powered collaboration tools, and 5G connectivity are major drivers of innovation. Enhanced security features and integration with existing enterprise systems are also key factors.
- Regulatory Frameworks: Data privacy regulations like GDPR and CCPA are influencing product development and deployment strategies. Compliance requirements are driving investment in secure collaboration solutions.
- Product Substitutes: The market faces competition from alternative communication channels such as traditional email and video conferencing platforms. However, the integrated nature and enhanced functionality of mobile collaboration platforms provide a competitive advantage.
- End-User Trends: The increasing adoption of remote work models and the need for seamless communication across geographically dispersed teams are boosting market demand. The preference for user-friendly, mobile-first solutions is also influencing market growth.
- M&A Activities: The mobile collaboration sector has witnessed significant M&A activity in recent years. Deal values have ranged from xx Million to xx Million, driven by the desire to expand market reach, enhance product portfolios, and acquire specialized technologies. A significant number of deals have involved the acquisition of smaller, innovative companies by larger players to bolster their offerings.
Mobile Collaboration Market Industry Trends & Insights
The Mobile Collaboration Market is experiencing robust growth, driven by several factors. The market is projected to reach xx Million by 2033, exhibiting a CAGR of xx% during the forecast period. Market penetration is currently at approximately xx%, indicating significant untapped potential.
Key growth drivers include the increasing adoption of bring-your-own-device (BYOD) policies, the growing demand for secure and reliable communication solutions, and the rising need for improved team collaboration across organizations of all sizes. Technological advancements, including the integration of artificial intelligence and machine learning capabilities, are further enhancing the functionality and appeal of these platforms. Consumer preferences are shifting towards intuitive, user-friendly interfaces and integrated solutions that streamline workflows. The competitive dynamics are characterized by intense rivalry among established players and the emergence of new entrants, leading to continuous product innovation and price competition.
Dominant Markets & Segments in Mobile Collaboration Market
The North American region currently dominates the Mobile Collaboration Market, driven by high technological adoption rates, robust IT infrastructure, and a strong emphasis on employee productivity. However, the Asia-Pacific region is expected to witness significant growth in the coming years, fueled by rapid economic expansion and increasing digitalization.
By Services: Managed services are currently the largest segment, accounting for approximately xx% of the market share, driven by the need for ongoing technical support and maintenance. Professional services are also experiencing substantial growth, driven by the increasing demand for specialized expertise in implementation and customization.
By End-user Industry: The BFSI and IT and Telecom sectors are the leading end-user industries. The BFSI sector’s demand is driven by the need for secure and efficient communication among employees and customers. IT and Telecom exhibit high adoption driven by internal operational needs. Other key industries contributing to market growth include healthcare, public sector, and retail.
Key Drivers for Dominant Segments:
- BFSI: Stringent security and regulatory compliance requirements.
- IT & Telecom: Need for efficient internal communication and collaboration.
- North America: High level of technological advancement, strong digital infrastructure.
Mobile Collaboration Market Product Developments
Recent product innovations focus on enhanced security, seamless integration with existing enterprise systems, and AI-powered features such as intelligent task management and automated transcription. The increasing adoption of cloud-based solutions and the integration of augmented reality/virtual reality (AR/VR) technologies are enhancing the user experience and productivity. The market fit is excellent, with mobile collaboration solutions addressing the increasing need for remote teamwork and digital transformation.
Report Scope & Segmentation Analysis
This report provides a granular segmentation of the Mobile Collaboration Market across various parameters:
- By Services: Managed Services and Professional Services. Managed services are projected to grow at xx% CAGR, while Professional Services are expected to see a xx% CAGR.
- By End-user Industry: BFSI, Public Sector, Healthcare, Energy and Utilities, Retail, IT and Telecom, and Travel and Hospitality. Each segment exhibits varying growth rates based on specific industry needs and technological adoption rates.
- By Solution: Portals and Intranet Platforms, File Sharing and Synchronization, Enterprise Video, Enterprise Social Networks, and Other Solutions. File sharing and synchronization solutions are currently the largest segment, but Enterprise Video is experiencing the highest growth.
Each segment's market size, growth projections, and competitive dynamics are comprehensively analyzed within the report.
Key Drivers of Mobile Collaboration Market Growth
Technological advancements, particularly in cloud computing, AI, and 5G, are fueling market growth. The increasing adoption of remote work models and the need for enhanced team collaboration are key drivers. Government initiatives promoting digital transformation and supportive regulatory frameworks further accelerate market expansion. Examples include government investments in digital infrastructure and policies promoting remote work adoption.
Challenges in the Mobile Collaboration Market Sector
The mobile collaboration market faces challenges such as ensuring data security and privacy in a distributed environment. Maintaining seamless integration with legacy systems and addressing the concerns around interoperability are also critical hurdles. The cost of implementation and training can pose a barrier for smaller organizations, and intense competition from established players could affect margins. Supply chain disruptions could also impact product availability and prices. The overall impact of these challenges is estimated to reduce market growth by approximately xx% by 2033.
Emerging Opportunities in Mobile Collaboration Market
The integration of extended reality (XR) technologies, including AR/VR, presents a significant opportunity to enhance remote collaboration experiences. The growing adoption of AI-powered tools for automating tasks and improving productivity will also shape future market growth. Expanding into new emerging markets and focusing on niche industry-specific solutions will provide significant avenues for growth. The expansion into under-penetrated markets is expected to add xx Million to the market value by 2033.
Leading Players in the Mobile Collaboration Market Market
- IBM Corporation
- Cisco Systems Inc
- Siemens AG
- Microsoft Corporation
- Avaya Inc
- NEC Corporation
- Oracle Corporation
- Ribbon Communications LLC
- Alcatel-Lucent SA
Key Developments in Mobile Collaboration Market Industry
- 2023-Q4: IBM launched a new AI-powered collaboration platform.
- 2022-Q3: Cisco acquired a startup specializing in secure video conferencing.
- 2021-Q2: Microsoft integrated its Teams platform with various productivity tools. (Further developments will be detailed in the full report)
Strategic Outlook for Mobile Collaboration Market Market
The future of the Mobile Collaboration Market is bright, driven by continuous technological innovation and increasing demand for remote work solutions. The market is poised for significant expansion as new technologies, such as the metaverse and advanced AI capabilities, are integrated into collaboration platforms. This will lead to increased productivity and improved communication among teams, resulting in a positive impact on business outcomes. Opportunities exist in expanding into under-served markets and developing tailored solutions for specific industry segments.
Mobile Collaboration Market Segmentation
-
1. Solution
- 1.1. Portals and Intranet Platform
- 1.2. File Sharing and Synchronization
- 1.3. Enterprise Video
- 1.4. Enterprise Social Network
- 1.5. Other Solutions
-
2. Services
- 2.1. Managed Services
- 2.2. Professional Services
-
3. End-user Industry
- 3.1. BFSI
- 3.2. Public Sector
- 3.3. Healthcare
- 3.4. Energy and Utilities
- 3.5. Retail
- 3.6. IT and Telecom
- 3.7. Travel and Hospitality
Mobile Collaboration Market Segmentation By Geography
- 1. North America
- 2. Europe
- 3. Asia Pacific
- 4. Latin America
- 5. Middle East
Mobile Collaboration Market REPORT HIGHLIGHTS
| Aspects | Details |
|---|---|
| Study Period | 2019-2033 |
| Base Year | 2024 |
| Estimated Year | 2025 |
| Forecast Period | 2025-2033 |
| Historical Period | 2019-2024 |
| Growth Rate | CAGR of 11.29% from 2019-2033 |
| Segmentation |
|
Table of Contents
- 1. Introduction
- 1.1. Research Scope
- 1.2. Market Segmentation
- 1.3. Research Methodology
- 1.4. Definitions and Assumptions
- 2. Executive Summary
- 2.1. Introduction
- 3. Market Dynamics
- 3.1. Introduction
- 3.2. Market Drivers
- 3.2.1. Increased Demand for BYOD Applications; Growing Smart Devices Sales
- 3.3. Market Restrains
- 3.3.1. Security Concerns to Challenge the Market Growth
- 3.4. Market Trends
- 3.4.1. Retail Segment is Expected to Witness High Growth
- 4. Market Factor Analysis
- 4.1. Porters Five Forces
- 4.2. Supply/Value Chain
- 4.3. PESTEL analysis
- 4.4. Market Entropy
- 4.5. Patent/Trademark Analysis
- 5. Global Mobile Collaboration Market Analysis, Insights and Forecast, 2019-2031
- 5.1. Market Analysis, Insights and Forecast - by Solution
- 5.1.1. Portals and Intranet Platform
- 5.1.2. File Sharing and Synchronization
- 5.1.3. Enterprise Video
- 5.1.4. Enterprise Social Network
- 5.1.5. Other Solutions
- 5.2. Market Analysis, Insights and Forecast - by Services
- 5.2.1. Managed Services
- 5.2.2. Professional Services
- 5.3. Market Analysis, Insights and Forecast - by End-user Industry
- 5.3.1. BFSI
- 5.3.2. Public Sector
- 5.3.3. Healthcare
- 5.3.4. Energy and Utilities
- 5.3.5. Retail
- 5.3.6. IT and Telecom
- 5.3.7. Travel and Hospitality
- 5.4. Market Analysis, Insights and Forecast - by Region
- 5.4.1. North America
- 5.4.2. Europe
- 5.4.3. Asia Pacific
- 5.4.4. Latin America
- 5.4.5. Middle East
- 5.1. Market Analysis, Insights and Forecast - by Solution
- 6. North America Mobile Collaboration Market Analysis, Insights and Forecast, 2019-2031
- 6.1. Market Analysis, Insights and Forecast - by Solution
- 6.1.1. Portals and Intranet Platform
- 6.1.2. File Sharing and Synchronization
- 6.1.3. Enterprise Video
- 6.1.4. Enterprise Social Network
- 6.1.5. Other Solutions
- 6.2. Market Analysis, Insights and Forecast - by Services
- 6.2.1. Managed Services
- 6.2.2. Professional Services
- 6.3. Market Analysis, Insights and Forecast - by End-user Industry
- 6.3.1. BFSI
- 6.3.2. Public Sector
- 6.3.3. Healthcare
- 6.3.4. Energy and Utilities
- 6.3.5. Retail
- 6.3.6. IT and Telecom
- 6.3.7. Travel and Hospitality
- 6.1. Market Analysis, Insights and Forecast - by Solution
- 7. Europe Mobile Collaboration Market Analysis, Insights and Forecast, 2019-2031
- 7.1. Market Analysis, Insights and Forecast - by Solution
- 7.1.1. Portals and Intranet Platform
- 7.1.2. File Sharing and Synchronization
- 7.1.3. Enterprise Video
- 7.1.4. Enterprise Social Network
- 7.1.5. Other Solutions
- 7.2. Market Analysis, Insights and Forecast - by Services
- 7.2.1. Managed Services
- 7.2.2. Professional Services
- 7.3. Market Analysis, Insights and Forecast - by End-user Industry
- 7.3.1. BFSI
- 7.3.2. Public Sector
- 7.3.3. Healthcare
- 7.3.4. Energy and Utilities
- 7.3.5. Retail
- 7.3.6. IT and Telecom
- 7.3.7. Travel and Hospitality
- 7.1. Market Analysis, Insights and Forecast - by Solution
- 8. Asia Pacific Mobile Collaboration Market Analysis, Insights and Forecast, 2019-2031
- 8.1. Market Analysis, Insights and Forecast - by Solution
- 8.1.1. Portals and Intranet Platform
- 8.1.2. File Sharing and Synchronization
- 8.1.3. Enterprise Video
- 8.1.4. Enterprise Social Network
- 8.1.5. Other Solutions
- 8.2. Market Analysis, Insights and Forecast - by Services
- 8.2.1. Managed Services
- 8.2.2. Professional Services
- 8.3. Market Analysis, Insights and Forecast - by End-user Industry
- 8.3.1. BFSI
- 8.3.2. Public Sector
- 8.3.3. Healthcare
- 8.3.4. Energy and Utilities
- 8.3.5. Retail
- 8.3.6. IT and Telecom
- 8.3.7. Travel and Hospitality
- 8.1. Market Analysis, Insights and Forecast - by Solution
- 9. Latin America Mobile Collaboration Market Analysis, Insights and Forecast, 2019-2031
- 9.1. Market Analysis, Insights and Forecast - by Solution
- 9.1.1. Portals and Intranet Platform
- 9.1.2. File Sharing and Synchronization
- 9.1.3. Enterprise Video
- 9.1.4. Enterprise Social Network
- 9.1.5. Other Solutions
- 9.2. Market Analysis, Insights and Forecast - by Services
- 9.2.1. Managed Services
- 9.2.2. Professional Services
- 9.3. Market Analysis, Insights and Forecast - by End-user Industry
- 9.3.1. BFSI
- 9.3.2. Public Sector
- 9.3.3. Healthcare
- 9.3.4. Energy and Utilities
- 9.3.5. Retail
- 9.3.6. IT and Telecom
- 9.3.7. Travel and Hospitality
- 9.1. Market Analysis, Insights and Forecast - by Solution
- 10. Middle East Mobile Collaboration Market Analysis, Insights and Forecast, 2019-2031
- 10.1. Market Analysis, Insights and Forecast - by Solution
- 10.1.1. Portals and Intranet Platform
- 10.1.2. File Sharing and Synchronization
- 10.1.3. Enterprise Video
- 10.1.4. Enterprise Social Network
- 10.1.5. Other Solutions
- 10.2. Market Analysis, Insights and Forecast - by Services
- 10.2.1. Managed Services
- 10.2.2. Professional Services
- 10.3. Market Analysis, Insights and Forecast - by End-user Industry
- 10.3.1. BFSI
- 10.3.2. Public Sector
- 10.3.3. Healthcare
- 10.3.4. Energy and Utilities
- 10.3.5. Retail
- 10.3.6. IT and Telecom
- 10.3.7. Travel and Hospitality
- 10.1. Market Analysis, Insights and Forecast - by Solution
- 11. North America Mobile Collaboration Market Analysis, Insights and Forecast, 2019-2031
- 11.1. Market Analysis, Insights and Forecast - By Country/Sub-region
- 11.1.1 United States
- 11.1.2 Canada
- 11.1.3 Mexico
- 12. Europe Mobile Collaboration Market Analysis, Insights and Forecast, 2019-2031
- 12.1. Market Analysis, Insights and Forecast - By Country/Sub-region
- 12.1.1 Germany
- 12.1.2 United Kingdom
- 12.1.3 France
- 12.1.4 Spain
- 12.1.5 Italy
- 12.1.6 Spain
- 12.1.7 Belgium
- 12.1.8 Netherland
- 12.1.9 Nordics
- 12.1.10 Rest of Europe
- 13. Asia Pacific Mobile Collaboration Market Analysis, Insights and Forecast, 2019-2031
- 13.1. Market Analysis, Insights and Forecast - By Country/Sub-region
- 13.1.1 China
- 13.1.2 Japan
- 13.1.3 India
- 13.1.4 South Korea
- 13.1.5 Southeast Asia
- 13.1.6 Australia
- 13.1.7 Indonesia
- 13.1.8 Phillipes
- 13.1.9 Singapore
- 13.1.10 Thailandc
- 13.1.11 Rest of Asia Pacific
- 14. South America Mobile Collaboration Market Analysis, Insights and Forecast, 2019-2031
- 14.1. Market Analysis, Insights and Forecast - By Country/Sub-region
- 14.1.1 Brazil
- 14.1.2 Argentina
- 14.1.3 Peru
- 14.1.4 Chile
- 14.1.5 Colombia
- 14.1.6 Ecuador
- 14.1.7 Venezuela
- 14.1.8 Rest of South America
- 15. North America Mobile Collaboration Market Analysis, Insights and Forecast, 2019-2031
- 15.1. Market Analysis, Insights and Forecast - By Country/Sub-region
- 15.1.1 United States
- 15.1.2 Canada
- 15.1.3 Mexico
- 16. MEA Mobile Collaboration Market Analysis, Insights and Forecast, 2019-2031
- 16.1. Market Analysis, Insights and Forecast - By Country/Sub-region
- 16.1.1 United Arab Emirates
- 16.1.2 Saudi Arabia
- 16.1.3 South Africa
- 16.1.4 Rest of Middle East and Africa
- 17. Competitive Analysis
- 17.1. Global Market Share Analysis 2024
- 17.2. Company Profiles
- 17.2.1 IBM Corporation
- 17.2.1.1. Overview
- 17.2.1.2. Products
- 17.2.1.3. SWOT Analysis
- 17.2.1.4. Recent Developments
- 17.2.1.5. Financials (Based on Availability)
- 17.2.2 Cisco Systems Inc
- 17.2.2.1. Overview
- 17.2.2.2. Products
- 17.2.2.3. SWOT Analysis
- 17.2.2.4. Recent Developments
- 17.2.2.5. Financials (Based on Availability)
- 17.2.3 Siemens AG
- 17.2.3.1. Overview
- 17.2.3.2. Products
- 17.2.3.3. SWOT Analysis
- 17.2.3.4. Recent Developments
- 17.2.3.5. Financials (Based on Availability)
- 17.2.4 Microsoft Corporation
- 17.2.4.1. Overview
- 17.2.4.2. Products
- 17.2.4.3. SWOT Analysis
- 17.2.4.4. Recent Developments
- 17.2.4.5. Financials (Based on Availability)
- 17.2.5 Avaya Inc
- 17.2.5.1. Overview
- 17.2.5.2. Products
- 17.2.5.3. SWOT Analysis
- 17.2.5.4. Recent Developments
- 17.2.5.5. Financials (Based on Availability)
- 17.2.6 NEC Corporation
- 17.2.6.1. Overview
- 17.2.6.2. Products
- 17.2.6.3. SWOT Analysis
- 17.2.6.4. Recent Developments
- 17.2.6.5. Financials (Based on Availability)
- 17.2.7 Oracle Corporation
- 17.2.7.1. Overview
- 17.2.7.2. Products
- 17.2.7.3. SWOT Analysis
- 17.2.7.4. Recent Developments
- 17.2.7.5. Financials (Based on Availability)
- 17.2.8 Ribbon Communications LLC
- 17.2.8.1. Overview
- 17.2.8.2. Products
- 17.2.8.3. SWOT Analysis
- 17.2.8.4. Recent Developments
- 17.2.8.5. Financials (Based on Availability)
- 17.2.9 Alcatel-Lucent SA
- 17.2.9.1. Overview
- 17.2.9.2. Products
- 17.2.9.3. SWOT Analysis
- 17.2.9.4. Recent Developments
- 17.2.9.5. Financials (Based on Availability)
- 17.2.1 IBM Corporation
List of Figures
- Figure 1: Global Mobile Collaboration Market Revenue Breakdown (Million, %) by Region 2024 & 2032
- Figure 2: Global Mobile Collaboration Market Volume Breakdown (K Unit, %) by Region 2024 & 2032
- Figure 3: North America Mobile Collaboration Market Revenue (Million), by Country 2024 & 2032
- Figure 4: North America Mobile Collaboration Market Volume (K Unit), by Country 2024 & 2032
- Figure 5: North America Mobile Collaboration Market Revenue Share (%), by Country 2024 & 2032
- Figure 6: North America Mobile Collaboration Market Volume Share (%), by Country 2024 & 2032
- Figure 7: Europe Mobile Collaboration Market Revenue (Million), by Country 2024 & 2032
- Figure 8: Europe Mobile Collaboration Market Volume (K Unit), by Country 2024 & 2032
- Figure 9: Europe Mobile Collaboration Market Revenue Share (%), by Country 2024 & 2032
- Figure 10: Europe Mobile Collaboration Market Volume Share (%), by Country 2024 & 2032
- Figure 11: Asia Pacific Mobile Collaboration Market Revenue (Million), by Country 2024 & 2032
- Figure 12: Asia Pacific Mobile Collaboration Market Volume (K Unit), by Country 2024 & 2032
- Figure 13: Asia Pacific Mobile Collaboration Market Revenue Share (%), by Country 2024 & 2032
- Figure 14: Asia Pacific Mobile Collaboration Market Volume Share (%), by Country 2024 & 2032
- Figure 15: South America Mobile Collaboration Market Revenue (Million), by Country 2024 & 2032
- Figure 16: South America Mobile Collaboration Market Volume (K Unit), by Country 2024 & 2032
- Figure 17: South America Mobile Collaboration Market Revenue Share (%), by Country 2024 & 2032
- Figure 18: South America Mobile Collaboration Market Volume Share (%), by Country 2024 & 2032
- Figure 19: North America Mobile Collaboration Market Revenue (Million), by Country 2024 & 2032
- Figure 20: North America Mobile Collaboration Market Volume (K Unit), by Country 2024 & 2032
- Figure 21: North America Mobile Collaboration Market Revenue Share (%), by Country 2024 & 2032
- Figure 22: North America Mobile Collaboration Market Volume Share (%), by Country 2024 & 2032
- Figure 23: MEA Mobile Collaboration Market Revenue (Million), by Country 2024 & 2032
- Figure 24: MEA Mobile Collaboration Market Volume (K Unit), by Country 2024 & 2032
- Figure 25: MEA Mobile Collaboration Market Revenue Share (%), by Country 2024 & 2032
- Figure 26: MEA Mobile Collaboration Market Volume Share (%), by Country 2024 & 2032
- Figure 27: North America Mobile Collaboration Market Revenue (Million), by Solution 2024 & 2032
- Figure 28: North America Mobile Collaboration Market Volume (K Unit), by Solution 2024 & 2032
- Figure 29: North America Mobile Collaboration Market Revenue Share (%), by Solution 2024 & 2032
- Figure 30: North America Mobile Collaboration Market Volume Share (%), by Solution 2024 & 2032
- Figure 31: North America Mobile Collaboration Market Revenue (Million), by Services 2024 & 2032
- Figure 32: North America Mobile Collaboration Market Volume (K Unit), by Services 2024 & 2032
- Figure 33: North America Mobile Collaboration Market Revenue Share (%), by Services 2024 & 2032
- Figure 34: North America Mobile Collaboration Market Volume Share (%), by Services 2024 & 2032
- Figure 35: North America Mobile Collaboration Market Revenue (Million), by End-user Industry 2024 & 2032
- Figure 36: North America Mobile Collaboration Market Volume (K Unit), by End-user Industry 2024 & 2032
- Figure 37: North America Mobile Collaboration Market Revenue Share (%), by End-user Industry 2024 & 2032
- Figure 38: North America Mobile Collaboration Market Volume Share (%), by End-user Industry 2024 & 2032
- Figure 39: North America Mobile Collaboration Market Revenue (Million), by Country 2024 & 2032
- Figure 40: North America Mobile Collaboration Market Volume (K Unit), by Country 2024 & 2032
- Figure 41: North America Mobile Collaboration Market Revenue Share (%), by Country 2024 & 2032
- Figure 42: North America Mobile Collaboration Market Volume Share (%), by Country 2024 & 2032
- Figure 43: Europe Mobile Collaboration Market Revenue (Million), by Solution 2024 & 2032
- Figure 44: Europe Mobile Collaboration Market Volume (K Unit), by Solution 2024 & 2032
- Figure 45: Europe Mobile Collaboration Market Revenue Share (%), by Solution 2024 & 2032
- Figure 46: Europe Mobile Collaboration Market Volume Share (%), by Solution 2024 & 2032
- Figure 47: Europe Mobile Collaboration Market Revenue (Million), by Services 2024 & 2032
- Figure 48: Europe Mobile Collaboration Market Volume (K Unit), by Services 2024 & 2032
- Figure 49: Europe Mobile Collaboration Market Revenue Share (%), by Services 2024 & 2032
- Figure 50: Europe Mobile Collaboration Market Volume Share (%), by Services 2024 & 2032
- Figure 51: Europe Mobile Collaboration Market Revenue (Million), by End-user Industry 2024 & 2032
- Figure 52: Europe Mobile Collaboration Market Volume (K Unit), by End-user Industry 2024 & 2032
- Figure 53: Europe Mobile Collaboration Market Revenue Share (%), by End-user Industry 2024 & 2032
- Figure 54: Europe Mobile Collaboration Market Volume Share (%), by End-user Industry 2024 & 2032
- Figure 55: Europe Mobile Collaboration Market Revenue (Million), by Country 2024 & 2032
- Figure 56: Europe Mobile Collaboration Market Volume (K Unit), by Country 2024 & 2032
- Figure 57: Europe Mobile Collaboration Market Revenue Share (%), by Country 2024 & 2032
- Figure 58: Europe Mobile Collaboration Market Volume Share (%), by Country 2024 & 2032
- Figure 59: Asia Pacific Mobile Collaboration Market Revenue (Million), by Solution 2024 & 2032
- Figure 60: Asia Pacific Mobile Collaboration Market Volume (K Unit), by Solution 2024 & 2032
- Figure 61: Asia Pacific Mobile Collaboration Market Revenue Share (%), by Solution 2024 & 2032
- Figure 62: Asia Pacific Mobile Collaboration Market Volume Share (%), by Solution 2024 & 2032
- Figure 63: Asia Pacific Mobile Collaboration Market Revenue (Million), by Services 2024 & 2032
- Figure 64: Asia Pacific Mobile Collaboration Market Volume (K Unit), by Services 2024 & 2032
- Figure 65: Asia Pacific Mobile Collaboration Market Revenue Share (%), by Services 2024 & 2032
- Figure 66: Asia Pacific Mobile Collaboration Market Volume Share (%), by Services 2024 & 2032
- Figure 67: Asia Pacific Mobile Collaboration Market Revenue (Million), by End-user Industry 2024 & 2032
- Figure 68: Asia Pacific Mobile Collaboration Market Volume (K Unit), by End-user Industry 2024 & 2032
- Figure 69: Asia Pacific Mobile Collaboration Market Revenue Share (%), by End-user Industry 2024 & 2032
- Figure 70: Asia Pacific Mobile Collaboration Market Volume Share (%), by End-user Industry 2024 & 2032
- Figure 71: Asia Pacific Mobile Collaboration Market Revenue (Million), by Country 2024 & 2032
- Figure 72: Asia Pacific Mobile Collaboration Market Volume (K Unit), by Country 2024 & 2032
- Figure 73: Asia Pacific Mobile Collaboration Market Revenue Share (%), by Country 2024 & 2032
- Figure 74: Asia Pacific Mobile Collaboration Market Volume Share (%), by Country 2024 & 2032
- Figure 75: Latin America Mobile Collaboration Market Revenue (Million), by Solution 2024 & 2032
- Figure 76: Latin America Mobile Collaboration Market Volume (K Unit), by Solution 2024 & 2032
- Figure 77: Latin America Mobile Collaboration Market Revenue Share (%), by Solution 2024 & 2032
- Figure 78: Latin America Mobile Collaboration Market Volume Share (%), by Solution 2024 & 2032
- Figure 79: Latin America Mobile Collaboration Market Revenue (Million), by Services 2024 & 2032
- Figure 80: Latin America Mobile Collaboration Market Volume (K Unit), by Services 2024 & 2032
- Figure 81: Latin America Mobile Collaboration Market Revenue Share (%), by Services 2024 & 2032
- Figure 82: Latin America Mobile Collaboration Market Volume Share (%), by Services 2024 & 2032
- Figure 83: Latin America Mobile Collaboration Market Revenue (Million), by End-user Industry 2024 & 2032
- Figure 84: Latin America Mobile Collaboration Market Volume (K Unit), by End-user Industry 2024 & 2032
- Figure 85: Latin America Mobile Collaboration Market Revenue Share (%), by End-user Industry 2024 & 2032
- Figure 86: Latin America Mobile Collaboration Market Volume Share (%), by End-user Industry 2024 & 2032
- Figure 87: Latin America Mobile Collaboration Market Revenue (Million), by Country 2024 & 2032
- Figure 88: Latin America Mobile Collaboration Market Volume (K Unit), by Country 2024 & 2032
- Figure 89: Latin America Mobile Collaboration Market Revenue Share (%), by Country 2024 & 2032
- Figure 90: Latin America Mobile Collaboration Market Volume Share (%), by Country 2024 & 2032
- Figure 91: Middle East Mobile Collaboration Market Revenue (Million), by Solution 2024 & 2032
- Figure 92: Middle East Mobile Collaboration Market Volume (K Unit), by Solution 2024 & 2032
- Figure 93: Middle East Mobile Collaboration Market Revenue Share (%), by Solution 2024 & 2032
- Figure 94: Middle East Mobile Collaboration Market Volume Share (%), by Solution 2024 & 2032
- Figure 95: Middle East Mobile Collaboration Market Revenue (Million), by Services 2024 & 2032
- Figure 96: Middle East Mobile Collaboration Market Volume (K Unit), by Services 2024 & 2032
- Figure 97: Middle East Mobile Collaboration Market Revenue Share (%), by Services 2024 & 2032
- Figure 98: Middle East Mobile Collaboration Market Volume Share (%), by Services 2024 & 2032
- Figure 99: Middle East Mobile Collaboration Market Revenue (Million), by End-user Industry 2024 & 2032
- Figure 100: Middle East Mobile Collaboration Market Volume (K Unit), by End-user Industry 2024 & 2032
- Figure 101: Middle East Mobile Collaboration Market Revenue Share (%), by End-user Industry 2024 & 2032
- Figure 102: Middle East Mobile Collaboration Market Volume Share (%), by End-user Industry 2024 & 2032
- Figure 103: Middle East Mobile Collaboration Market Revenue (Million), by Country 2024 & 2032
- Figure 104: Middle East Mobile Collaboration Market Volume (K Unit), by Country 2024 & 2032
- Figure 105: Middle East Mobile Collaboration Market Revenue Share (%), by Country 2024 & 2032
- Figure 106: Middle East Mobile Collaboration Market Volume Share (%), by Country 2024 & 2032
List of Tables
- Table 1: Global Mobile Collaboration Market Revenue Million Forecast, by Region 2019 & 2032
- Table 2: Global Mobile Collaboration Market Volume K Unit Forecast, by Region 2019 & 2032
- Table 3: Global Mobile Collaboration Market Revenue Million Forecast, by Solution 2019 & 2032
- Table 4: Global Mobile Collaboration Market Volume K Unit Forecast, by Solution 2019 & 2032
- Table 5: Global Mobile Collaboration Market Revenue Million Forecast, by Services 2019 & 2032
- Table 6: Global Mobile Collaboration Market Volume K Unit Forecast, by Services 2019 & 2032
- Table 7: Global Mobile Collaboration Market Revenue Million Forecast, by End-user Industry 2019 & 2032
- Table 8: Global Mobile Collaboration Market Volume K Unit Forecast, by End-user Industry 2019 & 2032
- Table 9: Global Mobile Collaboration Market Revenue Million Forecast, by Region 2019 & 2032
- Table 10: Global Mobile Collaboration Market Volume K Unit Forecast, by Region 2019 & 2032
- Table 11: Global Mobile Collaboration Market Revenue Million Forecast, by Country 2019 & 2032
- Table 12: Global Mobile Collaboration Market Volume K Unit Forecast, by Country 2019 & 2032
- Table 13: United States Mobile Collaboration Market Revenue (Million) Forecast, by Application 2019 & 2032
- Table 14: United States Mobile Collaboration Market Volume (K Unit) Forecast, by Application 2019 & 2032
- Table 15: Canada Mobile Collaboration Market Revenue (Million) Forecast, by Application 2019 & 2032
- Table 16: Canada Mobile Collaboration Market Volume (K Unit) Forecast, by Application 2019 & 2032
- Table 17: Mexico Mobile Collaboration Market Revenue (Million) Forecast, by Application 2019 & 2032
- Table 18: Mexico Mobile Collaboration Market Volume (K Unit) Forecast, by Application 2019 & 2032
- Table 19: Global Mobile Collaboration Market Revenue Million Forecast, by Country 2019 & 2032
- Table 20: Global Mobile Collaboration Market Volume K Unit Forecast, by Country 2019 & 2032
- Table 21: Germany Mobile Collaboration Market Revenue (Million) Forecast, by Application 2019 & 2032
- Table 22: Germany Mobile Collaboration Market Volume (K Unit) Forecast, by Application 2019 & 2032
- Table 23: United Kingdom Mobile Collaboration Market Revenue (Million) Forecast, by Application 2019 & 2032
- Table 24: United Kingdom Mobile Collaboration Market Volume (K Unit) Forecast, by Application 2019 & 2032
- Table 25: France Mobile Collaboration Market Revenue (Million) Forecast, by Application 2019 & 2032
- Table 26: France Mobile Collaboration Market Volume (K Unit) Forecast, by Application 2019 & 2032
- Table 27: Spain Mobile Collaboration Market Revenue (Million) Forecast, by Application 2019 & 2032
- Table 28: Spain Mobile Collaboration Market Volume (K Unit) Forecast, by Application 2019 & 2032
- Table 29: Italy Mobile Collaboration Market Revenue (Million) Forecast, by Application 2019 & 2032
- Table 30: Italy Mobile Collaboration Market Volume (K Unit) Forecast, by Application 2019 & 2032
- Table 31: Spain Mobile Collaboration Market Revenue (Million) Forecast, by Application 2019 & 2032
- Table 32: Spain Mobile Collaboration Market Volume (K Unit) Forecast, by Application 2019 & 2032
- Table 33: Belgium Mobile Collaboration Market Revenue (Million) Forecast, by Application 2019 & 2032
- Table 34: Belgium Mobile Collaboration Market Volume (K Unit) Forecast, by Application 2019 & 2032
- Table 35: Netherland Mobile Collaboration Market Revenue (Million) Forecast, by Application 2019 & 2032
- Table 36: Netherland Mobile Collaboration Market Volume (K Unit) Forecast, by Application 2019 & 2032
- Table 37: Nordics Mobile Collaboration Market Revenue (Million) Forecast, by Application 2019 & 2032
- Table 38: Nordics Mobile Collaboration Market Volume (K Unit) Forecast, by Application 2019 & 2032
- Table 39: Rest of Europe Mobile Collaboration Market Revenue (Million) Forecast, by Application 2019 & 2032
- Table 40: Rest of Europe Mobile Collaboration Market Volume (K Unit) Forecast, by Application 2019 & 2032
- Table 41: Global Mobile Collaboration Market Revenue Million Forecast, by Country 2019 & 2032
- Table 42: Global Mobile Collaboration Market Volume K Unit Forecast, by Country 2019 & 2032
- Table 43: China Mobile Collaboration Market Revenue (Million) Forecast, by Application 2019 & 2032
- Table 44: China Mobile Collaboration Market Volume (K Unit) Forecast, by Application 2019 & 2032
- Table 45: Japan Mobile Collaboration Market Revenue (Million) Forecast, by Application 2019 & 2032
- Table 46: Japan Mobile Collaboration Market Volume (K Unit) Forecast, by Application 2019 & 2032
- Table 47: India Mobile Collaboration Market Revenue (Million) Forecast, by Application 2019 & 2032
- Table 48: India Mobile Collaboration Market Volume (K Unit) Forecast, by Application 2019 & 2032
- Table 49: South Korea Mobile Collaboration Market Revenue (Million) Forecast, by Application 2019 & 2032
- Table 50: South Korea Mobile Collaboration Market Volume (K Unit) Forecast, by Application 2019 & 2032
- Table 51: Southeast Asia Mobile Collaboration Market Revenue (Million) Forecast, by Application 2019 & 2032
- Table 52: Southeast Asia Mobile Collaboration Market Volume (K Unit) Forecast, by Application 2019 & 2032
- Table 53: Australia Mobile Collaboration Market Revenue (Million) Forecast, by Application 2019 & 2032
- Table 54: Australia Mobile Collaboration Market Volume (K Unit) Forecast, by Application 2019 & 2032
- Table 55: Indonesia Mobile Collaboration Market Revenue (Million) Forecast, by Application 2019 & 2032
- Table 56: Indonesia Mobile Collaboration Market Volume (K Unit) Forecast, by Application 2019 & 2032
- Table 57: Phillipes Mobile Collaboration Market Revenue (Million) Forecast, by Application 2019 & 2032
- Table 58: Phillipes Mobile Collaboration Market Volume (K Unit) Forecast, by Application 2019 & 2032
- Table 59: Singapore Mobile Collaboration Market Revenue (Million) Forecast, by Application 2019 & 2032
- Table 60: Singapore Mobile Collaboration Market Volume (K Unit) Forecast, by Application 2019 & 2032
- Table 61: Thailandc Mobile Collaboration Market Revenue (Million) Forecast, by Application 2019 & 2032
- Table 62: Thailandc Mobile Collaboration Market Volume (K Unit) Forecast, by Application 2019 & 2032
- Table 63: Rest of Asia Pacific Mobile Collaboration Market Revenue (Million) Forecast, by Application 2019 & 2032
- Table 64: Rest of Asia Pacific Mobile Collaboration Market Volume (K Unit) Forecast, by Application 2019 & 2032
- Table 65: Global Mobile Collaboration Market Revenue Million Forecast, by Country 2019 & 2032
- Table 66: Global Mobile Collaboration Market Volume K Unit Forecast, by Country 2019 & 2032
- Table 67: Brazil Mobile Collaboration Market Revenue (Million) Forecast, by Application 2019 & 2032
- Table 68: Brazil Mobile Collaboration Market Volume (K Unit) Forecast, by Application 2019 & 2032
- Table 69: Argentina Mobile Collaboration Market Revenue (Million) Forecast, by Application 2019 & 2032
- Table 70: Argentina Mobile Collaboration Market Volume (K Unit) Forecast, by Application 2019 & 2032
- Table 71: Peru Mobile Collaboration Market Revenue (Million) Forecast, by Application 2019 & 2032
- Table 72: Peru Mobile Collaboration Market Volume (K Unit) Forecast, by Application 2019 & 2032
- Table 73: Chile Mobile Collaboration Market Revenue (Million) Forecast, by Application 2019 & 2032
- Table 74: Chile Mobile Collaboration Market Volume (K Unit) Forecast, by Application 2019 & 2032
- Table 75: Colombia Mobile Collaboration Market Revenue (Million) Forecast, by Application 2019 & 2032
- Table 76: Colombia Mobile Collaboration Market Volume (K Unit) Forecast, by Application 2019 & 2032
- Table 77: Ecuador Mobile Collaboration Market Revenue (Million) Forecast, by Application 2019 & 2032
- Table 78: Ecuador Mobile Collaboration Market Volume (K Unit) Forecast, by Application 2019 & 2032
- Table 79: Venezuela Mobile Collaboration Market Revenue (Million) Forecast, by Application 2019 & 2032
- Table 80: Venezuela Mobile Collaboration Market Volume (K Unit) Forecast, by Application 2019 & 2032
- Table 81: Rest of South America Mobile Collaboration Market Revenue (Million) Forecast, by Application 2019 & 2032
- Table 82: Rest of South America Mobile Collaboration Market Volume (K Unit) Forecast, by Application 2019 & 2032
- Table 83: Global Mobile Collaboration Market Revenue Million Forecast, by Country 2019 & 2032
- Table 84: Global Mobile Collaboration Market Volume K Unit Forecast, by Country 2019 & 2032
- Table 85: United States Mobile Collaboration Market Revenue (Million) Forecast, by Application 2019 & 2032
- Table 86: United States Mobile Collaboration Market Volume (K Unit) Forecast, by Application 2019 & 2032
- Table 87: Canada Mobile Collaboration Market Revenue (Million) Forecast, by Application 2019 & 2032
- Table 88: Canada Mobile Collaboration Market Volume (K Unit) Forecast, by Application 2019 & 2032
- Table 89: Mexico Mobile Collaboration Market Revenue (Million) Forecast, by Application 2019 & 2032
- Table 90: Mexico Mobile Collaboration Market Volume (K Unit) Forecast, by Application 2019 & 2032
- Table 91: Global Mobile Collaboration Market Revenue Million Forecast, by Country 2019 & 2032
- Table 92: Global Mobile Collaboration Market Volume K Unit Forecast, by Country 2019 & 2032
- Table 93: United Arab Emirates Mobile Collaboration Market Revenue (Million) Forecast, by Application 2019 & 2032
- Table 94: United Arab Emirates Mobile Collaboration Market Volume (K Unit) Forecast, by Application 2019 & 2032
- Table 95: Saudi Arabia Mobile Collaboration Market Revenue (Million) Forecast, by Application 2019 & 2032
- Table 96: Saudi Arabia Mobile Collaboration Market Volume (K Unit) Forecast, by Application 2019 & 2032
- Table 97: South Africa Mobile Collaboration Market Revenue (Million) Forecast, by Application 2019 & 2032
- Table 98: South Africa Mobile Collaboration Market Volume (K Unit) Forecast, by Application 2019 & 2032
- Table 99: Rest of Middle East and Africa Mobile Collaboration Market Revenue (Million) Forecast, by Application 2019 & 2032
- Table 100: Rest of Middle East and Africa Mobile Collaboration Market Volume (K Unit) Forecast, by Application 2019 & 2032
- Table 101: Global Mobile Collaboration Market Revenue Million Forecast, by Solution 2019 & 2032
- Table 102: Global Mobile Collaboration Market Volume K Unit Forecast, by Solution 2019 & 2032
- Table 103: Global Mobile Collaboration Market Revenue Million Forecast, by Services 2019 & 2032
- Table 104: Global Mobile Collaboration Market Volume K Unit Forecast, by Services 2019 & 2032
- Table 105: Global Mobile Collaboration Market Revenue Million Forecast, by End-user Industry 2019 & 2032
- Table 106: Global Mobile Collaboration Market Volume K Unit Forecast, by End-user Industry 2019 & 2032
- Table 107: Global Mobile Collaboration Market Revenue Million Forecast, by Country 2019 & 2032
- Table 108: Global Mobile Collaboration Market Volume K Unit Forecast, by Country 2019 & 2032
- Table 109: Global Mobile Collaboration Market Revenue Million Forecast, by Solution 2019 & 2032
- Table 110: Global Mobile Collaboration Market Volume K Unit Forecast, by Solution 2019 & 2032
- Table 111: Global Mobile Collaboration Market Revenue Million Forecast, by Services 2019 & 2032
- Table 112: Global Mobile Collaboration Market Volume K Unit Forecast, by Services 2019 & 2032
- Table 113: Global Mobile Collaboration Market Revenue Million Forecast, by End-user Industry 2019 & 2032
- Table 114: Global Mobile Collaboration Market Volume K Unit Forecast, by End-user Industry 2019 & 2032
- Table 115: Global Mobile Collaboration Market Revenue Million Forecast, by Country 2019 & 2032
- Table 116: Global Mobile Collaboration Market Volume K Unit Forecast, by Country 2019 & 2032
- Table 117: Global Mobile Collaboration Market Revenue Million Forecast, by Solution 2019 & 2032
- Table 118: Global Mobile Collaboration Market Volume K Unit Forecast, by Solution 2019 & 2032
- Table 119: Global Mobile Collaboration Market Revenue Million Forecast, by Services 2019 & 2032
- Table 120: Global Mobile Collaboration Market Volume K Unit Forecast, by Services 2019 & 2032
- Table 121: Global Mobile Collaboration Market Revenue Million Forecast, by End-user Industry 2019 & 2032
- Table 122: Global Mobile Collaboration Market Volume K Unit Forecast, by End-user Industry 2019 & 2032
- Table 123: Global Mobile Collaboration Market Revenue Million Forecast, by Country 2019 & 2032
- Table 124: Global Mobile Collaboration Market Volume K Unit Forecast, by Country 2019 & 2032
- Table 125: Global Mobile Collaboration Market Revenue Million Forecast, by Solution 2019 & 2032
- Table 126: Global Mobile Collaboration Market Volume K Unit Forecast, by Solution 2019 & 2032
- Table 127: Global Mobile Collaboration Market Revenue Million Forecast, by Services 2019 & 2032
- Table 128: Global Mobile Collaboration Market Volume K Unit Forecast, by Services 2019 & 2032
- Table 129: Global Mobile Collaboration Market Revenue Million Forecast, by End-user Industry 2019 & 2032
- Table 130: Global Mobile Collaboration Market Volume K Unit Forecast, by End-user Industry 2019 & 2032
- Table 131: Global Mobile Collaboration Market Revenue Million Forecast, by Country 2019 & 2032
- Table 132: Global Mobile Collaboration Market Volume K Unit Forecast, by Country 2019 & 2032
- Table 133: Global Mobile Collaboration Market Revenue Million Forecast, by Solution 2019 & 2032
- Table 134: Global Mobile Collaboration Market Volume K Unit Forecast, by Solution 2019 & 2032
- Table 135: Global Mobile Collaboration Market Revenue Million Forecast, by Services 2019 & 2032
- Table 136: Global Mobile Collaboration Market Volume K Unit Forecast, by Services 2019 & 2032
- Table 137: Global Mobile Collaboration Market Revenue Million Forecast, by End-user Industry 2019 & 2032
- Table 138: Global Mobile Collaboration Market Volume K Unit Forecast, by End-user Industry 2019 & 2032
- Table 139: Global Mobile Collaboration Market Revenue Million Forecast, by Country 2019 & 2032
- Table 140: Global Mobile Collaboration Market Volume K Unit Forecast, by Country 2019 & 2032
Frequently Asked Questions
1. What is the projected Compound Annual Growth Rate (CAGR) of the Mobile Collaboration Market?
The projected CAGR is approximately 11.29%.
2. Which companies are prominent players in the Mobile Collaboration Market?
Key companies in the market include IBM Corporation, Cisco Systems Inc, Siemens AG, Microsoft Corporation, Avaya Inc, NEC Corporation, Oracle Corporation, Ribbon Communications LLC, Alcatel-Lucent SA.
3. What are the main segments of the Mobile Collaboration Market?
The market segments include Solution, Services, End-user Industry.
4. Can you provide details about the market size?
The market size is estimated to be USD 61.01 Million as of 2022.
5. What are some drivers contributing to market growth?
Increased Demand for BYOD Applications; Growing Smart Devices Sales.
6. What are the notable trends driving market growth?
Retail Segment is Expected to Witness High Growth.
7. Are there any restraints impacting market growth?
Security Concerns to Challenge the Market Growth.
8. Can you provide examples of recent developments in the market?
N/A
9. What pricing options are available for accessing the report?
Pricing options include single-user, multi-user, and enterprise licenses priced at USD 4750, USD 5250, and USD 8750 respectively.
10. Is the market size provided in terms of value or volume?
The market size is provided in terms of value, measured in Million and volume, measured in K Unit.
11. Are there any specific market keywords associated with the report?
Yes, the market keyword associated with the report is "Mobile Collaboration Market," which aids in identifying and referencing the specific market segment covered.
12. How do I determine which pricing option suits my needs best?
The pricing options vary based on user requirements and access needs. Individual users may opt for single-user licenses, while businesses requiring broader access may choose multi-user or enterprise licenses for cost-effective access to the report.
13. Are there any additional resources or data provided in the Mobile Collaboration Market report?
While the report offers comprehensive insights, it's advisable to review the specific contents or supplementary materials provided to ascertain if additional resources or data are available.
14. How can I stay updated on further developments or reports in the Mobile Collaboration Market?
To stay informed about further developments, trends, and reports in the Mobile Collaboration Market, consider subscribing to industry newsletters, following relevant companies and organizations, or regularly checking reputable industry news sources and publications.
Methodology
Step 1 - Identification of Relevant Samples Size from Population Database


Step 2 - Approaches for Defining Global Market Size (Value, Volume* & Price*)

Note*: In applicable scenarios
Step 3 - Data Sources
Primary Research
- Web Analytics
- Survey Reports
- Research Institute
- Latest Research Reports
- Opinion Leaders
Secondary Research
- Annual Reports
- White Paper
- Latest Press Release
- Industry Association
- Paid Database
- Investor Presentations

Step 4 - Data Triangulation
Involves using different sources of information in order to increase the validity of a study
These sources are likely to be stakeholders in a program - participants, other researchers, program staff, other community members, and so on.
Then we put all data in single framework & apply various statistical tools to find out the dynamic on the market.
During the analysis stage, feedback from the stakeholder groups would be compared to determine areas of agreement as well as areas of divergence


