
Key Insights
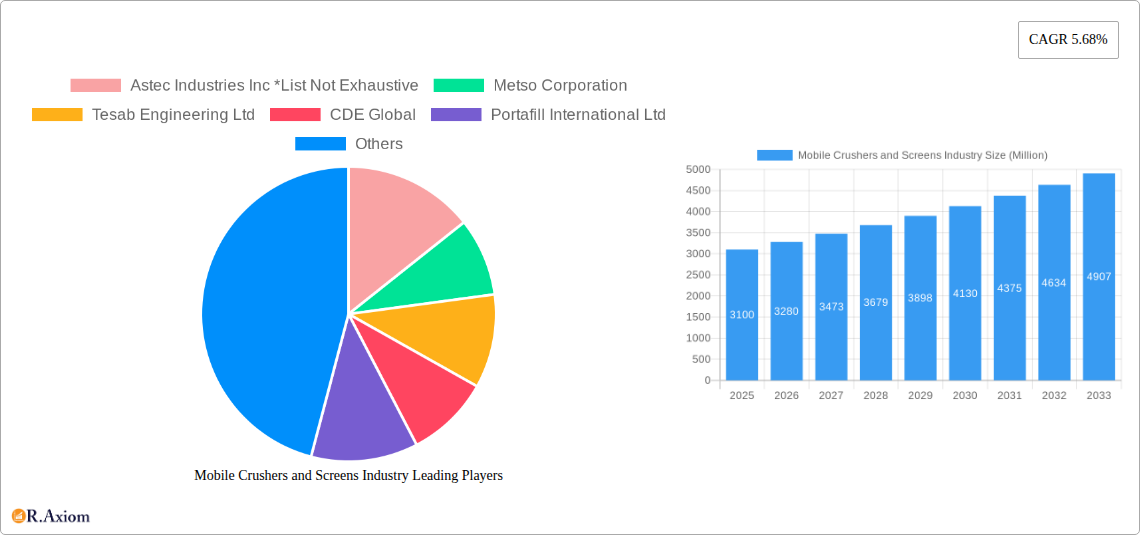
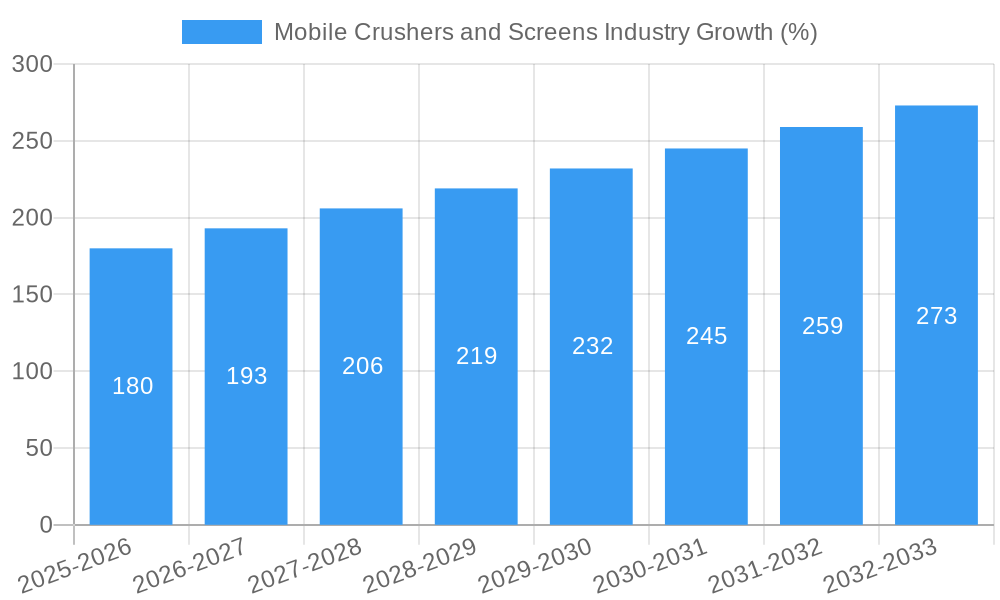
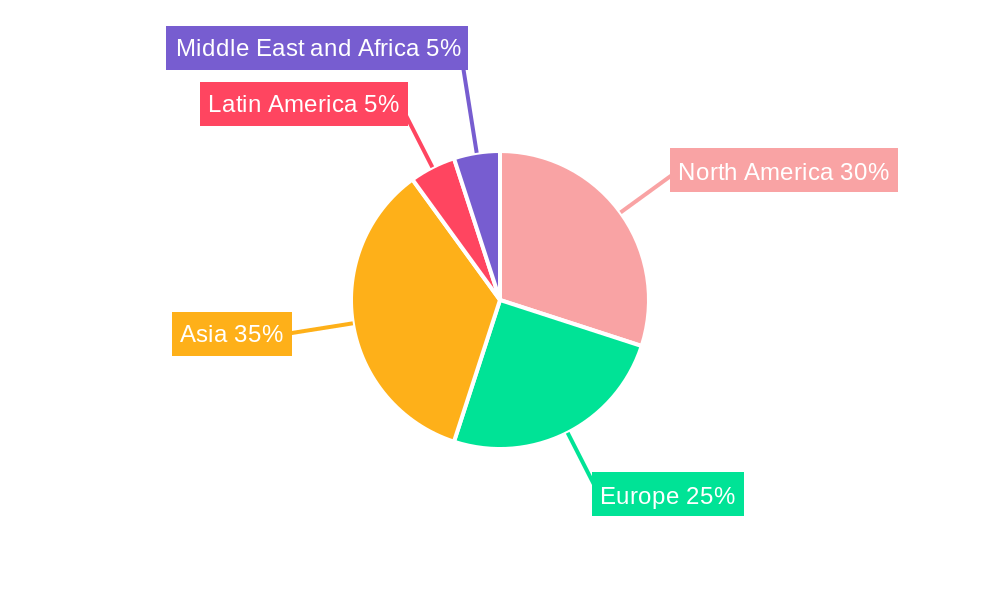
The global mobile crushers and screens market, valued at $3.10 billion in 2025, is projected to experience robust growth, driven by the increasing demand for infrastructure development and construction projects worldwide. A Compound Annual Growth Rate (CAGR) of 5.68% from 2025 to 2033 indicates a significant expansion of the market. Key drivers include the rising need for efficient and cost-effective material processing in mining, aggregate production, and recycling operations. The growing adoption of technologically advanced mobile crushers and screens, offering improved productivity, reduced operational costs, and enhanced safety features, further fuels market expansion. Market segmentation reveals a significant portion attributed to new equipment sales, while the refurbished segment contributes to a more cost-effective solution for smaller operations. Within machinery types, mobile crushers (jaw, cone, impact) dominate the market share due to their versatility and application across various industries. The mining and metallurgy sector is the largest end-user, followed by the aggregate processing industry. Geographically, North America and Europe currently hold significant market shares, with Asia-Pacific expected to witness the highest growth due to substantial infrastructure projects in developing economies like India and China. Competitive landscape analysis indicates a presence of both established multinational corporations and specialized regional players, resulting in a dynamic and innovative marketplace.
The continued growth trajectory is anticipated to be influenced by factors such as government regulations promoting sustainable construction practices and the increasing adoption of automation and data analytics in mobile crushing and screening operations. However, potential restraints include fluctuating raw material prices, economic downturns affecting construction and mining activities, and the increasing emphasis on environmentally friendly solutions, prompting innovation in emission reduction technologies. The market is expected to witness further consolidation through mergers and acquisitions, as companies strive to enhance their product portfolios and expand their global reach. Technological advancements will continue to shape the industry, with a focus on enhancing efficiency, reducing environmental impact, and optimizing the overall lifecycle cost of mobile crushers and screens.
This detailed report provides a comprehensive analysis of the global mobile crushers and screens industry, offering actionable insights for stakeholders across the value chain. The study period covers 2019-2033, with 2025 as the base and estimated year. The forecast period spans 2025-2033, and the historical period encompasses 2019-2024. The report projects a market value of $XX Billion by 2033.
Mobile Crushers and Screens Industry Market Concentration & Innovation
This section analyzes the competitive landscape, innovation drivers, regulatory influences, and market dynamics within the mobile crushers and screens industry. The market exhibits a moderately concentrated structure, with a few major players holding significant market share. Astec Industries Inc, Metso Corporation, and Sandvik AB are amongst the leading companies, collectively commanding an estimated xx% market share in 2025. However, smaller, specialized players like Tesab Engineering and Rubble Master HMH GmbH also contribute significantly to specific segments.
- Market Concentration: The Herfindahl-Hirschman Index (HHI) is estimated at xx, indicating a moderately concentrated market.
- Innovation Drivers: Technological advancements in crushing and screening technologies, including automation, improved efficiency, and reduced environmental impact, are key drivers of innovation.
- Regulatory Frameworks: Environmental regulations concerning dust emission and noise pollution significantly influence product design and adoption. Stringent safety standards also impact the industry's operational practices.
- Product Substitutes: Limited direct substitutes exist, although alternative material handling and processing methods, such as stationary crushing plants, offer some competition in specific applications.
- End-User Trends: The growing demand for infrastructure development and construction projects, particularly in developing economies, fuels market growth.
- M&A Activities: The past five years have witnessed a moderate level of M&A activity, with deal values averaging approximately $xx million per transaction. These activities are largely driven by efforts to expand geographic reach and enhance product portfolios.
Mobile Crushers and Screens Industry Industry Trends & Insights
The mobile crushers and screens market is witnessing robust growth, driven by several factors. The global CAGR for the period 2025-2033 is projected to be xx%, indicating significant market expansion. Increased infrastructure spending across the globe, particularly in emerging markets, coupled with the rising demand for aggregates in construction and mining activities, is a primary driver. Technological advancements like the incorporation of automation and digitalization are enhancing efficiency and productivity, leading to higher market penetration of advanced mobile crushers and screens. Consumer preferences are shifting towards sustainable and eco-friendly solutions, prompting manufacturers to develop and introduce greener technologies. Competitive dynamics are characterized by intense competition, particularly amongst major players, driving continuous product improvement and innovation to secure market share. Market penetration of electric and hybrid models is increasing, although traditional models still dominate the market. Overall, technological disruptions are reshaping the industry, favoring companies that can effectively integrate these advancements into their offerings.
Dominant Markets & Segments in Mobile Crushers and Screens Industry
The Asia-Pacific region holds a leading position in the global mobile crushers and screens market, driven by strong infrastructure development activities and rapid industrialization in countries like China and India. Within the market segmentation:
- By Type: The new mobile crushers and screeners segment is projected to maintain its dominance due to advancements in technology and demand for enhanced efficiency. However, the refurbished segment also holds considerable potential, particularly in cost-sensitive markets.
- By Machinery Type: Mobile crushers (jaw, cone, impact, etc.) currently constitute a larger segment compared to mobile screeners (vibratory, gyratory, etc.). This is likely to continue in the forecast period, although the adoption of advanced screening technologies is predicted to drive growth in the screener segment.
- By End-user Industry: The mining and metallurgy sector is a major consumer of mobile crushers and screens, accounting for a significant market share. The aggregate processing industry constitutes the second largest segment. Other end-user industries, including construction and recycling, also contribute to the market's overall growth.
Key Drivers:
- Strong Economic Growth: Sustained economic expansion in developing nations fuels infrastructure investments.
- Government Infrastructure Projects: Large-scale infrastructure projects are driving demand for efficient material processing solutions.
- Mining Boom: Growth in mining activities across several regions increases the need for mobile crushing and screening equipment.
- Construction Boom: The continuous rise in construction projects particularly in developing economies creates significant demand.
Mobile Crushers and Screens Industry Product Developments
Recent product innovations focus on enhanced efficiency, reduced environmental impact, and improved safety features. Manufacturers are increasingly integrating automation, digitalization, and data analytics to improve operational efficiency, reduce downtime, and optimize performance. Technological trends include the development of more fuel-efficient and sustainable models, incorporating electric and hybrid powertrains. This focus is driven by the market's increasing demand for eco-friendly solutions that align with global sustainability goals. The market fit for these innovations is high due to regulatory pressure and consumer preference for sustainable solutions.
Report Scope & Segmentation Analysis
This report covers the global mobile crushers and screens market, segmented by type (new and refurbished), machinery type (mobile crushers and mobile screeners), and end-user industry (mining and metallurgy, aggregate processing, and other end-user industries). Each segment's growth projection, market size, and competitive dynamics are analyzed in detail within the report.
By Type: The market is segmented into new and refurbished mobile crushers and screens. The new segment is expected to exhibit higher growth rates due to technological advancements, while the refurbished market offers a cost-effective alternative.
By Machinery Type: The market is categorized into mobile crushers (jaw, cone, impact, etc.) and mobile screeners (vibratory, gyratory, etc.). Both segments are analyzed with respect to their specific applications, technological advancements, and market dynamics.
By End-User Industry: The analysis covers the mining and metallurgy, aggregate processing, and other end-user industries' demand for mobile crushers and screens. Each industry segment's growth drivers and specific requirements are addressed.
Key Drivers of Mobile Crushers and Screens Industry Growth
Several key factors drive the growth of the mobile crushers and screens industry. Firstly, the increasing demand for infrastructure development and construction activities globally, especially in emerging economies, is a primary driver. Secondly, the booming mining and quarrying industries further fuel market expansion by requiring efficient materials processing solutions. Finally, technological advancements such as automation, digitization, and the development of more fuel-efficient models also contribute significantly. Government initiatives to promote sustainable infrastructure development also play a crucial role.
Challenges in the Mobile Crushers and Screens Industry Sector
The industry faces challenges such as stringent environmental regulations leading to higher production costs and fluctuating raw material prices impacting profitability. Supply chain disruptions and increased competition, particularly from lower-cost manufacturers, are also factors affecting the industry's growth. The increased cost of raw materials and the volatile nature of the global supply chain are also expected to impact the market in the forecast period.
Emerging Opportunities in Mobile Crushers and Screens Industry
Emerging opportunities exist in the development and adoption of sustainable and eco-friendly mobile crushers and screens, as well as the integration of advanced technologies like artificial intelligence and machine learning. Expanding into new and emerging markets and providing tailored solutions for specific applications present additional growth opportunities. The increasing adoption of electric and hybrid powertrains to lower carbon emissions offers an important area of development.
Leading Players in the Mobile Crushers and Screens Industry Market
- Astec Industries Inc
- Metso Corporation
- Tesab Engineering Ltd
- CDE Global
- Portafill International Ltd
- Kleemann GmbH (Wirtgen Group)
- SBM Mineral Processing GmbH
- Sandvik AB
- Rubble Master HMH GmbH
- McCloskey International Ltd
- IROCK Crushers
- Hartl Holding GmbH
- Komatsu Mining Corporation
- Terex Corporation
Key Developments in Mobile Crushers and Screens Industry Industry
- June 2023: Rubble Master Group (RM Group) opened a new subsidiary in Singapore, expanding its presence in Southeast Asia.
- June 2023: Tesab partnered with Maverick Environmental Equipment as an exclusive dealer in Michigan and Ohio, strengthening its presence in the American market.
Strategic Outlook for Mobile Crushers and Screens Industry Market
The mobile crushers and screens market is poised for significant growth, driven by sustained infrastructure development, technological advancements, and increasing demand from key end-user industries. Focus on sustainability and the development of innovative solutions will be crucial for success in this dynamic market. The market is expected to witness substantial growth in the coming years, driven by increasing investment in infrastructure development and the growth of the mining and construction industries.
Mobile Crushers and Screens Industry Segmentation
-
1. Type
- 1.1. New
- 1.2. Refurbished
-
2. Machinery Type
- 2.1. Mobile Crusher (Jaw, Cone, Impact, etc.)
- 2.2. Mobile Screener (Vibratory, Gyratory, etc.)
-
3. End-user Industry
- 3.1. Mining and Metallurgy
- 3.2. Aggregate Processing
- 3.3. Other End-user Industries
Mobile Crushers and Screens Industry Segmentation By Geography
-
1. North America
- 1.1. United States
- 1.2. Canada
-
2. Europe
- 2.1. Germany
- 2.2. United Kingdom
- 2.3. France
-
3. Asia
- 3.1. China
- 3.2. India
- 3.3. Japan
- 3.4. Australia and New Zealand
- 4. Latin America
- 5. Middle East and Africa
Mobile Crushers and Screens Industry REPORT HIGHLIGHTS
| Aspects | Details |
|---|---|
| Study Period | 2019-2033 |
| Base Year | 2024 |
| Estimated Year | 2025 |
| Forecast Period | 2025-2033 |
| Historical Period | 2019-2024 |
| Growth Rate | CAGR of 5.68% from 2019-2033 |
| Segmentation |
|
Table of Contents
- 1. Introduction
- 1.1. Research Scope
- 1.2. Market Segmentation
- 1.3. Research Methodology
- 1.4. Definitions and Assumptions
- 2. Executive Summary
- 2.1. Introduction
- 3. Market Dynamics
- 3.1. Introduction
- 3.2. Market Drivers
- 3.2.1. Demand for Reduced Transportation Costs and Greater Flexibility in Machinery of the Mining Industry; Rise of the Construction Industry Due to Rapid Urbanization
- 3.3. Market Restrains
- 3.3.1. Effects of Carbon Emission from Machinery
- 3.4. Market Trends
- 3.4.1. Aggregate Processing to be the Largest End-user Industry
- 4. Market Factor Analysis
- 4.1. Porters Five Forces
- 4.2. Supply/Value Chain
- 4.3. PESTEL analysis
- 4.4. Market Entropy
- 4.5. Patent/Trademark Analysis
- 5. Global Mobile Crushers and Screens Industry Analysis, Insights and Forecast, 2019-2031
- 5.1. Market Analysis, Insights and Forecast - by Type
- 5.1.1. New
- 5.1.2. Refurbished
- 5.2. Market Analysis, Insights and Forecast - by Machinery Type
- 5.2.1. Mobile Crusher (Jaw, Cone, Impact, etc.)
- 5.2.2. Mobile Screener (Vibratory, Gyratory, etc.)
- 5.3. Market Analysis, Insights and Forecast - by End-user Industry
- 5.3.1. Mining and Metallurgy
- 5.3.2. Aggregate Processing
- 5.3.3. Other End-user Industries
- 5.4. Market Analysis, Insights and Forecast - by Region
- 5.4.1. North America
- 5.4.2. Europe
- 5.4.3. Asia
- 5.4.4. Latin America
- 5.4.5. Middle East and Africa
- 5.1. Market Analysis, Insights and Forecast - by Type
- 6. North America Mobile Crushers and Screens Industry Analysis, Insights and Forecast, 2019-2031
- 6.1. Market Analysis, Insights and Forecast - by Type
- 6.1.1. New
- 6.1.2. Refurbished
- 6.2. Market Analysis, Insights and Forecast - by Machinery Type
- 6.2.1. Mobile Crusher (Jaw, Cone, Impact, etc.)
- 6.2.2. Mobile Screener (Vibratory, Gyratory, etc.)
- 6.3. Market Analysis, Insights and Forecast - by End-user Industry
- 6.3.1. Mining and Metallurgy
- 6.3.2. Aggregate Processing
- 6.3.3. Other End-user Industries
- 6.1. Market Analysis, Insights and Forecast - by Type
- 7. Europe Mobile Crushers and Screens Industry Analysis, Insights and Forecast, 2019-2031
- 7.1. Market Analysis, Insights and Forecast - by Type
- 7.1.1. New
- 7.1.2. Refurbished
- 7.2. Market Analysis, Insights and Forecast - by Machinery Type
- 7.2.1. Mobile Crusher (Jaw, Cone, Impact, etc.)
- 7.2.2. Mobile Screener (Vibratory, Gyratory, etc.)
- 7.3. Market Analysis, Insights and Forecast - by End-user Industry
- 7.3.1. Mining and Metallurgy
- 7.3.2. Aggregate Processing
- 7.3.3. Other End-user Industries
- 7.1. Market Analysis, Insights and Forecast - by Type
- 8. Asia Mobile Crushers and Screens Industry Analysis, Insights and Forecast, 2019-2031
- 8.1. Market Analysis, Insights and Forecast - by Type
- 8.1.1. New
- 8.1.2. Refurbished
- 8.2. Market Analysis, Insights and Forecast - by Machinery Type
- 8.2.1. Mobile Crusher (Jaw, Cone, Impact, etc.)
- 8.2.2. Mobile Screener (Vibratory, Gyratory, etc.)
- 8.3. Market Analysis, Insights and Forecast - by End-user Industry
- 8.3.1. Mining and Metallurgy
- 8.3.2. Aggregate Processing
- 8.3.3. Other End-user Industries
- 8.1. Market Analysis, Insights and Forecast - by Type
- 9. Latin America Mobile Crushers and Screens Industry Analysis, Insights and Forecast, 2019-2031
- 9.1. Market Analysis, Insights and Forecast - by Type
- 9.1.1. New
- 9.1.2. Refurbished
- 9.2. Market Analysis, Insights and Forecast - by Machinery Type
- 9.2.1. Mobile Crusher (Jaw, Cone, Impact, etc.)
- 9.2.2. Mobile Screener (Vibratory, Gyratory, etc.)
- 9.3. Market Analysis, Insights and Forecast - by End-user Industry
- 9.3.1. Mining and Metallurgy
- 9.3.2. Aggregate Processing
- 9.3.3. Other End-user Industries
- 9.1. Market Analysis, Insights and Forecast - by Type
- 10. Middle East and Africa Mobile Crushers and Screens Industry Analysis, Insights and Forecast, 2019-2031
- 10.1. Market Analysis, Insights and Forecast - by Type
- 10.1.1. New
- 10.1.2. Refurbished
- 10.2. Market Analysis, Insights and Forecast - by Machinery Type
- 10.2.1. Mobile Crusher (Jaw, Cone, Impact, etc.)
- 10.2.2. Mobile Screener (Vibratory, Gyratory, etc.)
- 10.3. Market Analysis, Insights and Forecast - by End-user Industry
- 10.3.1. Mining and Metallurgy
- 10.3.2. Aggregate Processing
- 10.3.3. Other End-user Industries
- 10.1. Market Analysis, Insights and Forecast - by Type
- 11. North America Mobile Crushers and Screens Industry Analysis, Insights and Forecast, 2019-2031
- 11.1. Market Analysis, Insights and Forecast - By Country/Sub-region
- 11.1.1 United States
- 11.1.2 Canada
- 12. Europe Mobile Crushers and Screens Industry Analysis, Insights and Forecast, 2019-2031
- 12.1. Market Analysis, Insights and Forecast - By Country/Sub-region
- 12.1.1 Germany
- 12.1.2 United Kingdom
- 12.1.3 France
- 13. Asia Mobile Crushers and Screens Industry Analysis, Insights and Forecast, 2019-2031
- 13.1. Market Analysis, Insights and Forecast - By Country/Sub-region
- 13.1.1 China
- 13.1.2 India
- 13.1.3 Japan
- 13.1.4 Australia and New Zealand
- 14. Latin America Mobile Crushers and Screens Industry Analysis, Insights and Forecast, 2019-2031
- 14.1. Market Analysis, Insights and Forecast - By Country/Sub-region
- 14.1.1.
- 15. Middle East and Africa Mobile Crushers and Screens Industry Analysis, Insights and Forecast, 2019-2031
- 15.1. Market Analysis, Insights and Forecast - By Country/Sub-region
- 15.1.1.
- 16. Competitive Analysis
- 16.1. Global Market Share Analysis 2024
- 16.2. Company Profiles
- 16.2.1 Astec Industries Inc *List Not Exhaustive
- 16.2.1.1. Overview
- 16.2.1.2. Products
- 16.2.1.3. SWOT Analysis
- 16.2.1.4. Recent Developments
- 16.2.1.5. Financials (Based on Availability)
- 16.2.2 Metso Corporation
- 16.2.2.1. Overview
- 16.2.2.2. Products
- 16.2.2.3. SWOT Analysis
- 16.2.2.4. Recent Developments
- 16.2.2.5. Financials (Based on Availability)
- 16.2.3 Tesab Engineering Ltd
- 16.2.3.1. Overview
- 16.2.3.2. Products
- 16.2.3.3. SWOT Analysis
- 16.2.3.4. Recent Developments
- 16.2.3.5. Financials (Based on Availability)
- 16.2.4 CDE Global
- 16.2.4.1. Overview
- 16.2.4.2. Products
- 16.2.4.3. SWOT Analysis
- 16.2.4.4. Recent Developments
- 16.2.4.5. Financials (Based on Availability)
- 16.2.5 Portafill International Ltd
- 16.2.5.1. Overview
- 16.2.5.2. Products
- 16.2.5.3. SWOT Analysis
- 16.2.5.4. Recent Developments
- 16.2.5.5. Financials (Based on Availability)
- 16.2.6 Kleemann GmbH (Wirtgen Group)
- 16.2.6.1. Overview
- 16.2.6.2. Products
- 16.2.6.3. SWOT Analysis
- 16.2.6.4. Recent Developments
- 16.2.6.5. Financials (Based on Availability)
- 16.2.7 SBM Mineral Processing GmbH
- 16.2.7.1. Overview
- 16.2.7.2. Products
- 16.2.7.3. SWOT Analysis
- 16.2.7.4. Recent Developments
- 16.2.7.5. Financials (Based on Availability)
- 16.2.8 Sandvik AB
- 16.2.8.1. Overview
- 16.2.8.2. Products
- 16.2.8.3. SWOT Analysis
- 16.2.8.4. Recent Developments
- 16.2.8.5. Financials (Based on Availability)
- 16.2.9 Rubble Master HMH GmbH
- 16.2.9.1. Overview
- 16.2.9.2. Products
- 16.2.9.3. SWOT Analysis
- 16.2.9.4. Recent Developments
- 16.2.9.5. Financials (Based on Availability)
- 16.2.10 McCloskey International Ltd
- 16.2.10.1. Overview
- 16.2.10.2. Products
- 16.2.10.3. SWOT Analysis
- 16.2.10.4. Recent Developments
- 16.2.10.5. Financials (Based on Availability)
- 16.2.11 IROCK Crushers
- 16.2.11.1. Overview
- 16.2.11.2. Products
- 16.2.11.3. SWOT Analysis
- 16.2.11.4. Recent Developments
- 16.2.11.5. Financials (Based on Availability)
- 16.2.12 Hartl Holding GmbH
- 16.2.12.1. Overview
- 16.2.12.2. Products
- 16.2.12.3. SWOT Analysis
- 16.2.12.4. Recent Developments
- 16.2.12.5. Financials (Based on Availability)
- 16.2.13 Komatsu Mining Corporation
- 16.2.13.1. Overview
- 16.2.13.2. Products
- 16.2.13.3. SWOT Analysis
- 16.2.13.4. Recent Developments
- 16.2.13.5. Financials (Based on Availability)
- 16.2.14 Terex Corporation
- 16.2.14.1. Overview
- 16.2.14.2. Products
- 16.2.14.3. SWOT Analysis
- 16.2.14.4. Recent Developments
- 16.2.14.5. Financials (Based on Availability)
- 16.2.1 Astec Industries Inc *List Not Exhaustive
List of Figures
- Figure 1: Global Mobile Crushers and Screens Industry Revenue Breakdown (Million, %) by Region 2024 & 2032
- Figure 2: North America Mobile Crushers and Screens Industry Revenue (Million), by Country 2024 & 2032
- Figure 3: North America Mobile Crushers and Screens Industry Revenue Share (%), by Country 2024 & 2032
- Figure 4: Europe Mobile Crushers and Screens Industry Revenue (Million), by Country 2024 & 2032
- Figure 5: Europe Mobile Crushers and Screens Industry Revenue Share (%), by Country 2024 & 2032
- Figure 6: Asia Mobile Crushers and Screens Industry Revenue (Million), by Country 2024 & 2032
- Figure 7: Asia Mobile Crushers and Screens Industry Revenue Share (%), by Country 2024 & 2032
- Figure 8: Latin America Mobile Crushers and Screens Industry Revenue (Million), by Country 2024 & 2032
- Figure 9: Latin America Mobile Crushers and Screens Industry Revenue Share (%), by Country 2024 & 2032
- Figure 10: Middle East and Africa Mobile Crushers and Screens Industry Revenue (Million), by Country 2024 & 2032
- Figure 11: Middle East and Africa Mobile Crushers and Screens Industry Revenue Share (%), by Country 2024 & 2032
- Figure 12: North America Mobile Crushers and Screens Industry Revenue (Million), by Type 2024 & 2032
- Figure 13: North America Mobile Crushers and Screens Industry Revenue Share (%), by Type 2024 & 2032
- Figure 14: North America Mobile Crushers and Screens Industry Revenue (Million), by Machinery Type 2024 & 2032
- Figure 15: North America Mobile Crushers and Screens Industry Revenue Share (%), by Machinery Type 2024 & 2032
- Figure 16: North America Mobile Crushers and Screens Industry Revenue (Million), by End-user Industry 2024 & 2032
- Figure 17: North America Mobile Crushers and Screens Industry Revenue Share (%), by End-user Industry 2024 & 2032
- Figure 18: North America Mobile Crushers and Screens Industry Revenue (Million), by Country 2024 & 2032
- Figure 19: North America Mobile Crushers and Screens Industry Revenue Share (%), by Country 2024 & 2032
- Figure 20: Europe Mobile Crushers and Screens Industry Revenue (Million), by Type 2024 & 2032
- Figure 21: Europe Mobile Crushers and Screens Industry Revenue Share (%), by Type 2024 & 2032
- Figure 22: Europe Mobile Crushers and Screens Industry Revenue (Million), by Machinery Type 2024 & 2032
- Figure 23: Europe Mobile Crushers and Screens Industry Revenue Share (%), by Machinery Type 2024 & 2032
- Figure 24: Europe Mobile Crushers and Screens Industry Revenue (Million), by End-user Industry 2024 & 2032
- Figure 25: Europe Mobile Crushers and Screens Industry Revenue Share (%), by End-user Industry 2024 & 2032
- Figure 26: Europe Mobile Crushers and Screens Industry Revenue (Million), by Country 2024 & 2032
- Figure 27: Europe Mobile Crushers and Screens Industry Revenue Share (%), by Country 2024 & 2032
- Figure 28: Asia Mobile Crushers and Screens Industry Revenue (Million), by Type 2024 & 2032
- Figure 29: Asia Mobile Crushers and Screens Industry Revenue Share (%), by Type 2024 & 2032
- Figure 30: Asia Mobile Crushers and Screens Industry Revenue (Million), by Machinery Type 2024 & 2032
- Figure 31: Asia Mobile Crushers and Screens Industry Revenue Share (%), by Machinery Type 2024 & 2032
- Figure 32: Asia Mobile Crushers and Screens Industry Revenue (Million), by End-user Industry 2024 & 2032
- Figure 33: Asia Mobile Crushers and Screens Industry Revenue Share (%), by End-user Industry 2024 & 2032
- Figure 34: Asia Mobile Crushers and Screens Industry Revenue (Million), by Country 2024 & 2032
- Figure 35: Asia Mobile Crushers and Screens Industry Revenue Share (%), by Country 2024 & 2032
- Figure 36: Latin America Mobile Crushers and Screens Industry Revenue (Million), by Type 2024 & 2032
- Figure 37: Latin America Mobile Crushers and Screens Industry Revenue Share (%), by Type 2024 & 2032
- Figure 38: Latin America Mobile Crushers and Screens Industry Revenue (Million), by Machinery Type 2024 & 2032
- Figure 39: Latin America Mobile Crushers and Screens Industry Revenue Share (%), by Machinery Type 2024 & 2032
- Figure 40: Latin America Mobile Crushers and Screens Industry Revenue (Million), by End-user Industry 2024 & 2032
- Figure 41: Latin America Mobile Crushers and Screens Industry Revenue Share (%), by End-user Industry 2024 & 2032
- Figure 42: Latin America Mobile Crushers and Screens Industry Revenue (Million), by Country 2024 & 2032
- Figure 43: Latin America Mobile Crushers and Screens Industry Revenue Share (%), by Country 2024 & 2032
- Figure 44: Middle East and Africa Mobile Crushers and Screens Industry Revenue (Million), by Type 2024 & 2032
- Figure 45: Middle East and Africa Mobile Crushers and Screens Industry Revenue Share (%), by Type 2024 & 2032
- Figure 46: Middle East and Africa Mobile Crushers and Screens Industry Revenue (Million), by Machinery Type 2024 & 2032
- Figure 47: Middle East and Africa Mobile Crushers and Screens Industry Revenue Share (%), by Machinery Type 2024 & 2032
- Figure 48: Middle East and Africa Mobile Crushers and Screens Industry Revenue (Million), by End-user Industry 2024 & 2032
- Figure 49: Middle East and Africa Mobile Crushers and Screens Industry Revenue Share (%), by End-user Industry 2024 & 2032
- Figure 50: Middle East and Africa Mobile Crushers and Screens Industry Revenue (Million), by Country 2024 & 2032
- Figure 51: Middle East and Africa Mobile Crushers and Screens Industry Revenue Share (%), by Country 2024 & 2032
List of Tables
- Table 1: Global Mobile Crushers and Screens Industry Revenue Million Forecast, by Region 2019 & 2032
- Table 2: Global Mobile Crushers and Screens Industry Revenue Million Forecast, by Type 2019 & 2032
- Table 3: Global Mobile Crushers and Screens Industry Revenue Million Forecast, by Machinery Type 2019 & 2032
- Table 4: Global Mobile Crushers and Screens Industry Revenue Million Forecast, by End-user Industry 2019 & 2032
- Table 5: Global Mobile Crushers and Screens Industry Revenue Million Forecast, by Region 2019 & 2032
- Table 6: Global Mobile Crushers and Screens Industry Revenue Million Forecast, by Country 2019 & 2032
- Table 7: United States Mobile Crushers and Screens Industry Revenue (Million) Forecast, by Application 2019 & 2032
- Table 8: Canada Mobile Crushers and Screens Industry Revenue (Million) Forecast, by Application 2019 & 2032
- Table 9: Global Mobile Crushers and Screens Industry Revenue Million Forecast, by Country 2019 & 2032
- Table 10: Germany Mobile Crushers and Screens Industry Revenue (Million) Forecast, by Application 2019 & 2032
- Table 11: United Kingdom Mobile Crushers and Screens Industry Revenue (Million) Forecast, by Application 2019 & 2032
- Table 12: France Mobile Crushers and Screens Industry Revenue (Million) Forecast, by Application 2019 & 2032
- Table 13: Global Mobile Crushers and Screens Industry Revenue Million Forecast, by Country 2019 & 2032
- Table 14: China Mobile Crushers and Screens Industry Revenue (Million) Forecast, by Application 2019 & 2032
- Table 15: India Mobile Crushers and Screens Industry Revenue (Million) Forecast, by Application 2019 & 2032
- Table 16: Japan Mobile Crushers and Screens Industry Revenue (Million) Forecast, by Application 2019 & 2032
- Table 17: Australia and New Zealand Mobile Crushers and Screens Industry Revenue (Million) Forecast, by Application 2019 & 2032
- Table 18: Global Mobile Crushers and Screens Industry Revenue Million Forecast, by Country 2019 & 2032
- Table 19: Mobile Crushers and Screens Industry Revenue (Million) Forecast, by Application 2019 & 2032
- Table 20: Global Mobile Crushers and Screens Industry Revenue Million Forecast, by Country 2019 & 2032
- Table 21: Mobile Crushers and Screens Industry Revenue (Million) Forecast, by Application 2019 & 2032
- Table 22: Global Mobile Crushers and Screens Industry Revenue Million Forecast, by Type 2019 & 2032
- Table 23: Global Mobile Crushers and Screens Industry Revenue Million Forecast, by Machinery Type 2019 & 2032
- Table 24: Global Mobile Crushers and Screens Industry Revenue Million Forecast, by End-user Industry 2019 & 2032
- Table 25: Global Mobile Crushers and Screens Industry Revenue Million Forecast, by Country 2019 & 2032
- Table 26: United States Mobile Crushers and Screens Industry Revenue (Million) Forecast, by Application 2019 & 2032
- Table 27: Canada Mobile Crushers and Screens Industry Revenue (Million) Forecast, by Application 2019 & 2032
- Table 28: Global Mobile Crushers and Screens Industry Revenue Million Forecast, by Type 2019 & 2032
- Table 29: Global Mobile Crushers and Screens Industry Revenue Million Forecast, by Machinery Type 2019 & 2032
- Table 30: Global Mobile Crushers and Screens Industry Revenue Million Forecast, by End-user Industry 2019 & 2032
- Table 31: Global Mobile Crushers and Screens Industry Revenue Million Forecast, by Country 2019 & 2032
- Table 32: Germany Mobile Crushers and Screens Industry Revenue (Million) Forecast, by Application 2019 & 2032
- Table 33: United Kingdom Mobile Crushers and Screens Industry Revenue (Million) Forecast, by Application 2019 & 2032
- Table 34: France Mobile Crushers and Screens Industry Revenue (Million) Forecast, by Application 2019 & 2032
- Table 35: Global Mobile Crushers and Screens Industry Revenue Million Forecast, by Type 2019 & 2032
- Table 36: Global Mobile Crushers and Screens Industry Revenue Million Forecast, by Machinery Type 2019 & 2032
- Table 37: Global Mobile Crushers and Screens Industry Revenue Million Forecast, by End-user Industry 2019 & 2032
- Table 38: Global Mobile Crushers and Screens Industry Revenue Million Forecast, by Country 2019 & 2032
- Table 39: China Mobile Crushers and Screens Industry Revenue (Million) Forecast, by Application 2019 & 2032
- Table 40: India Mobile Crushers and Screens Industry Revenue (Million) Forecast, by Application 2019 & 2032
- Table 41: Japan Mobile Crushers and Screens Industry Revenue (Million) Forecast, by Application 2019 & 2032
- Table 42: Australia and New Zealand Mobile Crushers and Screens Industry Revenue (Million) Forecast, by Application 2019 & 2032
- Table 43: Global Mobile Crushers and Screens Industry Revenue Million Forecast, by Type 2019 & 2032
- Table 44: Global Mobile Crushers and Screens Industry Revenue Million Forecast, by Machinery Type 2019 & 2032
- Table 45: Global Mobile Crushers and Screens Industry Revenue Million Forecast, by End-user Industry 2019 & 2032
- Table 46: Global Mobile Crushers and Screens Industry Revenue Million Forecast, by Country 2019 & 2032
- Table 47: Global Mobile Crushers and Screens Industry Revenue Million Forecast, by Type 2019 & 2032
- Table 48: Global Mobile Crushers and Screens Industry Revenue Million Forecast, by Machinery Type 2019 & 2032
- Table 49: Global Mobile Crushers and Screens Industry Revenue Million Forecast, by End-user Industry 2019 & 2032
- Table 50: Global Mobile Crushers and Screens Industry Revenue Million Forecast, by Country 2019 & 2032
Frequently Asked Questions
1. What is the projected Compound Annual Growth Rate (CAGR) of the Mobile Crushers and Screens Industry?
The projected CAGR is approximately 5.68%.
2. Which companies are prominent players in the Mobile Crushers and Screens Industry?
Key companies in the market include Astec Industries Inc *List Not Exhaustive, Metso Corporation, Tesab Engineering Ltd, CDE Global, Portafill International Ltd, Kleemann GmbH (Wirtgen Group), SBM Mineral Processing GmbH, Sandvik AB, Rubble Master HMH GmbH, McCloskey International Ltd, IROCK Crushers, Hartl Holding GmbH, Komatsu Mining Corporation, Terex Corporation.
3. What are the main segments of the Mobile Crushers and Screens Industry?
The market segments include Type, Machinery Type, End-user Industry.
4. Can you provide details about the market size?
The market size is estimated to be USD 3.10 Million as of 2022.
5. What are some drivers contributing to market growth?
Demand for Reduced Transportation Costs and Greater Flexibility in Machinery of the Mining Industry; Rise of the Construction Industry Due to Rapid Urbanization.
6. What are the notable trends driving market growth?
Aggregate Processing to be the Largest End-user Industry.
7. Are there any restraints impacting market growth?
Effects of Carbon Emission from Machinery.
8. Can you provide examples of recent developments in the market?
June 2023: Rubble Master Group (RM Group) expanded its presence in the Southeast Asian market by opening a new subsidiary in Singapore. This will further strengthen the network of companies in Southeast Asia and across Asia to build closer relations with their dealers and customers.
9. What pricing options are available for accessing the report?
Pricing options include single-user, multi-user, and enterprise licenses priced at USD 4750, USD 5250, and USD 8750 respectively.
10. Is the market size provided in terms of value or volume?
The market size is provided in terms of value, measured in Million.
11. Are there any specific market keywords associated with the report?
Yes, the market keyword associated with the report is "Mobile Crushers and Screens Industry," which aids in identifying and referencing the specific market segment covered.
12. How do I determine which pricing option suits my needs best?
The pricing options vary based on user requirements and access needs. Individual users may opt for single-user licenses, while businesses requiring broader access may choose multi-user or enterprise licenses for cost-effective access to the report.
13. Are there any additional resources or data provided in the Mobile Crushers and Screens Industry report?
While the report offers comprehensive insights, it's advisable to review the specific contents or supplementary materials provided to ascertain if additional resources or data are available.
14. How can I stay updated on further developments or reports in the Mobile Crushers and Screens Industry?
To stay informed about further developments, trends, and reports in the Mobile Crushers and Screens Industry, consider subscribing to industry newsletters, following relevant companies and organizations, or regularly checking reputable industry news sources and publications.
Methodology
Step 1 - Identification of Relevant Samples Size from Population Database


Step 2 - Approaches for Defining Global Market Size (Value, Volume* & Price*)

Note*: In applicable scenarios
Step 3 - Data Sources
Primary Research
- Web Analytics
- Survey Reports
- Research Institute
- Latest Research Reports
- Opinion Leaders
Secondary Research
- Annual Reports
- White Paper
- Latest Press Release
- Industry Association
- Paid Database
- Investor Presentations

Step 4 - Data Triangulation
Involves using different sources of information in order to increase the validity of a study
These sources are likely to be stakeholders in a program - participants, other researchers, program staff, other community members, and so on.
Then we put all data in single framework & apply various statistical tools to find out the dynamic on the market.
During the analysis stage, feedback from the stakeholder groups would be compared to determine areas of agreement as well as areas of divergence


