

Key Insights
The monoclonal antibody therapy market is experiencing significant expansion, driven by the rising incidence of chronic conditions including cancer, autoimmune disorders, and hematological diseases. The market is projected to grow at a CAGR of 16.24%, reaching a market size of $264.33 billion by 2025. Key growth drivers include advancements in biotechnology, increased R&D investments, and enhanced awareness of the therapeutic benefits. The market is segmented by application (hematological diseases, autoimmune diseases, cancer, others), source (human, humanized, chimeric, others), and end-user (hospitals, private clinics, others).
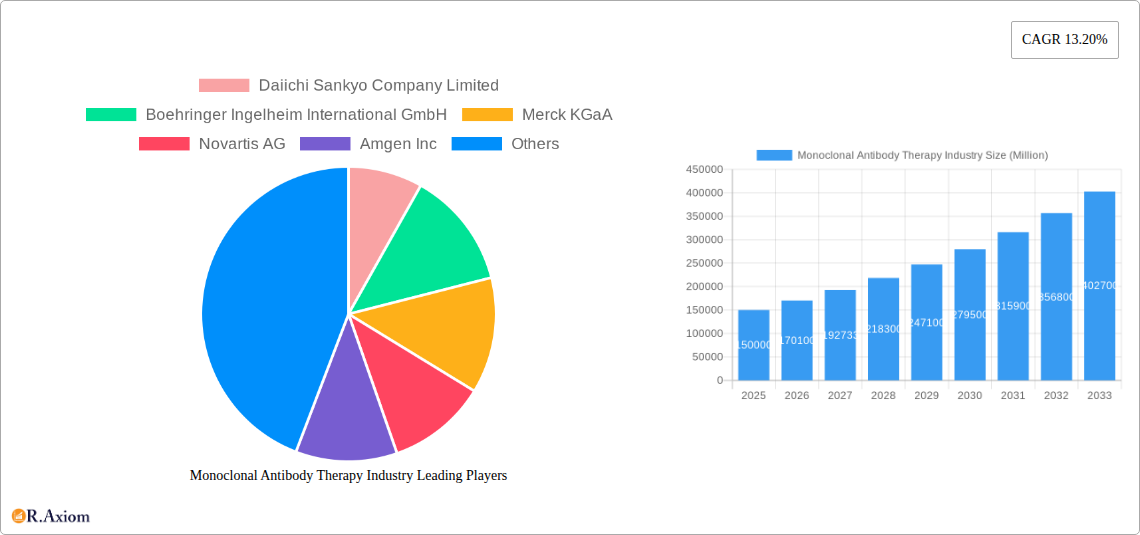
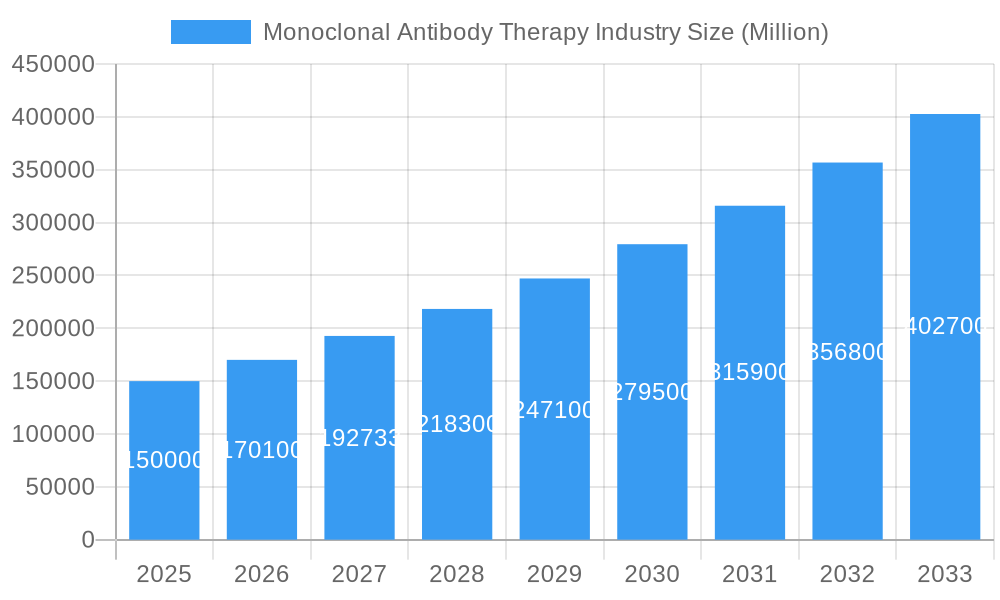
Monoclonal Antibody Therapy Industry Market Size (In Billion)
Competitive intensity in the monoclonal antibody therapy sector is high, featuring major pharmaceutical corporations such as Daiichi Sankyo, Boehringer Ingelheim, Merck KGaA, Novartis, Amgen, Roche, UCB, AbbVie, Johnson & Johnson, and Pfizer. The landscape is shaped by continuous innovation, strategic alliances, and a focus on developing novel therapies with superior efficacy and safety. Future growth will be influenced by regulatory approvals, pricing dynamics, and the introduction of biosimilars. Sustained investment in R&D, particularly in personalized and targeted medicine, will define the market's trajectory. Emerging markets in Asia and Africa present substantial expansion opportunities.
Monoclonal Antibody Therapy Industry Company Market Share
This report offers a comprehensive analysis of the global Monoclonal Antibody Therapy market, providing actionable insights for stakeholders. It examines market trends, competitive landscapes, and future growth prospects, with a focus on the period leading up to 2025. The market is segmented by application, source, and end-user, with in-depth analysis of key players' strategic initiatives and market positions.
Monoclonal Antibody Therapy Industry Market Concentration & Innovation
The monoclonal antibody therapy market is characterized by high concentration, with a few major players holding significant market share. The top 10 companies account for approximately xx% of the global market in 2025, with Amgen, Roche, and AbbVie leading the pack. This concentration is driven by substantial R&D investments, strong intellectual property portfolios, and extensive global distribution networks. However, the market also witnesses significant innovation, fueled by advancements in antibody engineering, targeted therapies, and personalized medicine.
- Market Share: Amgen: xx%; Roche: xx%; AbbVie: xx%; Others: xx% (2025 Estimate).
- Innovation Drivers: Advancements in antibody engineering (e.g., bispecific antibodies, antibody-drug conjugates), improved drug delivery systems, and growing understanding of disease mechanisms.
- Regulatory Framework: Stringent regulatory approvals influence market entry and product lifecycle. Variations in regulatory pathways across different geographies impact market access and pricing strategies.
- Product Substitutes: Alternative therapies, such as small molecule drugs and cell therapies, pose competitive pressures. However, the unique advantages of monoclonal antibodies in terms of specificity and efficacy maintain market dominance.
- End-User Trends: Growing prevalence of chronic diseases, increased demand for targeted therapies, and rising healthcare expenditure drive market growth across hospitals and private clinics.
- M&A Activities: The market has seen significant M&A activity in recent years, with deal values exceeding xx Million in 2024, driven by companies seeking to expand their product portfolios and market reach. Strategic partnerships and collaborations also play a crucial role in accelerating innovation and market expansion.
Monoclonal Antibody Therapy Industry Industry Trends & Insights
The global monoclonal antibody therapy market is experiencing robust growth, driven by a confluence of factors. The market exhibited a CAGR of xx% during the historical period (2019-2024) and is projected to maintain a CAGR of xx% during the forecast period (2025-2033). Technological disruptions, such as the development of next-generation antibody formats, are significantly impacting market dynamics. The increasing preference for targeted therapies that minimize side effects further fuels market expansion. Competitive dynamics remain intense, with companies investing heavily in R&D and strategic partnerships to gain a competitive edge. Market penetration is particularly high in developed economies, though emerging markets are showing increasing growth potential. The rising prevalence of chronic diseases, particularly cancer and autoimmune disorders, is a major market driver. Increased government funding for research and development of novel antibody therapies further contributes to market growth.
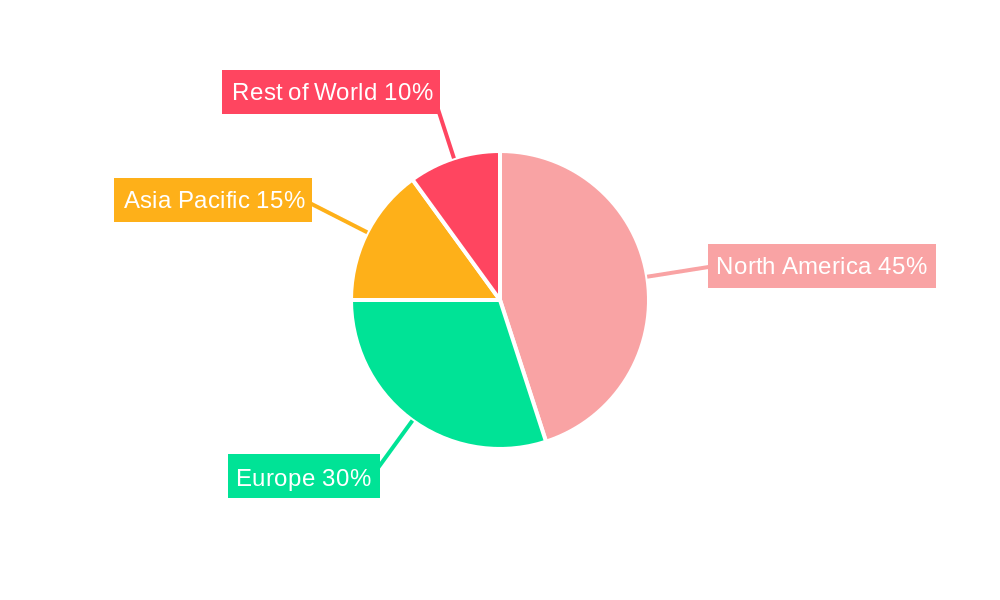
Dominant Markets & Segments in Monoclonal Antibody Therapy Industry
The North American region dominates the global monoclonal antibody therapy market, followed by Europe and Asia-Pacific. The high prevalence of chronic diseases, robust healthcare infrastructure, and high per capita healthcare expenditure contribute to the region's market dominance.
By Application:
- Cancer: Remains the largest segment due to the high prevalence of various cancer types and the effectiveness of monoclonal antibodies in targeted cancer therapies.
- Autoimmune Diseases: Shows strong growth potential due to the increasing incidence of autoimmune disorders and unmet medical needs.
- Hematological Diseases: This segment represents a significant market opportunity given the success of monoclonal antibodies in treating hematological malignancies.
By Source:
- Humanized Antibodies: Hold a dominant market share due to their improved efficacy and reduced immunogenicity compared to chimeric antibodies.
- Chimeric Antibodies: Retain a substantial market presence, offering a cost-effective alternative to fully human antibodies.
By End-user:
- Hospitals: The dominant end-user due to their extensive infrastructure, expertise, and patient volume.
- Private Clinics: Show significant growth potential due to increasing patient preference for specialized care.
Key drivers include supportive government policies, favorable reimbursement scenarios, well-established healthcare infrastructure, and high disposable incomes.
Monoclonal Antibody Therapy Industry Product Developments
Recent advancements in monoclonal antibody technology include the development of bispecific antibodies, antibody-drug conjugates (ADCs), and novel antibody engineering techniques to enhance efficacy and reduce side effects. These innovations are tailored to address unmet medical needs and improve patient outcomes across various therapeutic areas. The market is also witnessing the emergence of personalized medicine approaches, with monoclonal antibody therapies being customized based on individual genetic profiles. This trend fosters more targeted treatment strategies, improving effectiveness while reducing adverse reactions.
Report Scope & Segmentation Analysis
This report segments the monoclonal antibody therapy market by application, source, and end-user. Growth projections and competitive dynamics are analyzed for each segment. The report includes detailed market size estimations (in Million) for each segment across the historical, base, and forecast periods. Competitive landscapes with key players’ market shares are also provided for each segment.
Key Drivers of Monoclonal Antibody Therapy Industry Growth
The key drivers of monoclonal antibody therapy market growth include:
- Technological advancements: development of novel antibody formats and improved drug delivery systems.
- Rising prevalence of chronic diseases: increasing incidence of cancer, autoimmune disorders, and infectious diseases.
- Favorable regulatory environment: supportive regulatory frameworks promoting innovation and market access.
- Increased healthcare spending: rising healthcare expenditure in both developed and emerging economies.
Challenges in the Monoclonal Antibody Therapy Industry Sector
Challenges facing the industry include:
- High manufacturing costs: impacting affordability and accessibility.
- Immunogenicity concerns: potential for adverse immune responses.
- Regulatory hurdles: stringent approval processes and variations in regulatory pathways across different geographies.
- Intense competition: presence of multiple players and alternative therapies.
Emerging Opportunities in Monoclonal Antibody Therapy Industry
Emerging opportunities include:
- Expansion into emerging markets: significant unmet medical needs and growing healthcare infrastructure.
- Development of novel antibody formats: bispecific antibodies, ADCs, and other advanced formats.
- Personalized medicine: tailoring treatment to individual patient characteristics.
- Focus on early diagnosis and prevention: proactive approach to disease management.
Leading Players in the Monoclonal Antibody Therapy Industry Market
Key Developments in Monoclonal Antibody Therapy Industry Industry
- September 2022: AstraZeneca's Evusheld (tixagevimab and cilgavimab) received marketing authorization recommendation in the EU for treating high-risk COVID-19 patients. This expanded treatment options and strengthened AstraZeneca's position in the market.
- February 2022: The FDA issued an EUA for bebtelovimab (Eli Lilly), providing a crucial treatment option against the Omicron variant. This highlights the dynamic nature of the market in responding to emerging viral threats.
Strategic Outlook for Monoclonal Antibody Therapy Industry Market
The monoclonal antibody therapy market is poised for continued growth, driven by technological advancements, increasing prevalence of chronic diseases, and rising healthcare expenditure. The focus on personalized medicine and development of novel antibody formats will further shape market dynamics. Expansion into emerging markets presents significant opportunities for growth, while addressing challenges related to manufacturing costs and regulatory hurdles will be crucial for long-term success. The market's future trajectory indicates a promising outlook, with substantial potential for innovation and market expansion.
Monoclonal Antibody Therapy Industry Segmentation
-
1. Application
- 1.1. Hematological Diseases
- 1.2. Autoimmune Diseases
- 1.3. Cancer
- 1.4. Others
-
2. Source
- 2.1. Human
- 2.2. Humanized
- 2.3. Chimeric
- 2.4. Others
-
3. End-user
- 3.1. Hospitals
- 3.2. Private Clinics
- 3.3. Others
Monoclonal Antibody Therapy Industry Segmentation By Geography
-
1. North America
- 1.1. United States
- 1.2. Canada
- 1.3. Mexico
-
2. Europe
- 2.1. Germany
- 2.2. United Kingdom
- 2.3. France
- 2.4. Italy
- 2.5. Spain
- 2.6. Rest of Europe
-
3. Asia Pacific
- 3.1. China
- 3.2. Japan
- 3.3. India
- 3.4. Australia
- 3.5. South Korea
- 3.6. Rest of Asia Pacific
-
4. Middle East and Africa
- 4.1. GCC
- 4.2. South Africa
- 4.3. Rest of Middle East and Africa
-
5. South America
- 5.1. Brazil
- 5.2. Argentina
- 5.3. Rest of South America
Monoclonal Antibody Therapy Industry Regional Market Share
Geographic Coverage of Monoclonal Antibody Therapy Industry
Monoclonal Antibody Therapy Industry REPORT HIGHLIGHTS
| Aspects | Details |
|---|---|
| Study Period | 2020-2034 |
| Base Year | 2025 |
| Estimated Year | 2026 |
| Forecast Period | 2026-2034 |
| Historical Period | 2020-2025 |
| Growth Rate | CAGR of 16.24% from 2020-2034 |
| Segmentation |
|
Table of Contents
- 1. Introduction
- 1.1. Research Scope
- 1.2. Market Segmentation
- 1.3. Research Objective
- 1.4. Definitions and Assumptions
- 2. Executive Summary
- 2.1. Market Snapshot
- 3. Market Dynamics
- 3.1. Market Drivers
- 3.2. Market Restrains
- 3.3. Market Trends
- 3.4. Market Opportunities
- 4. Market Factor Analysis
- 4.1. Porters Five Forces
- 4.1.1. Bargaining Power of Suppliers
- 4.1.2. Bargaining Power of Buyers
- 4.1.3. Threat of New Entrants
- 4.1.4. Threat of Substitutes
- 4.1.5. Competitive Rivalry
- 4.2. PESTEL analysis
- 4.3. BCG Analysis
- 4.3.1. Stars (High Growth, High Market Share)
- 4.3.2. Cash Cows (Low Growth, High Market Share)
- 4.3.3. Question Mark (High Growth, Low Market Share)
- 4.3.4. Dogs (Low Growth, Low Market Share)
- 4.4. Ansoff Matrix Analysis
- 4.5. Supply Chain Analysis
- 4.6. Regulatory Landscape
- 4.7. Current Market Potential and Opportunity Assessment (TAM–SAM–SOM Framework)
- 4.8. RAX Analyst Note
- 4.1. Porters Five Forces
- 5. Market Analysis, Insights and Forecast 2021-2033
- 5.1. Market Analysis, Insights and Forecast - by Application
- 5.1.1. Hematological Diseases
- 5.1.2. Autoimmune Diseases
- 5.1.3. Cancer
- 5.1.4. Others
- 5.2. Market Analysis, Insights and Forecast - by Source
- 5.2.1. Human
- 5.2.2. Humanized
- 5.2.3. Chimeric
- 5.2.4. Others
- 5.3. Market Analysis, Insights and Forecast - by End-user
- 5.3.1. Hospitals
- 5.3.2. Private Clinics
- 5.3.3. Others
- 5.4. Market Analysis, Insights and Forecast - by Region
- 5.4.1. North America
- 5.4.2. Europe
- 5.4.3. Asia Pacific
- 5.4.4. Middle East and Africa
- 5.4.5. South America
- 5.1. Market Analysis, Insights and Forecast - by Application
- 6. Global Monoclonal Antibody Therapy Industry Analysis, Insights and Forecast, 2021-2033
- 6.1. Market Analysis, Insights and Forecast - by Application
- 6.1.1. Hematological Diseases
- 6.1.2. Autoimmune Diseases
- 6.1.3. Cancer
- 6.1.4. Others
- 6.2. Market Analysis, Insights and Forecast - by Source
- 6.2.1. Human
- 6.2.2. Humanized
- 6.2.3. Chimeric
- 6.2.4. Others
- 6.3. Market Analysis, Insights and Forecast - by End-user
- 6.3.1. Hospitals
- 6.3.2. Private Clinics
- 6.3.3. Others
- 6.1. Market Analysis, Insights and Forecast - by Application
- 7. North America Monoclonal Antibody Therapy Industry Analysis, Insights and Forecast, 2020-2032
- 7.1. Market Analysis, Insights and Forecast - by Application
- 7.1.1. Hematological Diseases
- 7.1.2. Autoimmune Diseases
- 7.1.3. Cancer
- 7.1.4. Others
- 7.2. Market Analysis, Insights and Forecast - by Source
- 7.2.1. Human
- 7.2.2. Humanized
- 7.2.3. Chimeric
- 7.2.4. Others
- 7.3. Market Analysis, Insights and Forecast - by End-user
- 7.3.1. Hospitals
- 7.3.2. Private Clinics
- 7.3.3. Others
- 7.1. Market Analysis, Insights and Forecast - by Application
- 8. Europe Monoclonal Antibody Therapy Industry Analysis, Insights and Forecast, 2020-2032
- 8.1. Market Analysis, Insights and Forecast - by Application
- 8.1.1. Hematological Diseases
- 8.1.2. Autoimmune Diseases
- 8.1.3. Cancer
- 8.1.4. Others
- 8.2. Market Analysis, Insights and Forecast - by Source
- 8.2.1. Human
- 8.2.2. Humanized
- 8.2.3. Chimeric
- 8.2.4. Others
- 8.3. Market Analysis, Insights and Forecast - by End-user
- 8.3.1. Hospitals
- 8.3.2. Private Clinics
- 8.3.3. Others
- 8.1. Market Analysis, Insights and Forecast - by Application
- 9. Asia Pacific Monoclonal Antibody Therapy Industry Analysis, Insights and Forecast, 2020-2032
- 9.1. Market Analysis, Insights and Forecast - by Application
- 9.1.1. Hematological Diseases
- 9.1.2. Autoimmune Diseases
- 9.1.3. Cancer
- 9.1.4. Others
- 9.2. Market Analysis, Insights and Forecast - by Source
- 9.2.1. Human
- 9.2.2. Humanized
- 9.2.3. Chimeric
- 9.2.4. Others
- 9.3. Market Analysis, Insights and Forecast - by End-user
- 9.3.1. Hospitals
- 9.3.2. Private Clinics
- 9.3.3. Others
- 9.1. Market Analysis, Insights and Forecast - by Application
- 10. Middle East and Africa Monoclonal Antibody Therapy Industry Analysis, Insights and Forecast, 2020-2032
- 10.1. Market Analysis, Insights and Forecast - by Application
- 10.1.1. Hematological Diseases
- 10.1.2. Autoimmune Diseases
- 10.1.3. Cancer
- 10.1.4. Others
- 10.2. Market Analysis, Insights and Forecast - by Source
- 10.2.1. Human
- 10.2.2. Humanized
- 10.2.3. Chimeric
- 10.2.4. Others
- 10.3. Market Analysis, Insights and Forecast - by End-user
- 10.3.1. Hospitals
- 10.3.2. Private Clinics
- 10.3.3. Others
- 10.1. Market Analysis, Insights and Forecast - by Application
- 11. South America Monoclonal Antibody Therapy Industry Analysis, Insights and Forecast, 2020-2032
- 11.1. Market Analysis, Insights and Forecast - by Application
- 11.1.1. Hematological Diseases
- 11.1.2. Autoimmune Diseases
- 11.1.3. Cancer
- 11.1.4. Others
- 11.2. Market Analysis, Insights and Forecast - by Source
- 11.2.1. Human
- 11.2.2. Humanized
- 11.2.3. Chimeric
- 11.2.4. Others
- 11.3. Market Analysis, Insights and Forecast - by End-user
- 11.3.1. Hospitals
- 11.3.2. Private Clinics
- 11.3.3. Others
- 11.1. Market Analysis, Insights and Forecast - by Application
- 12. Competitive Analysis
- 12.1. Company Profiles
- 12.1.1 Daiichi Sankyo Company Limited
- 12.1.1.1. Company Overview
- 12.1.1.2. Products
- 12.1.1.3. Company Financials
- 12.1.1.4. SWOT Analysis
- 12.1.2 Boehringer Ingelheim International GmbH
- 12.1.2.1. Company Overview
- 12.1.2.2. Products
- 12.1.2.3. Company Financials
- 12.1.2.4. SWOT Analysis
- 12.1.3 Merck KGaA
- 12.1.3.1. Company Overview
- 12.1.3.2. Products
- 12.1.3.3. Company Financials
- 12.1.3.4. SWOT Analysis
- 12.1.4 Novartis AG
- 12.1.4.1. Company Overview
- 12.1.4.2. Products
- 12.1.4.3. Company Financials
- 12.1.4.4. SWOT Analysis
- 12.1.5 Amgen Inc
- 12.1.5.1. Company Overview
- 12.1.5.2. Products
- 12.1.5.3. Company Financials
- 12.1.5.4. SWOT Analysis
- 12.1.6 F Hoffmann-La Roche Ltd
- 12.1.6.1. Company Overview
- 12.1.6.2. Products
- 12.1.6.3. Company Financials
- 12.1.6.4. SWOT Analysis
- 12.1.7 UCB S A Belgium (UCB Inc)
- 12.1.7.1. Company Overview
- 12.1.7.2. Products
- 12.1.7.3. Company Financials
- 12.1.7.4. SWOT Analysis
- 12.1.8 AbbVie Inc
- 12.1.8.1. Company Overview
- 12.1.8.2. Products
- 12.1.8.3. Company Financials
- 12.1.8.4. SWOT Analysis
- 12.1.9 Johnson & Johnson
- 12.1.9.1. Company Overview
- 12.1.9.2. Products
- 12.1.9.3. Company Financials
- 12.1.9.4. SWOT Analysis
- 12.1.10 Pfizer Inc
- 12.1.10.1. Company Overview
- 12.1.10.2. Products
- 12.1.10.3. Company Financials
- 12.1.10.4. SWOT Analysis
- 12.1.1 Daiichi Sankyo Company Limited
- 12.2. Market Entropy
- 12.2.1 Company's Key Areas Served
- 12.2.2 Recent Developments
- 12.3. Company Market Share Analysis 2025
- 12.3.1 Top 5 Companies Market Share Analysis
- 12.3.2 Top 3 Companies Market Share Analysis
- 12.4. List of Potential Customers
- 13. Research Methodology
List of Figures
- Figure 1: Global Monoclonal Antibody Therapy Industry Revenue Breakdown (billion, %) by Region 2025 & 2033
- Figure 2: Global Monoclonal Antibody Therapy Industry Volume Breakdown (K Unit, %) by Region 2025 & 2033
- Figure 3: North America Monoclonal Antibody Therapy Industry Revenue (billion), by Application 2025 & 2033
- Figure 4: North America Monoclonal Antibody Therapy Industry Volume (K Unit), by Application 2025 & 2033
- Figure 5: North America Monoclonal Antibody Therapy Industry Revenue Share (%), by Application 2025 & 2033
- Figure 6: North America Monoclonal Antibody Therapy Industry Volume Share (%), by Application 2025 & 2033
- Figure 7: North America Monoclonal Antibody Therapy Industry Revenue (billion), by Source 2025 & 2033
- Figure 8: North America Monoclonal Antibody Therapy Industry Volume (K Unit), by Source 2025 & 2033
- Figure 9: North America Monoclonal Antibody Therapy Industry Revenue Share (%), by Source 2025 & 2033
- Figure 10: North America Monoclonal Antibody Therapy Industry Volume Share (%), by Source 2025 & 2033
- Figure 11: North America Monoclonal Antibody Therapy Industry Revenue (billion), by End-user 2025 & 2033
- Figure 12: North America Monoclonal Antibody Therapy Industry Volume (K Unit), by End-user 2025 & 2033
- Figure 13: North America Monoclonal Antibody Therapy Industry Revenue Share (%), by End-user 2025 & 2033
- Figure 14: North America Monoclonal Antibody Therapy Industry Volume Share (%), by End-user 2025 & 2033
- Figure 15: North America Monoclonal Antibody Therapy Industry Revenue (billion), by Country 2025 & 2033
- Figure 16: North America Monoclonal Antibody Therapy Industry Volume (K Unit), by Country 2025 & 2033
- Figure 17: North America Monoclonal Antibody Therapy Industry Revenue Share (%), by Country 2025 & 2033
- Figure 18: North America Monoclonal Antibody Therapy Industry Volume Share (%), by Country 2025 & 2033
- Figure 19: Europe Monoclonal Antibody Therapy Industry Revenue (billion), by Application 2025 & 2033
- Figure 20: Europe Monoclonal Antibody Therapy Industry Volume (K Unit), by Application 2025 & 2033
- Figure 21: Europe Monoclonal Antibody Therapy Industry Revenue Share (%), by Application 2025 & 2033
- Figure 22: Europe Monoclonal Antibody Therapy Industry Volume Share (%), by Application 2025 & 2033
- Figure 23: Europe Monoclonal Antibody Therapy Industry Revenue (billion), by Source 2025 & 2033
- Figure 24: Europe Monoclonal Antibody Therapy Industry Volume (K Unit), by Source 2025 & 2033
- Figure 25: Europe Monoclonal Antibody Therapy Industry Revenue Share (%), by Source 2025 & 2033
- Figure 26: Europe Monoclonal Antibody Therapy Industry Volume Share (%), by Source 2025 & 2033
- Figure 27: Europe Monoclonal Antibody Therapy Industry Revenue (billion), by End-user 2025 & 2033
- Figure 28: Europe Monoclonal Antibody Therapy Industry Volume (K Unit), by End-user 2025 & 2033
- Figure 29: Europe Monoclonal Antibody Therapy Industry Revenue Share (%), by End-user 2025 & 2033
- Figure 30: Europe Monoclonal Antibody Therapy Industry Volume Share (%), by End-user 2025 & 2033
- Figure 31: Europe Monoclonal Antibody Therapy Industry Revenue (billion), by Country 2025 & 2033
- Figure 32: Europe Monoclonal Antibody Therapy Industry Volume (K Unit), by Country 2025 & 2033
- Figure 33: Europe Monoclonal Antibody Therapy Industry Revenue Share (%), by Country 2025 & 2033
- Figure 34: Europe Monoclonal Antibody Therapy Industry Volume Share (%), by Country 2025 & 2033
- Figure 35: Asia Pacific Monoclonal Antibody Therapy Industry Revenue (billion), by Application 2025 & 2033
- Figure 36: Asia Pacific Monoclonal Antibody Therapy Industry Volume (K Unit), by Application 2025 & 2033
- Figure 37: Asia Pacific Monoclonal Antibody Therapy Industry Revenue Share (%), by Application 2025 & 2033
- Figure 38: Asia Pacific Monoclonal Antibody Therapy Industry Volume Share (%), by Application 2025 & 2033
- Figure 39: Asia Pacific Monoclonal Antibody Therapy Industry Revenue (billion), by Source 2025 & 2033
- Figure 40: Asia Pacific Monoclonal Antibody Therapy Industry Volume (K Unit), by Source 2025 & 2033
- Figure 41: Asia Pacific Monoclonal Antibody Therapy Industry Revenue Share (%), by Source 2025 & 2033
- Figure 42: Asia Pacific Monoclonal Antibody Therapy Industry Volume Share (%), by Source 2025 & 2033
- Figure 43: Asia Pacific Monoclonal Antibody Therapy Industry Revenue (billion), by End-user 2025 & 2033
- Figure 44: Asia Pacific Monoclonal Antibody Therapy Industry Volume (K Unit), by End-user 2025 & 2033
- Figure 45: Asia Pacific Monoclonal Antibody Therapy Industry Revenue Share (%), by End-user 2025 & 2033
- Figure 46: Asia Pacific Monoclonal Antibody Therapy Industry Volume Share (%), by End-user 2025 & 2033
- Figure 47: Asia Pacific Monoclonal Antibody Therapy Industry Revenue (billion), by Country 2025 & 2033
- Figure 48: Asia Pacific Monoclonal Antibody Therapy Industry Volume (K Unit), by Country 2025 & 2033
- Figure 49: Asia Pacific Monoclonal Antibody Therapy Industry Revenue Share (%), by Country 2025 & 2033
- Figure 50: Asia Pacific Monoclonal Antibody Therapy Industry Volume Share (%), by Country 2025 & 2033
- Figure 51: Middle East and Africa Monoclonal Antibody Therapy Industry Revenue (billion), by Application 2025 & 2033
- Figure 52: Middle East and Africa Monoclonal Antibody Therapy Industry Volume (K Unit), by Application 2025 & 2033
- Figure 53: Middle East and Africa Monoclonal Antibody Therapy Industry Revenue Share (%), by Application 2025 & 2033
- Figure 54: Middle East and Africa Monoclonal Antibody Therapy Industry Volume Share (%), by Application 2025 & 2033
- Figure 55: Middle East and Africa Monoclonal Antibody Therapy Industry Revenue (billion), by Source 2025 & 2033
- Figure 56: Middle East and Africa Monoclonal Antibody Therapy Industry Volume (K Unit), by Source 2025 & 2033
- Figure 57: Middle East and Africa Monoclonal Antibody Therapy Industry Revenue Share (%), by Source 2025 & 2033
- Figure 58: Middle East and Africa Monoclonal Antibody Therapy Industry Volume Share (%), by Source 2025 & 2033
- Figure 59: Middle East and Africa Monoclonal Antibody Therapy Industry Revenue (billion), by End-user 2025 & 2033
- Figure 60: Middle East and Africa Monoclonal Antibody Therapy Industry Volume (K Unit), by End-user 2025 & 2033
- Figure 61: Middle East and Africa Monoclonal Antibody Therapy Industry Revenue Share (%), by End-user 2025 & 2033
- Figure 62: Middle East and Africa Monoclonal Antibody Therapy Industry Volume Share (%), by End-user 2025 & 2033
- Figure 63: Middle East and Africa Monoclonal Antibody Therapy Industry Revenue (billion), by Country 2025 & 2033
- Figure 64: Middle East and Africa Monoclonal Antibody Therapy Industry Volume (K Unit), by Country 2025 & 2033
- Figure 65: Middle East and Africa Monoclonal Antibody Therapy Industry Revenue Share (%), by Country 2025 & 2033
- Figure 66: Middle East and Africa Monoclonal Antibody Therapy Industry Volume Share (%), by Country 2025 & 2033
- Figure 67: South America Monoclonal Antibody Therapy Industry Revenue (billion), by Application 2025 & 2033
- Figure 68: South America Monoclonal Antibody Therapy Industry Volume (K Unit), by Application 2025 & 2033
- Figure 69: South America Monoclonal Antibody Therapy Industry Revenue Share (%), by Application 2025 & 2033
- Figure 70: South America Monoclonal Antibody Therapy Industry Volume Share (%), by Application 2025 & 2033
- Figure 71: South America Monoclonal Antibody Therapy Industry Revenue (billion), by Source 2025 & 2033
- Figure 72: South America Monoclonal Antibody Therapy Industry Volume (K Unit), by Source 2025 & 2033
- Figure 73: South America Monoclonal Antibody Therapy Industry Revenue Share (%), by Source 2025 & 2033
- Figure 74: South America Monoclonal Antibody Therapy Industry Volume Share (%), by Source 2025 & 2033
- Figure 75: South America Monoclonal Antibody Therapy Industry Revenue (billion), by End-user 2025 & 2033
- Figure 76: South America Monoclonal Antibody Therapy Industry Volume (K Unit), by End-user 2025 & 2033
- Figure 77: South America Monoclonal Antibody Therapy Industry Revenue Share (%), by End-user 2025 & 2033
- Figure 78: South America Monoclonal Antibody Therapy Industry Volume Share (%), by End-user 2025 & 2033
- Figure 79: South America Monoclonal Antibody Therapy Industry Revenue (billion), by Country 2025 & 2033
- Figure 80: South America Monoclonal Antibody Therapy Industry Volume (K Unit), by Country 2025 & 2033
- Figure 81: South America Monoclonal Antibody Therapy Industry Revenue Share (%), by Country 2025 & 2033
- Figure 82: South America Monoclonal Antibody Therapy Industry Volume Share (%), by Country 2025 & 2033
List of Tables
- Table 1: Global Monoclonal Antibody Therapy Industry Revenue billion Forecast, by Application 2020 & 2033
- Table 2: Global Monoclonal Antibody Therapy Industry Volume K Unit Forecast, by Application 2020 & 2033
- Table 3: Global Monoclonal Antibody Therapy Industry Revenue billion Forecast, by Source 2020 & 2033
- Table 4: Global Monoclonal Antibody Therapy Industry Volume K Unit Forecast, by Source 2020 & 2033
- Table 5: Global Monoclonal Antibody Therapy Industry Revenue billion Forecast, by End-user 2020 & 2033
- Table 6: Global Monoclonal Antibody Therapy Industry Volume K Unit Forecast, by End-user 2020 & 2033
- Table 7: Global Monoclonal Antibody Therapy Industry Revenue billion Forecast, by Region 2020 & 2033
- Table 8: Global Monoclonal Antibody Therapy Industry Volume K Unit Forecast, by Region 2020 & 2033
- Table 9: Global Monoclonal Antibody Therapy Industry Revenue billion Forecast, by Application 2020 & 2033
- Table 10: Global Monoclonal Antibody Therapy Industry Volume K Unit Forecast, by Application 2020 & 2033
- Table 11: Global Monoclonal Antibody Therapy Industry Revenue billion Forecast, by Source 2020 & 2033
- Table 12: Global Monoclonal Antibody Therapy Industry Volume K Unit Forecast, by Source 2020 & 2033
- Table 13: Global Monoclonal Antibody Therapy Industry Revenue billion Forecast, by End-user 2020 & 2033
- Table 14: Global Monoclonal Antibody Therapy Industry Volume K Unit Forecast, by End-user 2020 & 2033
- Table 15: Global Monoclonal Antibody Therapy Industry Revenue billion Forecast, by Country 2020 & 2033
- Table 16: Global Monoclonal Antibody Therapy Industry Volume K Unit Forecast, by Country 2020 & 2033
- Table 17: United States Monoclonal Antibody Therapy Industry Revenue (billion) Forecast, by Application 2020 & 2033
- Table 18: United States Monoclonal Antibody Therapy Industry Volume (K Unit) Forecast, by Application 2020 & 2033
- Table 19: Canada Monoclonal Antibody Therapy Industry Revenue (billion) Forecast, by Application 2020 & 2033
- Table 20: Canada Monoclonal Antibody Therapy Industry Volume (K Unit) Forecast, by Application 2020 & 2033
- Table 21: Mexico Monoclonal Antibody Therapy Industry Revenue (billion) Forecast, by Application 2020 & 2033
- Table 22: Mexico Monoclonal Antibody Therapy Industry Volume (K Unit) Forecast, by Application 2020 & 2033
- Table 23: Global Monoclonal Antibody Therapy Industry Revenue billion Forecast, by Application 2020 & 2033
- Table 24: Global Monoclonal Antibody Therapy Industry Volume K Unit Forecast, by Application 2020 & 2033
- Table 25: Global Monoclonal Antibody Therapy Industry Revenue billion Forecast, by Source 2020 & 2033
- Table 26: Global Monoclonal Antibody Therapy Industry Volume K Unit Forecast, by Source 2020 & 2033
- Table 27: Global Monoclonal Antibody Therapy Industry Revenue billion Forecast, by End-user 2020 & 2033
- Table 28: Global Monoclonal Antibody Therapy Industry Volume K Unit Forecast, by End-user 2020 & 2033
- Table 29: Global Monoclonal Antibody Therapy Industry Revenue billion Forecast, by Country 2020 & 2033
- Table 30: Global Monoclonal Antibody Therapy Industry Volume K Unit Forecast, by Country 2020 & 2033
- Table 31: Germany Monoclonal Antibody Therapy Industry Revenue (billion) Forecast, by Application 2020 & 2033
- Table 32: Germany Monoclonal Antibody Therapy Industry Volume (K Unit) Forecast, by Application 2020 & 2033
- Table 33: United Kingdom Monoclonal Antibody Therapy Industry Revenue (billion) Forecast, by Application 2020 & 2033
- Table 34: United Kingdom Monoclonal Antibody Therapy Industry Volume (K Unit) Forecast, by Application 2020 & 2033
- Table 35: France Monoclonal Antibody Therapy Industry Revenue (billion) Forecast, by Application 2020 & 2033
- Table 36: France Monoclonal Antibody Therapy Industry Volume (K Unit) Forecast, by Application 2020 & 2033
- Table 37: Italy Monoclonal Antibody Therapy Industry Revenue (billion) Forecast, by Application 2020 & 2033
- Table 38: Italy Monoclonal Antibody Therapy Industry Volume (K Unit) Forecast, by Application 2020 & 2033
- Table 39: Spain Monoclonal Antibody Therapy Industry Revenue (billion) Forecast, by Application 2020 & 2033
- Table 40: Spain Monoclonal Antibody Therapy Industry Volume (K Unit) Forecast, by Application 2020 & 2033
- Table 41: Rest of Europe Monoclonal Antibody Therapy Industry Revenue (billion) Forecast, by Application 2020 & 2033
- Table 42: Rest of Europe Monoclonal Antibody Therapy Industry Volume (K Unit) Forecast, by Application 2020 & 2033
- Table 43: Global Monoclonal Antibody Therapy Industry Revenue billion Forecast, by Application 2020 & 2033
- Table 44: Global Monoclonal Antibody Therapy Industry Volume K Unit Forecast, by Application 2020 & 2033
- Table 45: Global Monoclonal Antibody Therapy Industry Revenue billion Forecast, by Source 2020 & 2033
- Table 46: Global Monoclonal Antibody Therapy Industry Volume K Unit Forecast, by Source 2020 & 2033
- Table 47: Global Monoclonal Antibody Therapy Industry Revenue billion Forecast, by End-user 2020 & 2033
- Table 48: Global Monoclonal Antibody Therapy Industry Volume K Unit Forecast, by End-user 2020 & 2033
- Table 49: Global Monoclonal Antibody Therapy Industry Revenue billion Forecast, by Country 2020 & 2033
- Table 50: Global Monoclonal Antibody Therapy Industry Volume K Unit Forecast, by Country 2020 & 2033
- Table 51: China Monoclonal Antibody Therapy Industry Revenue (billion) Forecast, by Application 2020 & 2033
- Table 52: China Monoclonal Antibody Therapy Industry Volume (K Unit) Forecast, by Application 2020 & 2033
- Table 53: Japan Monoclonal Antibody Therapy Industry Revenue (billion) Forecast, by Application 2020 & 2033
- Table 54: Japan Monoclonal Antibody Therapy Industry Volume (K Unit) Forecast, by Application 2020 & 2033
- Table 55: India Monoclonal Antibody Therapy Industry Revenue (billion) Forecast, by Application 2020 & 2033
- Table 56: India Monoclonal Antibody Therapy Industry Volume (K Unit) Forecast, by Application 2020 & 2033
- Table 57: Australia Monoclonal Antibody Therapy Industry Revenue (billion) Forecast, by Application 2020 & 2033
- Table 58: Australia Monoclonal Antibody Therapy Industry Volume (K Unit) Forecast, by Application 2020 & 2033
- Table 59: South Korea Monoclonal Antibody Therapy Industry Revenue (billion) Forecast, by Application 2020 & 2033
- Table 60: South Korea Monoclonal Antibody Therapy Industry Volume (K Unit) Forecast, by Application 2020 & 2033
- Table 61: Rest of Asia Pacific Monoclonal Antibody Therapy Industry Revenue (billion) Forecast, by Application 2020 & 2033
- Table 62: Rest of Asia Pacific Monoclonal Antibody Therapy Industry Volume (K Unit) Forecast, by Application 2020 & 2033
- Table 63: Global Monoclonal Antibody Therapy Industry Revenue billion Forecast, by Application 2020 & 2033
- Table 64: Global Monoclonal Antibody Therapy Industry Volume K Unit Forecast, by Application 2020 & 2033
- Table 65: Global Monoclonal Antibody Therapy Industry Revenue billion Forecast, by Source 2020 & 2033
- Table 66: Global Monoclonal Antibody Therapy Industry Volume K Unit Forecast, by Source 2020 & 2033
- Table 67: Global Monoclonal Antibody Therapy Industry Revenue billion Forecast, by End-user 2020 & 2033
- Table 68: Global Monoclonal Antibody Therapy Industry Volume K Unit Forecast, by End-user 2020 & 2033
- Table 69: Global Monoclonal Antibody Therapy Industry Revenue billion Forecast, by Country 2020 & 2033
- Table 70: Global Monoclonal Antibody Therapy Industry Volume K Unit Forecast, by Country 2020 & 2033
- Table 71: GCC Monoclonal Antibody Therapy Industry Revenue (billion) Forecast, by Application 2020 & 2033
- Table 72: GCC Monoclonal Antibody Therapy Industry Volume (K Unit) Forecast, by Application 2020 & 2033
- Table 73: South Africa Monoclonal Antibody Therapy Industry Revenue (billion) Forecast, by Application 2020 & 2033
- Table 74: South Africa Monoclonal Antibody Therapy Industry Volume (K Unit) Forecast, by Application 2020 & 2033
- Table 75: Rest of Middle East and Africa Monoclonal Antibody Therapy Industry Revenue (billion) Forecast, by Application 2020 & 2033
- Table 76: Rest of Middle East and Africa Monoclonal Antibody Therapy Industry Volume (K Unit) Forecast, by Application 2020 & 2033
- Table 77: Global Monoclonal Antibody Therapy Industry Revenue billion Forecast, by Application 2020 & 2033
- Table 78: Global Monoclonal Antibody Therapy Industry Volume K Unit Forecast, by Application 2020 & 2033
- Table 79: Global Monoclonal Antibody Therapy Industry Revenue billion Forecast, by Source 2020 & 2033
- Table 80: Global Monoclonal Antibody Therapy Industry Volume K Unit Forecast, by Source 2020 & 2033
- Table 81: Global Monoclonal Antibody Therapy Industry Revenue billion Forecast, by End-user 2020 & 2033
- Table 82: Global Monoclonal Antibody Therapy Industry Volume K Unit Forecast, by End-user 2020 & 2033
- Table 83: Global Monoclonal Antibody Therapy Industry Revenue billion Forecast, by Country 2020 & 2033
- Table 84: Global Monoclonal Antibody Therapy Industry Volume K Unit Forecast, by Country 2020 & 2033
- Table 85: Brazil Monoclonal Antibody Therapy Industry Revenue (billion) Forecast, by Application 2020 & 2033
- Table 86: Brazil Monoclonal Antibody Therapy Industry Volume (K Unit) Forecast, by Application 2020 & 2033
- Table 87: Argentina Monoclonal Antibody Therapy Industry Revenue (billion) Forecast, by Application 2020 & 2033
- Table 88: Argentina Monoclonal Antibody Therapy Industry Volume (K Unit) Forecast, by Application 2020 & 2033
- Table 89: Rest of South America Monoclonal Antibody Therapy Industry Revenue (billion) Forecast, by Application 2020 & 2033
- Table 90: Rest of South America Monoclonal Antibody Therapy Industry Volume (K Unit) Forecast, by Application 2020 & 2033
Frequently Asked Questions
1. What is the projected Compound Annual Growth Rate (CAGR) of the Monoclonal Antibody Therapy Industry?
The projected CAGR is approximately 16.24%.
2. Which companies are prominent players in the Monoclonal Antibody Therapy Industry?
Key companies in the market include Daiichi Sankyo Company Limited, Boehringer Ingelheim International GmbH, Merck KGaA, Novartis AG, Amgen Inc, F Hoffmann-La Roche Ltd, UCB S A Belgium (UCB Inc), AbbVie Inc, Johnson & Johnson, Pfizer Inc.
3. What are the main segments of the Monoclonal Antibody Therapy Industry?
The market segments include Application, Source, End-user.
4. Can you provide details about the market size?
The market size is estimated to be USD 264.33 billion as of 2022.
5. What are some drivers contributing to market growth?
Increasing Global Prevalence of Autoimmune Disorders and Rise in Geriatric Population; New Product Launches with Accelerated Drug Approval Initiative by USFDA.
6. What are the notable trends driving market growth?
Autoimmune Diseases are Expected to Hold the Significant Market Share in the Monoclonal Antibody Therapeutics Market.
7. Are there any restraints impacting market growth?
High Risk of Complications such as Heart Failure. Liver Injury. Neurological Disorders. Psoriasis and many Allergic Reactions; High Challenges while in the Development Stage and Expensive Patented Products.
8. Can you provide examples of recent developments in the market?
September 2022: AstraZeneca's Evusheld (tixagevimab and cilgavimab, formerly AZD7442), a long-acting antibody combination, was recommended for marketing authorization in the European Union (EU) for the treatment of adults and adolescents (aged 12 years and older weighing at least 40 kg) with COVID19 who do not require supplemental oxygen and who are at increased risk of progressing to severe COVID19.
9. What pricing options are available for accessing the report?
Pricing options include single-user, multi-user, and enterprise licenses priced at USD 4750, USD 5250, and USD 8750 respectively.
10. Is the market size provided in terms of value or volume?
The market size is provided in terms of value, measured in billion and volume, measured in K Unit.
11. Are there any specific market keywords associated with the report?
Yes, the market keyword associated with the report is "Monoclonal Antibody Therapy Industry," which aids in identifying and referencing the specific market segment covered.
12. How do I determine which pricing option suits my needs best?
The pricing options vary based on user requirements and access needs. Individual users may opt for single-user licenses, while businesses requiring broader access may choose multi-user or enterprise licenses for cost-effective access to the report.
13. Are there any additional resources or data provided in the Monoclonal Antibody Therapy Industry report?
While the report offers comprehensive insights, it's advisable to review the specific contents or supplementary materials provided to ascertain if additional resources or data are available.
14. How can I stay updated on further developments or reports in the Monoclonal Antibody Therapy Industry?
To stay informed about further developments, trends, and reports in the Monoclonal Antibody Therapy Industry, consider subscribing to industry newsletters, following relevant companies and organizations, or regularly checking reputable industry news sources and publications.
Methodology
Step 1 - Identification of Relevant Samples Size from Population Database


Step 2 - Approaches for Defining Global Market Size (Value, Volume* & Price*)

Note*: In applicable scenarios
Step 3 - Data Sources
Primary Research
- Web Analytics
- Survey Reports
- Research Institute
- Latest Research Reports
- Opinion Leaders
Secondary Research
- Annual Reports
- White Paper
- Latest Press Release
- Industry Association
- Paid Database
- Investor Presentations

Step 4 - Data Triangulation
Involves using different sources of information in order to increase the validity of a study
These sources are likely to be stakeholders in a program - participants, other researchers, program staff, other community members, and so on.
Then we put all data in single framework & apply various statistical tools to find out the dynamic on the market.
During the analysis stage, feedback from the stakeholder groups would be compared to determine areas of agreement as well as areas of divergence