
Key Insights
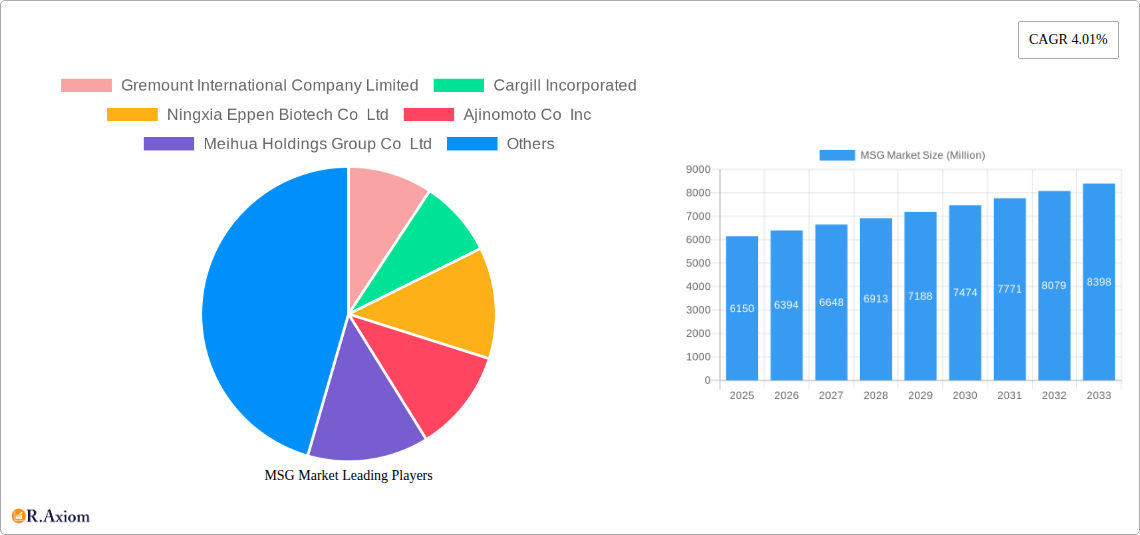
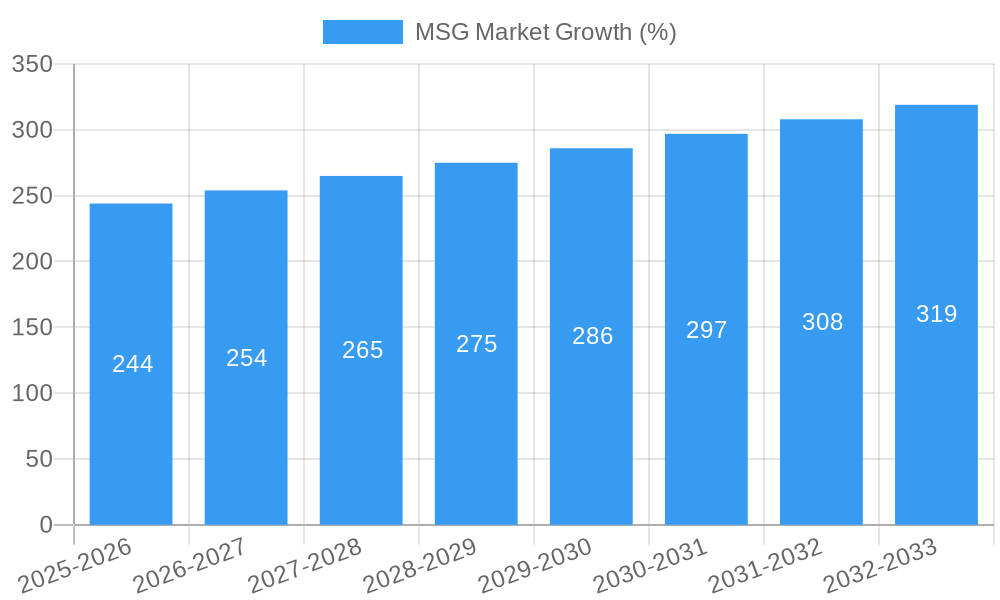
The global monosodium glutamate (MSG) market, valued at $6.15 billion in 2025, is projected to experience robust growth, driven by increasing demand from the food and beverage industry. The compound annual growth rate (CAGR) of 4.01% from 2025 to 2033 indicates a steady expansion, fueled by several key factors. The rising popularity of processed foods, particularly in rapidly developing economies in Asia Pacific, is a significant driver. Consumers' preference for convenient and flavorful food products contributes significantly to this demand. Moreover, the versatility of MSG as a flavor enhancer across diverse applications like noodles, soups, meat products, seasonings, and dressings broadens its market reach. Technological advancements in MSG production, leading to higher purity and improved efficiency, are also contributing to market expansion. However, consumer concerns regarding potential health effects, albeit largely debunked by scientific research, continue to pose a minor restraint. The competitive landscape is characterized by both large multinational corporations and regional players, with intense competition focusing on product innovation, pricing strategies, and expanding distribution networks. The market segmentation by application reveals noodles and soups as major consumers, indicating the importance of catering to these dominant sectors.
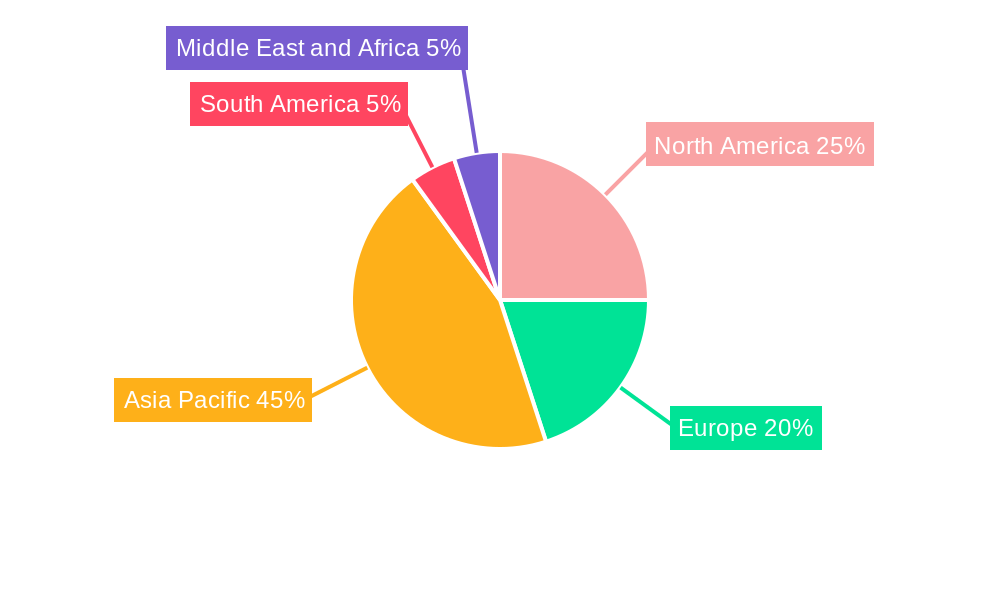
The forecast period (2025-2033) anticipates continued growth, with Asia Pacific maintaining its position as a dominant region due to high population density and rising disposable incomes. North America and Europe, while mature markets, are also expected to show steady growth fueled by innovation in food products and increased demand for convenience foods. The market's future hinges on addressing lingering consumer concerns through transparent communication and effective marketing strategies highlighting the safety and benefits of MSG. Continued innovation in product formulations and expansion into new applications will also be crucial for sustained growth in the coming years. Furthermore, strategic partnerships and mergers and acquisitions are likely to reshape the competitive landscape, leading to increased consolidation within the industry.
MSG Market: A Comprehensive Market Analysis and Forecast (2019-2033)
This in-depth report provides a comprehensive analysis of the global MSG (Monosodium Glutamate) market, offering valuable insights into market dynamics, growth drivers, and future opportunities. The study covers the period from 2019 to 2033, with a base year of 2025 and a forecast period of 2025-2033. The report includes detailed segmentation by application, highlighting key trends and competitive landscapes across various regions and countries. The report is essential for industry stakeholders, investors, and businesses seeking to understand and capitalize on the evolving MSG market.
MSG Market Concentration & Innovation
The MSG market exhibits a moderately concentrated structure, with a few major players commanding significant market share. Gremount International Company Limited, Cargill Incorporated, Ajinomoto Co Inc, Meihua Holdings Group Co Ltd, and COFCO are among the leading companies, collectively holding an estimated xx% of the global market share in 2025. However, several regional players and smaller companies also contribute significantly to the overall market volume.
Innovation in the MSG market is driven by several factors, including the development of more efficient production processes, the exploration of new applications, and a focus on enhancing product quality and purity. Regulatory frameworks related to food additives and safety standards significantly influence the industry's practices. While few direct substitutes exist for MSG's flavor-enhancing properties, consumer preferences are shifting towards natural and clean-label products, prompting companies to innovate accordingly. Mergers and acquisitions (M&A) have played a significant role in shaping the market landscape. Over the past five years, the total value of M&A deals in the MSG industry is estimated at $xx Million, with larger players seeking to expand their market reach and product portfolios. This trend is expected to continue as companies strive for greater economies of scale and market dominance.
- Market Share Concentration: xx% held by top 5 players (2025)
- M&A Activity (2019-2024): Total Deal Value: $xx Million
- Key Innovation Drivers: Efficient production, new applications, improved purity, clean-label initiatives.
- Regulatory Impact: Stringent food safety regulations influence production and labeling.
MSG Market Industry Trends & Insights
The global MSG market is experiencing steady growth, driven by increasing demand from various food and beverage applications. The Compound Annual Growth Rate (CAGR) during the forecast period (2025-2033) is projected at xx%. This growth is fueled by several key factors, including rising global population, increasing disposable incomes in developing economies, and the changing dietary habits of consumers. Technological advancements in production processes have led to improved efficiency and reduced costs, further contributing to market expansion. However, consumer concerns regarding MSG's potential health effects persist in certain markets, posing a challenge to market growth. The market penetration of MSG in various food categories varies across different regions, with higher penetration observed in regions with established culinary traditions that heavily utilize MSG. Competitive dynamics are characterized by both price competition and product differentiation strategies. Companies are investing in research and development to enhance their product offerings, meet changing consumer preferences, and solidify their market positions.
Dominant Markets & Segments in MSG Market
The Asia-Pacific region dominates the global MSG market, accounting for the largest market share in 2025. This dominance is driven by high consumption rates in countries like China, Japan, and South Korea, which have long-established culinary traditions that extensively utilize MSG in various dishes. Key drivers in this region include strong economic growth, rapidly expanding food processing industries, and a large consumer base. Within the application segments, the "Noodles, Soups and Broth" category constitutes the largest segment, followed by "Seasonings and Dressings," and "Meat Products."
Asia-Pacific Region Dominance: Driven by high consumption in China, Japan, and South Korea.
Key Drivers (Asia-Pacific): Strong economic growth, expanding food processing, large consumer base.
Largest Application Segment: Noodles, Soups and Broth.
Noodles, Soups and Broth: This segment accounts for xx% of the market in 2025 and is expected to maintain its dominant position due to the widespread use of MSG in these products.
Meat Products: The meat products segment utilizes MSG for flavor enhancement and is projected to grow at a CAGR of xx% during the forecast period.
Seasonings and Dressings: The use of MSG in seasonings and dressings provides a umami flavor and is expected to see consistent growth.
Other Applications: This segment includes a variety of applications including processed snacks and other food products, showing moderate growth potential.
MSG Market Product Developments
Recent product developments focus on higher purity grades, improved flavor profiles, and enhanced functionalities of MSG. Manufacturers are exploring novel applications, including functional foods and fortified food products. Technological advancements in fermentation processes have led to more efficient and sustainable MSG production methods. The market is witnessing a trend towards organic and sustainably sourced MSG to cater to the growing demand for clean-label products. Companies are emphasizing the natural origin and safety aspects of their MSG products to address consumer concerns and enhance market acceptance.
Report Scope & Segmentation Analysis
This report provides a detailed segmentation analysis of the MSG market based on application:
- Noodles, Soups and Broth: This segment is characterized by high volume consumption and is expected to maintain steady growth due to its established position in culinary traditions worldwide.
- Meat Products: Growth in this segment is driven by increasing meat consumption and the use of MSG as a flavor enhancer in processed meat products.
- Seasonings and Dressings: The use of MSG in various dressings and seasonings is expected to contribute significant growth to this segment.
- Other Applications: This category encompasses a wide range of applications, and future growth will depend on product innovation and expansion into new markets.
Each segment's growth projections, market sizes, and competitive landscapes are extensively analyzed within the report.
Key Drivers of MSG Market Growth
Several factors contribute to the growth of the MSG market:
- Rising Global Population: Increased demand due to population growth, particularly in developing countries.
- Expanding Food Processing Industry: The processed food industry's reliance on MSG for flavor enhancement.
- Favorable Economic Conditions: Increased disposable income boosting demand for convenient and processed foods.
Challenges in the MSG Market Sector
The MSG market faces several challenges:
- Consumer Perceptions: Negative perceptions about MSG's health effects despite scientific evidence to the contrary.
- Fluctuations in Raw Material Prices: The impact of raw material price volatility on production costs.
- Intense Competition: Competition from alternative flavor enhancers and substitute ingredients.
Emerging Opportunities in MSG Market
Emerging opportunities include:
- Clean-Label Products: Growing demand for natural and sustainably produced MSG.
- Functional Foods: The potential of MSG in functional foods and fortified products.
- New Markets: Expansion into emerging markets with growing food processing sectors.
Leading Players in the MSG Market Market
- Gremount International Company Limited
- Cargill Incorporated (Cargill Incorporated)
- Ningxia Eppen Biotech Co Ltd
- Ajinomoto Co Inc (Ajinomoto Co Inc)
- Meihua Holdings Group Co Ltd
- Shandong Xinle Monosodium Glutamate Limited Company
- COFCO
- Fufeng Group
- Shandong Qilu Biotechnology Group Co
- Henan Lotus Flower Gourmet Powder Co
Key Developments in MSG Market Industry
- January 2023: Ajinomoto Co Inc announces a new production facility in [Location], expanding its production capacity.
- June 2022: Cargill Incorporated launches a new line of clean-label MSG products.
- October 2021: Meihua Holdings Group Co Ltd acquires a smaller MSG producer, strengthening its market position.
Strategic Outlook for MSG Market Market
The MSG market presents significant growth potential, driven by increasing global demand for processed foods and the continued expansion of the food processing industry. Future opportunities lie in product innovation, focusing on clean-label products, and expanding into new and emerging markets. The industry will continue to witness a trend towards efficient and sustainable production processes to meet growing environmental concerns. Companies that adapt to changing consumer preferences and regulatory landscapes will be best positioned for success in this evolving market.
MSG Market Segmentation
-
1. Application
- 1.1. Noodles, Soups and Broth
- 1.2. Meat Products
- 1.3. Seasonings and Dressings
- 1.4. Other Applications
MSG Market Segmentation By Geography
-
1. North America
- 1.1. United States
- 1.2. Canada
- 1.3. Mexico
- 1.4. Rest of North America
-
2. Europe
- 2.1. Germany
- 2.2. United Kingdom
- 2.3. France
- 2.4. Russia
- 2.5. Rest of Europe
-
3. Asia Pacific
- 3.1. China
- 3.2. Japan
- 3.3. India
- 3.4. Australia
- 3.5. Rest of Asia Pacific
-
4. South America
- 4.1. Brazil
- 4.2. Argentina
- 4.3. Rest of South America
-
5. Middle East and Africa
- 5.1. South Africa
- 5.2. United Arab Emirates
- 5.3. Rest of Middle East and Africa
MSG Market REPORT HIGHLIGHTS
| Aspects | Details |
|---|---|
| Study Period | 2019-2033 |
| Base Year | 2024 |
| Estimated Year | 2025 |
| Forecast Period | 2025-2033 |
| Historical Period | 2019-2024 |
| Growth Rate | CAGR of 4.01% from 2019-2033 |
| Segmentation |
|
Table of Contents
- 1. Introduction
- 1.1. Research Scope
- 1.2. Market Segmentation
- 1.3. Research Methodology
- 1.4. Definitions and Assumptions
- 2. Executive Summary
- 2.1. Introduction
- 3. Market Dynamics
- 3.1. Introduction
- 3.2. Market Drivers
- 3.2.1. Consumer inclination toward functional food and beverages; Increasing Number of Applications and Growing Industrial Use
- 3.3. Market Restrains
- 3.3.1. Increasing Shift Toward Plant-Based Protein
- 3.4. Market Trends
- 3.4.1. Rising Demand for Ready -To-Eat and Processed Food
- 4. Market Factor Analysis
- 4.1. Porters Five Forces
- 4.2. Supply/Value Chain
- 4.3. PESTEL analysis
- 4.4. Market Entropy
- 4.5. Patent/Trademark Analysis
- 5. Global MSG Market Analysis, Insights and Forecast, 2019-2031
- 5.1. Market Analysis, Insights and Forecast - by Application
- 5.1.1. Noodles, Soups and Broth
- 5.1.2. Meat Products
- 5.1.3. Seasonings and Dressings
- 5.1.4. Other Applications
- 5.2. Market Analysis, Insights and Forecast - by Region
- 5.2.1. North America
- 5.2.2. Europe
- 5.2.3. Asia Pacific
- 5.2.4. South America
- 5.2.5. Middle East and Africa
- 5.1. Market Analysis, Insights and Forecast - by Application
- 6. North America MSG Market Analysis, Insights and Forecast, 2019-2031
- 6.1. Market Analysis, Insights and Forecast - by Application
- 6.1.1. Noodles, Soups and Broth
- 6.1.2. Meat Products
- 6.1.3. Seasonings and Dressings
- 6.1.4. Other Applications
- 6.1. Market Analysis, Insights and Forecast - by Application
- 7. Europe MSG Market Analysis, Insights and Forecast, 2019-2031
- 7.1. Market Analysis, Insights and Forecast - by Application
- 7.1.1. Noodles, Soups and Broth
- 7.1.2. Meat Products
- 7.1.3. Seasonings and Dressings
- 7.1.4. Other Applications
- 7.1. Market Analysis, Insights and Forecast - by Application
- 8. Asia Pacific MSG Market Analysis, Insights and Forecast, 2019-2031
- 8.1. Market Analysis, Insights and Forecast - by Application
- 8.1.1. Noodles, Soups and Broth
- 8.1.2. Meat Products
- 8.1.3. Seasonings and Dressings
- 8.1.4. Other Applications
- 8.1. Market Analysis, Insights and Forecast - by Application
- 9. South America MSG Market Analysis, Insights and Forecast, 2019-2031
- 9.1. Market Analysis, Insights and Forecast - by Application
- 9.1.1. Noodles, Soups and Broth
- 9.1.2. Meat Products
- 9.1.3. Seasonings and Dressings
- 9.1.4. Other Applications
- 9.1. Market Analysis, Insights and Forecast - by Application
- 10. Middle East and Africa MSG Market Analysis, Insights and Forecast, 2019-2031
- 10.1. Market Analysis, Insights and Forecast - by Application
- 10.1.1. Noodles, Soups and Broth
- 10.1.2. Meat Products
- 10.1.3. Seasonings and Dressings
- 10.1.4. Other Applications
- 10.1. Market Analysis, Insights and Forecast - by Application
- 11. North America MSG Market Analysis, Insights and Forecast, 2019-2031
- 11.1. Market Analysis, Insights and Forecast - By Country/Sub-region
- 11.1.1. undefined
- 12. Europe MSG Market Analysis, Insights and Forecast, 2019-2031
- 12.1. Market Analysis, Insights and Forecast - By Country/Sub-region
- 12.1.1. undefined
- 13. Asia Pacific MSG Market Analysis, Insights and Forecast, 2019-2031
- 13.1. Market Analysis, Insights and Forecast - By Country/Sub-region
- 13.1.1. undefined
- 14. South America MSG Market Analysis, Insights and Forecast, 2019-2031
- 14.1. Market Analysis, Insights and Forecast - By Country/Sub-region
- 14.1.1. undefined
- 15. Middle East and Africa MSG Market Analysis, Insights and Forecast, 2019-2031
- 15.1. Market Analysis, Insights and Forecast - By Country/Sub-region
- 15.1.1. undefined
- 16. Competitive Analysis
- 16.1. Global Market Share Analysis 2024
- 16.2. Company Profiles
- 16.2.1 Gremount International Company Limited
- 16.2.1.1. Overview
- 16.2.1.2. Products
- 16.2.1.3. SWOT Analysis
- 16.2.1.4. Recent Developments
- 16.2.1.5. Financials (Based on Availability)
- 16.2.2 Cargill Incorporated
- 16.2.2.1. Overview
- 16.2.2.2. Products
- 16.2.2.3. SWOT Analysis
- 16.2.2.4. Recent Developments
- 16.2.2.5. Financials (Based on Availability)
- 16.2.3 Ningxia Eppen Biotech Co Ltd
- 16.2.3.1. Overview
- 16.2.3.2. Products
- 16.2.3.3. SWOT Analysis
- 16.2.3.4. Recent Developments
- 16.2.3.5. Financials (Based on Availability)
- 16.2.4 Ajinomoto Co Inc
- 16.2.4.1. Overview
- 16.2.4.2. Products
- 16.2.4.3. SWOT Analysis
- 16.2.4.4. Recent Developments
- 16.2.4.5. Financials (Based on Availability)
- 16.2.5 Meihua Holdings Group Co Ltd
- 16.2.5.1. Overview
- 16.2.5.2. Products
- 16.2.5.3. SWOT Analysis
- 16.2.5.4. Recent Developments
- 16.2.5.5. Financials (Based on Availability)
- 16.2.6 Shandong Xinle Monosodium Glutamate Limited Company*List Not Exhaustive
- 16.2.6.1. Overview
- 16.2.6.2. Products
- 16.2.6.3. SWOT Analysis
- 16.2.6.4. Recent Developments
- 16.2.6.5. Financials (Based on Availability)
- 16.2.7 COFCO
- 16.2.7.1. Overview
- 16.2.7.2. Products
- 16.2.7.3. SWOT Analysis
- 16.2.7.4. Recent Developments
- 16.2.7.5. Financials (Based on Availability)
- 16.2.8 Fufeng Group
- 16.2.8.1. Overview
- 16.2.8.2. Products
- 16.2.8.3. SWOT Analysis
- 16.2.8.4. Recent Developments
- 16.2.8.5. Financials (Based on Availability)
- 16.2.9 Shandong Qilu Biotechnology Group Co
- 16.2.9.1. Overview
- 16.2.9.2. Products
- 16.2.9.3. SWOT Analysis
- 16.2.9.4. Recent Developments
- 16.2.9.5. Financials (Based on Availability)
- 16.2.10 Henan Lotus Flower Gourmet Powder Co
- 16.2.10.1. Overview
- 16.2.10.2. Products
- 16.2.10.3. SWOT Analysis
- 16.2.10.4. Recent Developments
- 16.2.10.5. Financials (Based on Availability)
- 16.2.1 Gremount International Company Limited
List of Figures
- Figure 1: Global MSG Market Revenue Breakdown (Million, %) by Region 2024 & 2032
- Figure 2: Global MSG Market Volume Breakdown (K Tons, %) by Region 2024 & 2032
- Figure 3: North America MSG Market Revenue (Million), by Country 2024 & 2032
- Figure 4: North America MSG Market Volume (K Tons), by Country 2024 & 2032
- Figure 5: North America MSG Market Revenue Share (%), by Country 2024 & 2032
- Figure 6: North America MSG Market Volume Share (%), by Country 2024 & 2032
- Figure 7: Europe MSG Market Revenue (Million), by Country 2024 & 2032
- Figure 8: Europe MSG Market Volume (K Tons), by Country 2024 & 2032
- Figure 9: Europe MSG Market Revenue Share (%), by Country 2024 & 2032
- Figure 10: Europe MSG Market Volume Share (%), by Country 2024 & 2032
- Figure 11: Asia Pacific MSG Market Revenue (Million), by Country 2024 & 2032
- Figure 12: Asia Pacific MSG Market Volume (K Tons), by Country 2024 & 2032
- Figure 13: Asia Pacific MSG Market Revenue Share (%), by Country 2024 & 2032
- Figure 14: Asia Pacific MSG Market Volume Share (%), by Country 2024 & 2032
- Figure 15: South America MSG Market Revenue (Million), by Country 2024 & 2032
- Figure 16: South America MSG Market Volume (K Tons), by Country 2024 & 2032
- Figure 17: South America MSG Market Revenue Share (%), by Country 2024 & 2032
- Figure 18: South America MSG Market Volume Share (%), by Country 2024 & 2032
- Figure 19: Middle East and Africa MSG Market Revenue (Million), by Country 2024 & 2032
- Figure 20: Middle East and Africa MSG Market Volume (K Tons), by Country 2024 & 2032
- Figure 21: Middle East and Africa MSG Market Revenue Share (%), by Country 2024 & 2032
- Figure 22: Middle East and Africa MSG Market Volume Share (%), by Country 2024 & 2032
- Figure 23: North America MSG Market Revenue (Million), by Application 2024 & 2032
- Figure 24: North America MSG Market Volume (K Tons), by Application 2024 & 2032
- Figure 25: North America MSG Market Revenue Share (%), by Application 2024 & 2032
- Figure 26: North America MSG Market Volume Share (%), by Application 2024 & 2032
- Figure 27: North America MSG Market Revenue (Million), by Country 2024 & 2032
- Figure 28: North America MSG Market Volume (K Tons), by Country 2024 & 2032
- Figure 29: North America MSG Market Revenue Share (%), by Country 2024 & 2032
- Figure 30: North America MSG Market Volume Share (%), by Country 2024 & 2032
- Figure 31: Europe MSG Market Revenue (Million), by Application 2024 & 2032
- Figure 32: Europe MSG Market Volume (K Tons), by Application 2024 & 2032
- Figure 33: Europe MSG Market Revenue Share (%), by Application 2024 & 2032
- Figure 34: Europe MSG Market Volume Share (%), by Application 2024 & 2032
- Figure 35: Europe MSG Market Revenue (Million), by Country 2024 & 2032
- Figure 36: Europe MSG Market Volume (K Tons), by Country 2024 & 2032
- Figure 37: Europe MSG Market Revenue Share (%), by Country 2024 & 2032
- Figure 38: Europe MSG Market Volume Share (%), by Country 2024 & 2032
- Figure 39: Asia Pacific MSG Market Revenue (Million), by Application 2024 & 2032
- Figure 40: Asia Pacific MSG Market Volume (K Tons), by Application 2024 & 2032
- Figure 41: Asia Pacific MSG Market Revenue Share (%), by Application 2024 & 2032
- Figure 42: Asia Pacific MSG Market Volume Share (%), by Application 2024 & 2032
- Figure 43: Asia Pacific MSG Market Revenue (Million), by Country 2024 & 2032
- Figure 44: Asia Pacific MSG Market Volume (K Tons), by Country 2024 & 2032
- Figure 45: Asia Pacific MSG Market Revenue Share (%), by Country 2024 & 2032
- Figure 46: Asia Pacific MSG Market Volume Share (%), by Country 2024 & 2032
- Figure 47: South America MSG Market Revenue (Million), by Application 2024 & 2032
- Figure 48: South America MSG Market Volume (K Tons), by Application 2024 & 2032
- Figure 49: South America MSG Market Revenue Share (%), by Application 2024 & 2032
- Figure 50: South America MSG Market Volume Share (%), by Application 2024 & 2032
- Figure 51: South America MSG Market Revenue (Million), by Country 2024 & 2032
- Figure 52: South America MSG Market Volume (K Tons), by Country 2024 & 2032
- Figure 53: South America MSG Market Revenue Share (%), by Country 2024 & 2032
- Figure 54: South America MSG Market Volume Share (%), by Country 2024 & 2032
- Figure 55: Middle East and Africa MSG Market Revenue (Million), by Application 2024 & 2032
- Figure 56: Middle East and Africa MSG Market Volume (K Tons), by Application 2024 & 2032
- Figure 57: Middle East and Africa MSG Market Revenue Share (%), by Application 2024 & 2032
- Figure 58: Middle East and Africa MSG Market Volume Share (%), by Application 2024 & 2032
- Figure 59: Middle East and Africa MSG Market Revenue (Million), by Country 2024 & 2032
- Figure 60: Middle East and Africa MSG Market Volume (K Tons), by Country 2024 & 2032
- Figure 61: Middle East and Africa MSG Market Revenue Share (%), by Country 2024 & 2032
- Figure 62: Middle East and Africa MSG Market Volume Share (%), by Country 2024 & 2032
List of Tables
- Table 1: Global MSG Market Revenue Million Forecast, by Region 2019 & 2032
- Table 2: Global MSG Market Volume K Tons Forecast, by Region 2019 & 2032
- Table 3: Global MSG Market Revenue Million Forecast, by Application 2019 & 2032
- Table 4: Global MSG Market Volume K Tons Forecast, by Application 2019 & 2032
- Table 5: Global MSG Market Revenue Million Forecast, by Region 2019 & 2032
- Table 6: Global MSG Market Volume K Tons Forecast, by Region 2019 & 2032
- Table 7: Global MSG Market Revenue Million Forecast, by Country 2019 & 2032
- Table 8: Global MSG Market Volume K Tons Forecast, by Country 2019 & 2032
- Table 9: Global MSG Market Revenue Million Forecast, by Country 2019 & 2032
- Table 10: Global MSG Market Volume K Tons Forecast, by Country 2019 & 2032
- Table 11: Global MSG Market Revenue Million Forecast, by Country 2019 & 2032
- Table 12: Global MSG Market Volume K Tons Forecast, by Country 2019 & 2032
- Table 13: Global MSG Market Revenue Million Forecast, by Country 2019 & 2032
- Table 14: Global MSG Market Volume K Tons Forecast, by Country 2019 & 2032
- Table 15: Global MSG Market Revenue Million Forecast, by Country 2019 & 2032
- Table 16: Global MSG Market Volume K Tons Forecast, by Country 2019 & 2032
- Table 17: Global MSG Market Revenue Million Forecast, by Application 2019 & 2032
- Table 18: Global MSG Market Volume K Tons Forecast, by Application 2019 & 2032
- Table 19: Global MSG Market Revenue Million Forecast, by Country 2019 & 2032
- Table 20: Global MSG Market Volume K Tons Forecast, by Country 2019 & 2032
- Table 21: United States MSG Market Revenue (Million) Forecast, by Application 2019 & 2032
- Table 22: United States MSG Market Volume (K Tons) Forecast, by Application 2019 & 2032
- Table 23: Canada MSG Market Revenue (Million) Forecast, by Application 2019 & 2032
- Table 24: Canada MSG Market Volume (K Tons) Forecast, by Application 2019 & 2032
- Table 25: Mexico MSG Market Revenue (Million) Forecast, by Application 2019 & 2032
- Table 26: Mexico MSG Market Volume (K Tons) Forecast, by Application 2019 & 2032
- Table 27: Rest of North America MSG Market Revenue (Million) Forecast, by Application 2019 & 2032
- Table 28: Rest of North America MSG Market Volume (K Tons) Forecast, by Application 2019 & 2032
- Table 29: Global MSG Market Revenue Million Forecast, by Application 2019 & 2032
- Table 30: Global MSG Market Volume K Tons Forecast, by Application 2019 & 2032
- Table 31: Global MSG Market Revenue Million Forecast, by Country 2019 & 2032
- Table 32: Global MSG Market Volume K Tons Forecast, by Country 2019 & 2032
- Table 33: Germany MSG Market Revenue (Million) Forecast, by Application 2019 & 2032
- Table 34: Germany MSG Market Volume (K Tons) Forecast, by Application 2019 & 2032
- Table 35: United Kingdom MSG Market Revenue (Million) Forecast, by Application 2019 & 2032
- Table 36: United Kingdom MSG Market Volume (K Tons) Forecast, by Application 2019 & 2032
- Table 37: France MSG Market Revenue (Million) Forecast, by Application 2019 & 2032
- Table 38: France MSG Market Volume (K Tons) Forecast, by Application 2019 & 2032
- Table 39: Russia MSG Market Revenue (Million) Forecast, by Application 2019 & 2032
- Table 40: Russia MSG Market Volume (K Tons) Forecast, by Application 2019 & 2032
- Table 41: Rest of Europe MSG Market Revenue (Million) Forecast, by Application 2019 & 2032
- Table 42: Rest of Europe MSG Market Volume (K Tons) Forecast, by Application 2019 & 2032
- Table 43: Global MSG Market Revenue Million Forecast, by Application 2019 & 2032
- Table 44: Global MSG Market Volume K Tons Forecast, by Application 2019 & 2032
- Table 45: Global MSG Market Revenue Million Forecast, by Country 2019 & 2032
- Table 46: Global MSG Market Volume K Tons Forecast, by Country 2019 & 2032
- Table 47: China MSG Market Revenue (Million) Forecast, by Application 2019 & 2032
- Table 48: China MSG Market Volume (K Tons) Forecast, by Application 2019 & 2032
- Table 49: Japan MSG Market Revenue (Million) Forecast, by Application 2019 & 2032
- Table 50: Japan MSG Market Volume (K Tons) Forecast, by Application 2019 & 2032
- Table 51: India MSG Market Revenue (Million) Forecast, by Application 2019 & 2032
- Table 52: India MSG Market Volume (K Tons) Forecast, by Application 2019 & 2032
- Table 53: Australia MSG Market Revenue (Million) Forecast, by Application 2019 & 2032
- Table 54: Australia MSG Market Volume (K Tons) Forecast, by Application 2019 & 2032
- Table 55: Rest of Asia Pacific MSG Market Revenue (Million) Forecast, by Application 2019 & 2032
- Table 56: Rest of Asia Pacific MSG Market Volume (K Tons) Forecast, by Application 2019 & 2032
- Table 57: Global MSG Market Revenue Million Forecast, by Application 2019 & 2032
- Table 58: Global MSG Market Volume K Tons Forecast, by Application 2019 & 2032
- Table 59: Global MSG Market Revenue Million Forecast, by Country 2019 & 2032
- Table 60: Global MSG Market Volume K Tons Forecast, by Country 2019 & 2032
- Table 61: Brazil MSG Market Revenue (Million) Forecast, by Application 2019 & 2032
- Table 62: Brazil MSG Market Volume (K Tons) Forecast, by Application 2019 & 2032
- Table 63: Argentina MSG Market Revenue (Million) Forecast, by Application 2019 & 2032
- Table 64: Argentina MSG Market Volume (K Tons) Forecast, by Application 2019 & 2032
- Table 65: Rest of South America MSG Market Revenue (Million) Forecast, by Application 2019 & 2032
- Table 66: Rest of South America MSG Market Volume (K Tons) Forecast, by Application 2019 & 2032
- Table 67: Global MSG Market Revenue Million Forecast, by Application 2019 & 2032
- Table 68: Global MSG Market Volume K Tons Forecast, by Application 2019 & 2032
- Table 69: Global MSG Market Revenue Million Forecast, by Country 2019 & 2032
- Table 70: Global MSG Market Volume K Tons Forecast, by Country 2019 & 2032
- Table 71: South Africa MSG Market Revenue (Million) Forecast, by Application 2019 & 2032
- Table 72: South Africa MSG Market Volume (K Tons) Forecast, by Application 2019 & 2032
- Table 73: United Arab Emirates MSG Market Revenue (Million) Forecast, by Application 2019 & 2032
- Table 74: United Arab Emirates MSG Market Volume (K Tons) Forecast, by Application 2019 & 2032
- Table 75: Rest of Middle East and Africa MSG Market Revenue (Million) Forecast, by Application 2019 & 2032
- Table 76: Rest of Middle East and Africa MSG Market Volume (K Tons) Forecast, by Application 2019 & 2032
Frequently Asked Questions
1. What is the projected Compound Annual Growth Rate (CAGR) of the MSG Market?
The projected CAGR is approximately 4.01%.
2. Which companies are prominent players in the MSG Market?
Key companies in the market include Gremount International Company Limited, Cargill Incorporated, Ningxia Eppen Biotech Co Ltd, Ajinomoto Co Inc, Meihua Holdings Group Co Ltd, Shandong Xinle Monosodium Glutamate Limited Company*List Not Exhaustive, COFCO, Fufeng Group, Shandong Qilu Biotechnology Group Co, Henan Lotus Flower Gourmet Powder Co.
3. What are the main segments of the MSG Market?
The market segments include Application.
4. Can you provide details about the market size?
The market size is estimated to be USD 6.15 Million as of 2022.
5. What are some drivers contributing to market growth?
Consumer inclination toward functional food and beverages; Increasing Number of Applications and Growing Industrial Use.
6. What are the notable trends driving market growth?
Rising Demand for Ready -To-Eat and Processed Food.
7. Are there any restraints impacting market growth?
Increasing Shift Toward Plant-Based Protein.
8. Can you provide examples of recent developments in the market?
N/A
9. What pricing options are available for accessing the report?
Pricing options include single-user, multi-user, and enterprise licenses priced at USD 4750, USD 5250, and USD 8750 respectively.
10. Is the market size provided in terms of value or volume?
The market size is provided in terms of value, measured in Million and volume, measured in K Tons.
11. Are there any specific market keywords associated with the report?
Yes, the market keyword associated with the report is "MSG Market," which aids in identifying and referencing the specific market segment covered.
12. How do I determine which pricing option suits my needs best?
The pricing options vary based on user requirements and access needs. Individual users may opt for single-user licenses, while businesses requiring broader access may choose multi-user or enterprise licenses for cost-effective access to the report.
13. Are there any additional resources or data provided in the MSG Market report?
While the report offers comprehensive insights, it's advisable to review the specific contents or supplementary materials provided to ascertain if additional resources or data are available.
14. How can I stay updated on further developments or reports in the MSG Market?
To stay informed about further developments, trends, and reports in the MSG Market, consider subscribing to industry newsletters, following relevant companies and organizations, or regularly checking reputable industry news sources and publications.
Methodology
Step 1 - Identification of Relevant Samples Size from Population Database


Step 2 - Approaches for Defining Global Market Size (Value, Volume* & Price*)

Note*: In applicable scenarios
Step 3 - Data Sources
Primary Research
- Web Analytics
- Survey Reports
- Research Institute
- Latest Research Reports
- Opinion Leaders
Secondary Research
- Annual Reports
- White Paper
- Latest Press Release
- Industry Association
- Paid Database
- Investor Presentations

Step 4 - Data Triangulation
Involves using different sources of information in order to increase the validity of a study
These sources are likely to be stakeholders in a program - participants, other researchers, program staff, other community members, and so on.
Then we put all data in single framework & apply various statistical tools to find out the dynamic on the market.
During the analysis stage, feedback from the stakeholder groups would be compared to determine areas of agreement as well as areas of divergence


