
Key Insights
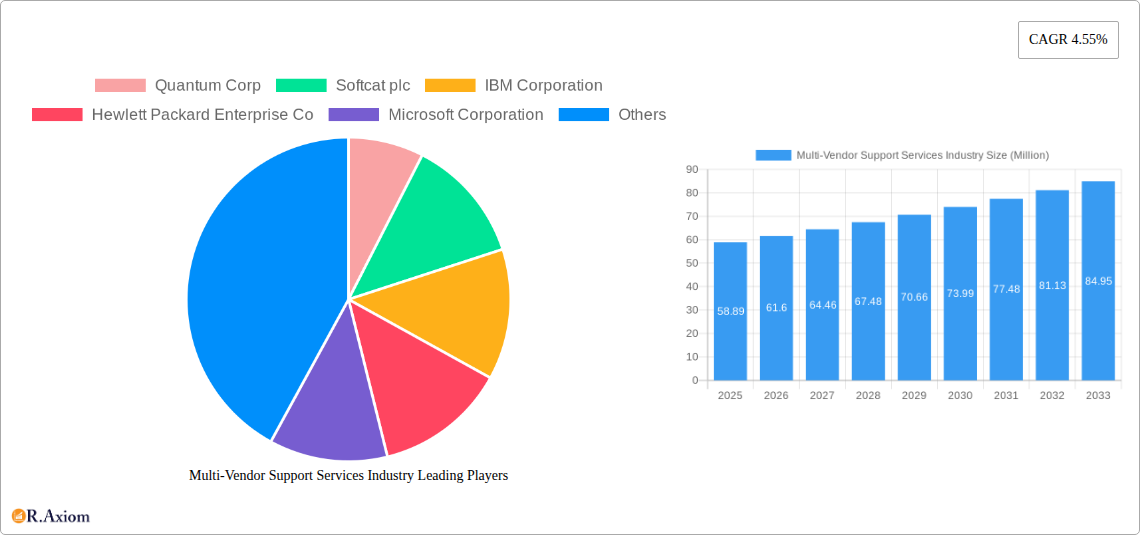
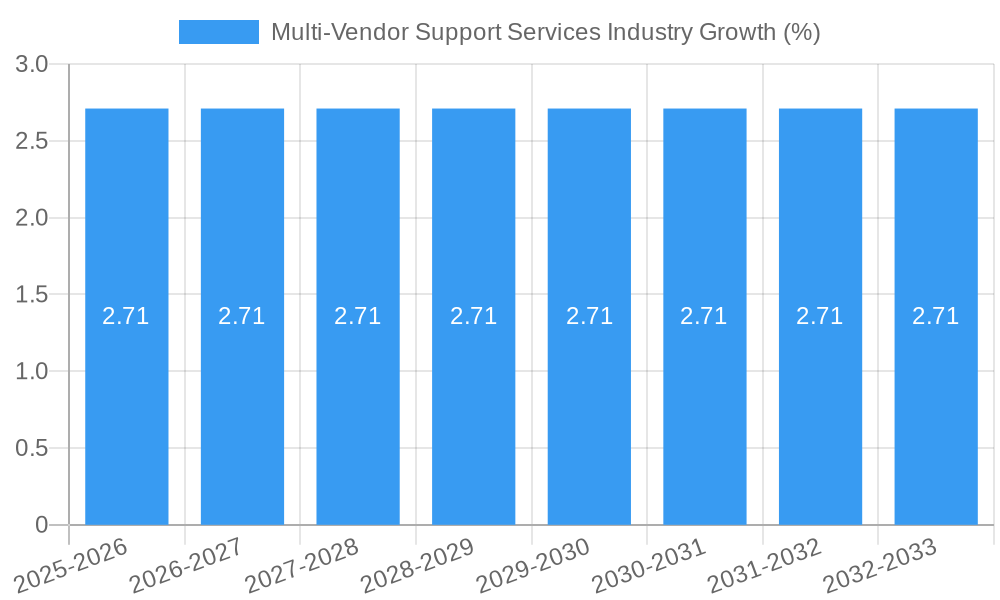
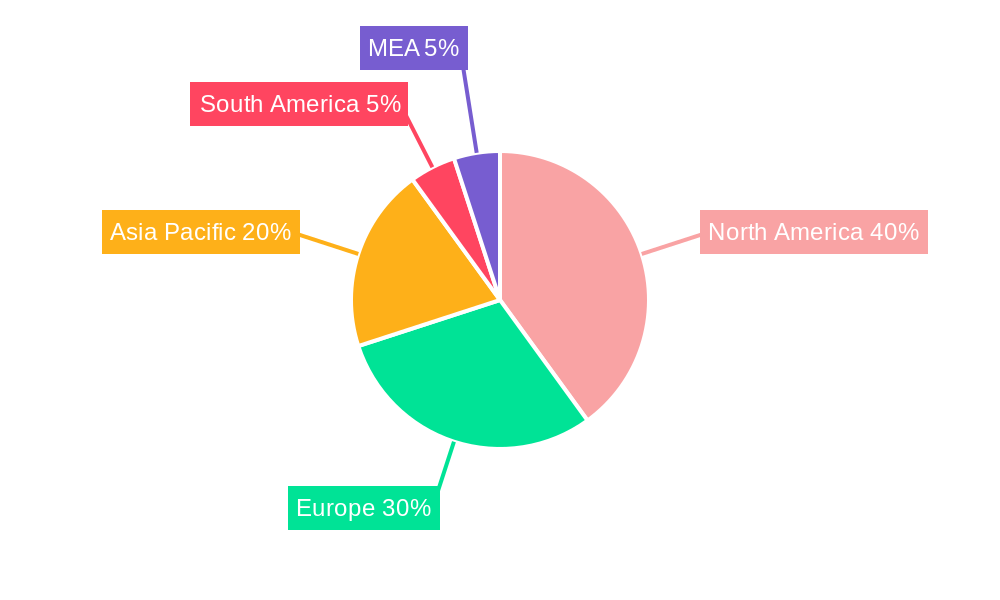
The Multi-Vendor Support Services market is experiencing robust growth, projected to reach a market size of $58.89 million in 2025 and maintain a Compound Annual Growth Rate (CAGR) of 4.55% from 2025 to 2033. This expansion is driven by several key factors. The increasing complexity of IT infrastructure within organizations across diverse sectors like IT & Telecommunications, BFSI (Banking, Financial Services, and Insurance), Healthcare, and Energy & Power necessitates comprehensive, multi-vendor support solutions. Businesses are increasingly outsourcing IT support to manage diverse vendor ecosystems efficiently, reducing operational costs and improving service uptime. The shift towards cloud-based solutions and digital transformation initiatives further fuels demand, requiring specialized expertise to manage hybrid environments. The market is segmented by service type (professional and managed services) and enterprise size (SMEs and large enterprises), reflecting varying needs and budgetary considerations. North America currently holds a significant market share, due to the high adoption of advanced technologies and a mature IT infrastructure. However, Asia-Pacific is poised for significant growth in the coming years, driven by rapid digitalization and increasing IT spending in countries like China and India. The competitive landscape is comprised of both established players like IBM, Hewlett Packard Enterprise, and Microsoft, along with specialized multi-vendor support providers, ensuring a dynamic market environment.
The growth trajectory of the Multi-Vendor Support Services market is anticipated to continue its upward trend throughout the forecast period (2025-2033). Factors contributing to this sustained growth include the rising adoption of hybrid cloud models, the increasing prevalence of cyber security threats requiring proactive management across different vendor platforms, and the growing need for proactive maintenance and support to ensure business continuity. Large enterprises, owing to their extensive IT infrastructure and higher budgets, are major contributors to the market value. However, the SME segment is also witnessing growth, driven by affordability concerns and a growing realization of the value of outsourcing IT support. Geographical expansion will play a significant role, with developing economies exhibiting greater potential for growth due to increasing IT infrastructure investments. Strategic partnerships and mergers and acquisitions within the industry are expected to shape the competitive dynamics in the coming years.
This comprehensive report provides an in-depth analysis of the Multi-Vendor Support Services industry, encompassing market size, segmentation, growth drivers, challenges, and future opportunities. The study period covers 2019-2033, with 2025 as the base and estimated year. The forecast period spans 2025-2033, and the historical period covers 2019-2024. The report leverages extensive primary and secondary research to offer actionable insights for industry stakeholders, including key players like Quantum Corp, Softcat plc, IBM Corporation, Hewlett Packard Enterprise Co, Microsoft Corporation, NetApp Inc, Oracle Corporation, Dell Technologies Inc, Clear Technologies Inc, Evernex Group SAS, and Blue Sky Group Ltd.
Multi-Vendor Support Services Industry Market Concentration & Innovation
The Multi-Vendor Support Services market exhibits a moderately concentrated landscape, with a few large players commanding significant market share. While exact market share figures for individual companies are proprietary data, estimations suggest that the top five players account for approximately xx% of the global revenue, exceeding $xx Million. Market concentration is influenced by factors such as economies of scale, technological expertise, and established customer relationships.
Innovation in the sector is driven by several factors, including:
- Technological advancements: The rise of cloud computing, AI, and automation is creating new opportunities for multi-vendor support services, demanding enhanced service capabilities and integration solutions.
- Increased complexity of IT infrastructure: Modern businesses rely on complex, multi-vendor IT environments, leading to increased demand for specialized support services.
- Regulatory changes: Compliance requirements and data security regulations are pushing companies to seek professional support to ensure compliance and mitigate risks.
Mergers and acquisitions (M&A) are common strategies employed to expand market share and acquire technological capabilities. Over the past five years, the industry witnessed significant M&A activity, with deals totaling an estimated $xx Million. These transactions reflect the ongoing consolidation trend within the sector.
Product substitutes, such as in-house support teams, represent a partial alternative, but often lack the specialized expertise and scalability offered by professional multi-vendor support providers. End-user trends reveal a growing preference for managed services, driven by cost optimization and efficiency gains.
Multi-Vendor Support Services Industry Industry Trends & Insights
The Multi-Vendor Support Services market is experiencing robust growth, driven by several factors. The compound annual growth rate (CAGR) during the forecast period (2025-2033) is estimated at xx%, projecting a market value exceeding $xx Million by 2033. This growth is fueled by the increasing adoption of cloud computing and digital transformation initiatives across various industries.
Technological disruptions are significantly impacting the market landscape. The integration of Artificial Intelligence (AI) and Machine Learning (ML) in support services is enhancing efficiency and reducing resolution times. The increasing complexity of IT infrastructures is also driving demand. Consumer preference shifts toward managed services, emphasizing proactive monitoring and preventive maintenance over reactive troubleshooting. Competitive dynamics are characterized by intense competition among established players and emerging service providers, leading to innovation and price optimization. Market penetration across various segments and geographies remains relatively uneven, with large enterprises and developed economies showing higher adoption rates.
Dominant Markets & Segments in Multi-Vendor Support Services Industry
The IT & Telecommunication sector represents the largest segment in the Multi-Vendor Support Services market, accounting for xx% of the total market value in 2025 (estimated $xx Million), followed by BFSI (Banking, Financial Services, and Insurance) at approximately xx%. Large enterprises form the most significant segment by enterprise size, driven by their extensive IT infrastructure and need for comprehensive support. Within service types, managed services contribute to a larger market share compared to professional services.
- Key Drivers for IT & Telecommunication Dominance: Rapid technological advancements, high investment in IT infrastructure, and stringent regulatory compliance requirements.
- Key Drivers for BFSI Segment Growth: Demand for robust security and compliance support, along with increasing reliance on digital channels and technologies.
- Key Drivers for Large Enterprise Dominance: Scale of operations, complex IT infrastructures, and need for comprehensive support services.
- Key Drivers for Managed Service Growth: Cost optimization, enhanced efficiency, and proactive problem resolution.
Geographically, North America and Europe are leading the market, driven by robust technological adoption and high IT spending. However, Asia-Pacific is witnessing rapid growth due to increasing digital transformation initiatives.
Multi-Vendor Support Services Industry Product Developments
Recent product innovations focus on AI-powered support tools, automated incident management systems, and integrated multi-vendor monitoring platforms. These advancements offer improved efficiency, reduced downtime, and enhanced customer experience. The key competitive advantage lies in offering comprehensive, integrated support solutions covering multiple vendors and technologies. This addresses the challenges of managing increasingly complex IT environments.
Report Scope & Segmentation Analysis
This report segments the Multi-Vendor Support Services market based on end-user verticals (IT & Telecommunication, BFSI, Healthcare, Energy & Power, Industrial Manufacturing, Others), service types (Professional, Managed), and enterprise size (Small & Medium Enterprises, Large Enterprises). Each segment is analyzed in detail, providing insights into market size, growth projections, and competitive dynamics. For instance, the IT & Telecommunication sector is projected to exhibit significant growth due to the ongoing expansion of 5G networks and cloud infrastructure. Similarly, managed services are expected to outperform professional services due to the increasing preference for proactive and cost-effective support models.
Key Drivers of Multi-Vendor Support Services Industry Growth
The growth of the Multi-Vendor Support Services industry is propelled by several factors. Firstly, the increasing complexity of IT infrastructure across all sectors necessitates specialized expertise in managing diverse technologies from various vendors. Secondly, the surge in cloud adoption and digital transformation initiatives necessitates seamless integration and support across multiple cloud platforms and applications. Finally, stringent regulatory compliance and data security concerns drive demand for reliable multi-vendor support services that ensure adherence to industry standards.
Challenges in the Multi-Vendor Support Services Industry Sector
The industry faces challenges including the need for specialized skills and expertise in managing multiple vendor technologies, the complexity of integrating diverse systems, and maintaining high service levels in the face of rapid technological advancements. These challenges often lead to increased operational costs and time-to-resolution issues, potentially impacting customer satisfaction. Further, intense competition and price pressure necessitate continuous innovation and efficiency improvements to maintain profitability.
Emerging Opportunities in Multi-Vendor Support Services Industry
Significant growth opportunities exist in emerging markets, especially in the Asia-Pacific region, where digital transformation is rapidly accelerating. The integration of AI and machine learning into support services presents a substantial opportunity to enhance efficiency and improve customer experience. Additionally, providing specialized support for emerging technologies such as IoT and edge computing will drive market expansion.
Leading Players in the Multi-Vendor Support Services Industry Market
- Quantum Corp
- Softcat plc
- IBM Corporation
- Hewlett Packard Enterprise Co
- Microsoft Corporation
- NetApp Inc
- Oracle Corporation
- Dell Technologies Inc
- Clear Technologies Inc
- Evernex Group SAS
- Blue Sky Group Ltd
Key Developments in Multi-Vendor Support Services Industry Industry
- October 2022: Google Cloud launched Third-Party Technology Support, designed to simplify troubleshooting across multiple cloud providers and applications.
- June 2022: Red Hat and Ericsson collaborated to streamline the integration of multiple technologies and vendors in multi-vendor network environments.
Strategic Outlook for Multi-Vendor Support Services Industry Market
The Multi-Vendor Support Services market is poised for continued growth, driven by the ongoing expansion of cloud computing, digital transformation, and the increasing complexity of IT infrastructure. Opportunities abound for companies that can offer innovative, integrated solutions and leverage emerging technologies like AI to enhance efficiency and customer satisfaction. The focus on proactive support and managed services will further drive market expansion.
Multi-Vendor Support Services Industry Segmentation
-
1. Service Type
- 1.1. Professional
- 1.2. Managed
-
2. Enterprise Size
- 2.1. Small & Medium Enterprises
- 2.2. Large Enterprises
-
3. End-user Verticals
- 3.1. IT & Telecommunication
- 3.2. BFSI
- 3.3. Healthcare
- 3.4. Energy & Power
- 3.5. Industrial Manufacturing
- 3.6. Others (
Multi-Vendor Support Services Industry Segmentation By Geography
- 1. North America
- 2. Europe
- 3. Asia Pacific
- 4. Latin America
- 5. Middle East and Africa
Multi-Vendor Support Services Industry REPORT HIGHLIGHTS
| Aspects | Details |
|---|---|
| Study Period | 2019-2033 |
| Base Year | 2024 |
| Estimated Year | 2025 |
| Forecast Period | 2025-2033 |
| Historical Period | 2019-2024 |
| Growth Rate | CAGR of 4.55% from 2019-2033 |
| Segmentation |
|
Table of Contents
- 1. Introduction
- 1.1. Research Scope
- 1.2. Market Segmentation
- 1.3. Research Methodology
- 1.4. Definitions and Assumptions
- 2. Executive Summary
- 2.1. Introduction
- 3. Market Dynamics
- 3.1. Introduction
- 3.2. Market Drivers
- 3.2.1. Rising Maintenance Cost of OEM Services
- 3.3. Market Restrains
- 3.3.1. Expensive Integration and Maintenance activities; Concerns on Data Security and Privacy; Stringent Data Regulations Imposed in Various Regions
- 3.4. Market Trends
- 3.4.1. IT & Telecommunication Vertical is Expected to Grow at a Significant Rate Over the Forecast Period
- 4. Market Factor Analysis
- 4.1. Porters Five Forces
- 4.2. Supply/Value Chain
- 4.3. PESTEL analysis
- 4.4. Market Entropy
- 4.5. Patent/Trademark Analysis
- 5. Global Multi-Vendor Support Services Industry Analysis, Insights and Forecast, 2019-2031
- 5.1. Market Analysis, Insights and Forecast - by Service Type
- 5.1.1. Professional
- 5.1.2. Managed
- 5.2. Market Analysis, Insights and Forecast - by Enterprise Size
- 5.2.1. Small & Medium Enterprises
- 5.2.2. Large Enterprises
- 5.3. Market Analysis, Insights and Forecast - by End-user Verticals
- 5.3.1. IT & Telecommunication
- 5.3.2. BFSI
- 5.3.3. Healthcare
- 5.3.4. Energy & Power
- 5.3.5. Industrial Manufacturing
- 5.3.6. Others (
- 5.4. Market Analysis, Insights and Forecast - by Region
- 5.4.1. North America
- 5.4.2. Europe
- 5.4.3. Asia Pacific
- 5.4.4. Latin America
- 5.4.5. Middle East and Africa
- 5.1. Market Analysis, Insights and Forecast - by Service Type
- 6. North America Multi-Vendor Support Services Industry Analysis, Insights and Forecast, 2019-2031
- 6.1. Market Analysis, Insights and Forecast - by Service Type
- 6.1.1. Professional
- 6.1.2. Managed
- 6.2. Market Analysis, Insights and Forecast - by Enterprise Size
- 6.2.1. Small & Medium Enterprises
- 6.2.2. Large Enterprises
- 6.3. Market Analysis, Insights and Forecast - by End-user Verticals
- 6.3.1. IT & Telecommunication
- 6.3.2. BFSI
- 6.3.3. Healthcare
- 6.3.4. Energy & Power
- 6.3.5. Industrial Manufacturing
- 6.3.6. Others (
- 6.1. Market Analysis, Insights and Forecast - by Service Type
- 7. Europe Multi-Vendor Support Services Industry Analysis, Insights and Forecast, 2019-2031
- 7.1. Market Analysis, Insights and Forecast - by Service Type
- 7.1.1. Professional
- 7.1.2. Managed
- 7.2. Market Analysis, Insights and Forecast - by Enterprise Size
- 7.2.1. Small & Medium Enterprises
- 7.2.2. Large Enterprises
- 7.3. Market Analysis, Insights and Forecast - by End-user Verticals
- 7.3.1. IT & Telecommunication
- 7.3.2. BFSI
- 7.3.3. Healthcare
- 7.3.4. Energy & Power
- 7.3.5. Industrial Manufacturing
- 7.3.6. Others (
- 7.1. Market Analysis, Insights and Forecast - by Service Type
- 8. Asia Pacific Multi-Vendor Support Services Industry Analysis, Insights and Forecast, 2019-2031
- 8.1. Market Analysis, Insights and Forecast - by Service Type
- 8.1.1. Professional
- 8.1.2. Managed
- 8.2. Market Analysis, Insights and Forecast - by Enterprise Size
- 8.2.1. Small & Medium Enterprises
- 8.2.2. Large Enterprises
- 8.3. Market Analysis, Insights and Forecast - by End-user Verticals
- 8.3.1. IT & Telecommunication
- 8.3.2. BFSI
- 8.3.3. Healthcare
- 8.3.4. Energy & Power
- 8.3.5. Industrial Manufacturing
- 8.3.6. Others (
- 8.1. Market Analysis, Insights and Forecast - by Service Type
- 9. Latin America Multi-Vendor Support Services Industry Analysis, Insights and Forecast, 2019-2031
- 9.1. Market Analysis, Insights and Forecast - by Service Type
- 9.1.1. Professional
- 9.1.2. Managed
- 9.2. Market Analysis, Insights and Forecast - by Enterprise Size
- 9.2.1. Small & Medium Enterprises
- 9.2.2. Large Enterprises
- 9.3. Market Analysis, Insights and Forecast - by End-user Verticals
- 9.3.1. IT & Telecommunication
- 9.3.2. BFSI
- 9.3.3. Healthcare
- 9.3.4. Energy & Power
- 9.3.5. Industrial Manufacturing
- 9.3.6. Others (
- 9.1. Market Analysis, Insights and Forecast - by Service Type
- 10. Middle East and Africa Multi-Vendor Support Services Industry Analysis, Insights and Forecast, 2019-2031
- 10.1. Market Analysis, Insights and Forecast - by Service Type
- 10.1.1. Professional
- 10.1.2. Managed
- 10.2. Market Analysis, Insights and Forecast - by Enterprise Size
- 10.2.1. Small & Medium Enterprises
- 10.2.2. Large Enterprises
- 10.3. Market Analysis, Insights and Forecast - by End-user Verticals
- 10.3.1. IT & Telecommunication
- 10.3.2. BFSI
- 10.3.3. Healthcare
- 10.3.4. Energy & Power
- 10.3.5. Industrial Manufacturing
- 10.3.6. Others (
- 10.1. Market Analysis, Insights and Forecast - by Service Type
- 11. North America Multi-Vendor Support Services Industry Analysis, Insights and Forecast, 2019-2031
- 11.1. Market Analysis, Insights and Forecast - By Country/Sub-region
- 11.1.1 United States
- 11.1.2 Canada
- 11.1.3 Mexico
- 12. Europe Multi-Vendor Support Services Industry Analysis, Insights and Forecast, 2019-2031
- 12.1. Market Analysis, Insights and Forecast - By Country/Sub-region
- 12.1.1 Germany
- 12.1.2 United Kingdom
- 12.1.3 France
- 12.1.4 Spain
- 12.1.5 Italy
- 12.1.6 Spain
- 12.1.7 Belgium
- 12.1.8 Netherland
- 12.1.9 Nordics
- 12.1.10 Rest of Europe
- 13. Asia Pacific Multi-Vendor Support Services Industry Analysis, Insights and Forecast, 2019-2031
- 13.1. Market Analysis, Insights and Forecast - By Country/Sub-region
- 13.1.1 China
- 13.1.2 Japan
- 13.1.3 India
- 13.1.4 South Korea
- 13.1.5 Southeast Asia
- 13.1.6 Australia
- 13.1.7 Indonesia
- 13.1.8 Phillipes
- 13.1.9 Singapore
- 13.1.10 Thailandc
- 13.1.11 Rest of Asia Pacific
- 14. South America Multi-Vendor Support Services Industry Analysis, Insights and Forecast, 2019-2031
- 14.1. Market Analysis, Insights and Forecast - By Country/Sub-region
- 14.1.1 Brazil
- 14.1.2 Argentina
- 14.1.3 Peru
- 14.1.4 Chile
- 14.1.5 Colombia
- 14.1.6 Ecuador
- 14.1.7 Venezuela
- 14.1.8 Rest of South America
- 15. North America Multi-Vendor Support Services Industry Analysis, Insights and Forecast, 2019-2031
- 15.1. Market Analysis, Insights and Forecast - By Country/Sub-region
- 15.1.1 United States
- 15.1.2 Canada
- 15.1.3 Mexico
- 16. MEA Multi-Vendor Support Services Industry Analysis, Insights and Forecast, 2019-2031
- 16.1. Market Analysis, Insights and Forecast - By Country/Sub-region
- 16.1.1 United Arab Emirates
- 16.1.2 Saudi Arabia
- 16.1.3 South Africa
- 16.1.4 Rest of Middle East and Africa
- 17. Competitive Analysis
- 17.1. Global Market Share Analysis 2024
- 17.2. Company Profiles
- 17.2.1 Quantum Corp
- 17.2.1.1. Overview
- 17.2.1.2. Products
- 17.2.1.3. SWOT Analysis
- 17.2.1.4. Recent Developments
- 17.2.1.5. Financials (Based on Availability)
- 17.2.2 Softcat plc
- 17.2.2.1. Overview
- 17.2.2.2. Products
- 17.2.2.3. SWOT Analysis
- 17.2.2.4. Recent Developments
- 17.2.2.5. Financials (Based on Availability)
- 17.2.3 IBM Corporation
- 17.2.3.1. Overview
- 17.2.3.2. Products
- 17.2.3.3. SWOT Analysis
- 17.2.3.4. Recent Developments
- 17.2.3.5. Financials (Based on Availability)
- 17.2.4 Hewlett Packard Enterprise Co
- 17.2.4.1. Overview
- 17.2.4.2. Products
- 17.2.4.3. SWOT Analysis
- 17.2.4.4. Recent Developments
- 17.2.4.5. Financials (Based on Availability)
- 17.2.5 Microsoft Corporation
- 17.2.5.1. Overview
- 17.2.5.2. Products
- 17.2.5.3. SWOT Analysis
- 17.2.5.4. Recent Developments
- 17.2.5.5. Financials (Based on Availability)
- 17.2.6 NetApp Inc
- 17.2.6.1. Overview
- 17.2.6.2. Products
- 17.2.6.3. SWOT Analysis
- 17.2.6.4. Recent Developments
- 17.2.6.5. Financials (Based on Availability)
- 17.2.7 Oracle Corporation
- 17.2.7.1. Overview
- 17.2.7.2. Products
- 17.2.7.3. SWOT Analysis
- 17.2.7.4. Recent Developments
- 17.2.7.5. Financials (Based on Availability)
- 17.2.8 Dell Technologies Inc
- 17.2.8.1. Overview
- 17.2.8.2. Products
- 17.2.8.3. SWOT Analysis
- 17.2.8.4. Recent Developments
- 17.2.8.5. Financials (Based on Availability)
- 17.2.9 Clear Technologies Inc
- 17.2.9.1. Overview
- 17.2.9.2. Products
- 17.2.9.3. SWOT Analysis
- 17.2.9.4. Recent Developments
- 17.2.9.5. Financials (Based on Availability)
- 17.2.10 Evernex Group SAS
- 17.2.10.1. Overview
- 17.2.10.2. Products
- 17.2.10.3. SWOT Analysis
- 17.2.10.4. Recent Developments
- 17.2.10.5. Financials (Based on Availability)
- 17.2.11 Blue Sky Group Ltd
- 17.2.11.1. Overview
- 17.2.11.2. Products
- 17.2.11.3. SWOT Analysis
- 17.2.11.4. Recent Developments
- 17.2.11.5. Financials (Based on Availability)
- 17.2.1 Quantum Corp
List of Figures
- Figure 1: Global Multi-Vendor Support Services Industry Revenue Breakdown (Million, %) by Region 2024 & 2032
- Figure 2: North America Multi-Vendor Support Services Industry Revenue (Million), by Country 2024 & 2032
- Figure 3: North America Multi-Vendor Support Services Industry Revenue Share (%), by Country 2024 & 2032
- Figure 4: Europe Multi-Vendor Support Services Industry Revenue (Million), by Country 2024 & 2032
- Figure 5: Europe Multi-Vendor Support Services Industry Revenue Share (%), by Country 2024 & 2032
- Figure 6: Asia Pacific Multi-Vendor Support Services Industry Revenue (Million), by Country 2024 & 2032
- Figure 7: Asia Pacific Multi-Vendor Support Services Industry Revenue Share (%), by Country 2024 & 2032
- Figure 8: South America Multi-Vendor Support Services Industry Revenue (Million), by Country 2024 & 2032
- Figure 9: South America Multi-Vendor Support Services Industry Revenue Share (%), by Country 2024 & 2032
- Figure 10: North America Multi-Vendor Support Services Industry Revenue (Million), by Country 2024 & 2032
- Figure 11: North America Multi-Vendor Support Services Industry Revenue Share (%), by Country 2024 & 2032
- Figure 12: MEA Multi-Vendor Support Services Industry Revenue (Million), by Country 2024 & 2032
- Figure 13: MEA Multi-Vendor Support Services Industry Revenue Share (%), by Country 2024 & 2032
- Figure 14: North America Multi-Vendor Support Services Industry Revenue (Million), by Service Type 2024 & 2032
- Figure 15: North America Multi-Vendor Support Services Industry Revenue Share (%), by Service Type 2024 & 2032
- Figure 16: North America Multi-Vendor Support Services Industry Revenue (Million), by Enterprise Size 2024 & 2032
- Figure 17: North America Multi-Vendor Support Services Industry Revenue Share (%), by Enterprise Size 2024 & 2032
- Figure 18: North America Multi-Vendor Support Services Industry Revenue (Million), by End-user Verticals 2024 & 2032
- Figure 19: North America Multi-Vendor Support Services Industry Revenue Share (%), by End-user Verticals 2024 & 2032
- Figure 20: North America Multi-Vendor Support Services Industry Revenue (Million), by Country 2024 & 2032
- Figure 21: North America Multi-Vendor Support Services Industry Revenue Share (%), by Country 2024 & 2032
- Figure 22: Europe Multi-Vendor Support Services Industry Revenue (Million), by Service Type 2024 & 2032
- Figure 23: Europe Multi-Vendor Support Services Industry Revenue Share (%), by Service Type 2024 & 2032
- Figure 24: Europe Multi-Vendor Support Services Industry Revenue (Million), by Enterprise Size 2024 & 2032
- Figure 25: Europe Multi-Vendor Support Services Industry Revenue Share (%), by Enterprise Size 2024 & 2032
- Figure 26: Europe Multi-Vendor Support Services Industry Revenue (Million), by End-user Verticals 2024 & 2032
- Figure 27: Europe Multi-Vendor Support Services Industry Revenue Share (%), by End-user Verticals 2024 & 2032
- Figure 28: Europe Multi-Vendor Support Services Industry Revenue (Million), by Country 2024 & 2032
- Figure 29: Europe Multi-Vendor Support Services Industry Revenue Share (%), by Country 2024 & 2032
- Figure 30: Asia Pacific Multi-Vendor Support Services Industry Revenue (Million), by Service Type 2024 & 2032
- Figure 31: Asia Pacific Multi-Vendor Support Services Industry Revenue Share (%), by Service Type 2024 & 2032
- Figure 32: Asia Pacific Multi-Vendor Support Services Industry Revenue (Million), by Enterprise Size 2024 & 2032
- Figure 33: Asia Pacific Multi-Vendor Support Services Industry Revenue Share (%), by Enterprise Size 2024 & 2032
- Figure 34: Asia Pacific Multi-Vendor Support Services Industry Revenue (Million), by End-user Verticals 2024 & 2032
- Figure 35: Asia Pacific Multi-Vendor Support Services Industry Revenue Share (%), by End-user Verticals 2024 & 2032
- Figure 36: Asia Pacific Multi-Vendor Support Services Industry Revenue (Million), by Country 2024 & 2032
- Figure 37: Asia Pacific Multi-Vendor Support Services Industry Revenue Share (%), by Country 2024 & 2032
- Figure 38: Latin America Multi-Vendor Support Services Industry Revenue (Million), by Service Type 2024 & 2032
- Figure 39: Latin America Multi-Vendor Support Services Industry Revenue Share (%), by Service Type 2024 & 2032
- Figure 40: Latin America Multi-Vendor Support Services Industry Revenue (Million), by Enterprise Size 2024 & 2032
- Figure 41: Latin America Multi-Vendor Support Services Industry Revenue Share (%), by Enterprise Size 2024 & 2032
- Figure 42: Latin America Multi-Vendor Support Services Industry Revenue (Million), by End-user Verticals 2024 & 2032
- Figure 43: Latin America Multi-Vendor Support Services Industry Revenue Share (%), by End-user Verticals 2024 & 2032
- Figure 44: Latin America Multi-Vendor Support Services Industry Revenue (Million), by Country 2024 & 2032
- Figure 45: Latin America Multi-Vendor Support Services Industry Revenue Share (%), by Country 2024 & 2032
- Figure 46: Middle East and Africa Multi-Vendor Support Services Industry Revenue (Million), by Service Type 2024 & 2032
- Figure 47: Middle East and Africa Multi-Vendor Support Services Industry Revenue Share (%), by Service Type 2024 & 2032
- Figure 48: Middle East and Africa Multi-Vendor Support Services Industry Revenue (Million), by Enterprise Size 2024 & 2032
- Figure 49: Middle East and Africa Multi-Vendor Support Services Industry Revenue Share (%), by Enterprise Size 2024 & 2032
- Figure 50: Middle East and Africa Multi-Vendor Support Services Industry Revenue (Million), by End-user Verticals 2024 & 2032
- Figure 51: Middle East and Africa Multi-Vendor Support Services Industry Revenue Share (%), by End-user Verticals 2024 & 2032
- Figure 52: Middle East and Africa Multi-Vendor Support Services Industry Revenue (Million), by Country 2024 & 2032
- Figure 53: Middle East and Africa Multi-Vendor Support Services Industry Revenue Share (%), by Country 2024 & 2032
List of Tables
- Table 1: Global Multi-Vendor Support Services Industry Revenue Million Forecast, by Region 2019 & 2032
- Table 2: Global Multi-Vendor Support Services Industry Revenue Million Forecast, by Service Type 2019 & 2032
- Table 3: Global Multi-Vendor Support Services Industry Revenue Million Forecast, by Enterprise Size 2019 & 2032
- Table 4: Global Multi-Vendor Support Services Industry Revenue Million Forecast, by End-user Verticals 2019 & 2032
- Table 5: Global Multi-Vendor Support Services Industry Revenue Million Forecast, by Region 2019 & 2032
- Table 6: Global Multi-Vendor Support Services Industry Revenue Million Forecast, by Country 2019 & 2032
- Table 7: United States Multi-Vendor Support Services Industry Revenue (Million) Forecast, by Application 2019 & 2032
- Table 8: Canada Multi-Vendor Support Services Industry Revenue (Million) Forecast, by Application 2019 & 2032
- Table 9: Mexico Multi-Vendor Support Services Industry Revenue (Million) Forecast, by Application 2019 & 2032
- Table 10: Global Multi-Vendor Support Services Industry Revenue Million Forecast, by Country 2019 & 2032
- Table 11: Germany Multi-Vendor Support Services Industry Revenue (Million) Forecast, by Application 2019 & 2032
- Table 12: United Kingdom Multi-Vendor Support Services Industry Revenue (Million) Forecast, by Application 2019 & 2032
- Table 13: France Multi-Vendor Support Services Industry Revenue (Million) Forecast, by Application 2019 & 2032
- Table 14: Spain Multi-Vendor Support Services Industry Revenue (Million) Forecast, by Application 2019 & 2032
- Table 15: Italy Multi-Vendor Support Services Industry Revenue (Million) Forecast, by Application 2019 & 2032
- Table 16: Spain Multi-Vendor Support Services Industry Revenue (Million) Forecast, by Application 2019 & 2032
- Table 17: Belgium Multi-Vendor Support Services Industry Revenue (Million) Forecast, by Application 2019 & 2032
- Table 18: Netherland Multi-Vendor Support Services Industry Revenue (Million) Forecast, by Application 2019 & 2032
- Table 19: Nordics Multi-Vendor Support Services Industry Revenue (Million) Forecast, by Application 2019 & 2032
- Table 20: Rest of Europe Multi-Vendor Support Services Industry Revenue (Million) Forecast, by Application 2019 & 2032
- Table 21: Global Multi-Vendor Support Services Industry Revenue Million Forecast, by Country 2019 & 2032
- Table 22: China Multi-Vendor Support Services Industry Revenue (Million) Forecast, by Application 2019 & 2032
- Table 23: Japan Multi-Vendor Support Services Industry Revenue (Million) Forecast, by Application 2019 & 2032
- Table 24: India Multi-Vendor Support Services Industry Revenue (Million) Forecast, by Application 2019 & 2032
- Table 25: South Korea Multi-Vendor Support Services Industry Revenue (Million) Forecast, by Application 2019 & 2032
- Table 26: Southeast Asia Multi-Vendor Support Services Industry Revenue (Million) Forecast, by Application 2019 & 2032
- Table 27: Australia Multi-Vendor Support Services Industry Revenue (Million) Forecast, by Application 2019 & 2032
- Table 28: Indonesia Multi-Vendor Support Services Industry Revenue (Million) Forecast, by Application 2019 & 2032
- Table 29: Phillipes Multi-Vendor Support Services Industry Revenue (Million) Forecast, by Application 2019 & 2032
- Table 30: Singapore Multi-Vendor Support Services Industry Revenue (Million) Forecast, by Application 2019 & 2032
- Table 31: Thailandc Multi-Vendor Support Services Industry Revenue (Million) Forecast, by Application 2019 & 2032
- Table 32: Rest of Asia Pacific Multi-Vendor Support Services Industry Revenue (Million) Forecast, by Application 2019 & 2032
- Table 33: Global Multi-Vendor Support Services Industry Revenue Million Forecast, by Country 2019 & 2032
- Table 34: Brazil Multi-Vendor Support Services Industry Revenue (Million) Forecast, by Application 2019 & 2032
- Table 35: Argentina Multi-Vendor Support Services Industry Revenue (Million) Forecast, by Application 2019 & 2032
- Table 36: Peru Multi-Vendor Support Services Industry Revenue (Million) Forecast, by Application 2019 & 2032
- Table 37: Chile Multi-Vendor Support Services Industry Revenue (Million) Forecast, by Application 2019 & 2032
- Table 38: Colombia Multi-Vendor Support Services Industry Revenue (Million) Forecast, by Application 2019 & 2032
- Table 39: Ecuador Multi-Vendor Support Services Industry Revenue (Million) Forecast, by Application 2019 & 2032
- Table 40: Venezuela Multi-Vendor Support Services Industry Revenue (Million) Forecast, by Application 2019 & 2032
- Table 41: Rest of South America Multi-Vendor Support Services Industry Revenue (Million) Forecast, by Application 2019 & 2032
- Table 42: Global Multi-Vendor Support Services Industry Revenue Million Forecast, by Country 2019 & 2032
- Table 43: United States Multi-Vendor Support Services Industry Revenue (Million) Forecast, by Application 2019 & 2032
- Table 44: Canada Multi-Vendor Support Services Industry Revenue (Million) Forecast, by Application 2019 & 2032
- Table 45: Mexico Multi-Vendor Support Services Industry Revenue (Million) Forecast, by Application 2019 & 2032
- Table 46: Global Multi-Vendor Support Services Industry Revenue Million Forecast, by Country 2019 & 2032
- Table 47: United Arab Emirates Multi-Vendor Support Services Industry Revenue (Million) Forecast, by Application 2019 & 2032
- Table 48: Saudi Arabia Multi-Vendor Support Services Industry Revenue (Million) Forecast, by Application 2019 & 2032
- Table 49: South Africa Multi-Vendor Support Services Industry Revenue (Million) Forecast, by Application 2019 & 2032
- Table 50: Rest of Middle East and Africa Multi-Vendor Support Services Industry Revenue (Million) Forecast, by Application 2019 & 2032
- Table 51: Global Multi-Vendor Support Services Industry Revenue Million Forecast, by Service Type 2019 & 2032
- Table 52: Global Multi-Vendor Support Services Industry Revenue Million Forecast, by Enterprise Size 2019 & 2032
- Table 53: Global Multi-Vendor Support Services Industry Revenue Million Forecast, by End-user Verticals 2019 & 2032
- Table 54: Global Multi-Vendor Support Services Industry Revenue Million Forecast, by Country 2019 & 2032
- Table 55: Global Multi-Vendor Support Services Industry Revenue Million Forecast, by Service Type 2019 & 2032
- Table 56: Global Multi-Vendor Support Services Industry Revenue Million Forecast, by Enterprise Size 2019 & 2032
- Table 57: Global Multi-Vendor Support Services Industry Revenue Million Forecast, by End-user Verticals 2019 & 2032
- Table 58: Global Multi-Vendor Support Services Industry Revenue Million Forecast, by Country 2019 & 2032
- Table 59: Global Multi-Vendor Support Services Industry Revenue Million Forecast, by Service Type 2019 & 2032
- Table 60: Global Multi-Vendor Support Services Industry Revenue Million Forecast, by Enterprise Size 2019 & 2032
- Table 61: Global Multi-Vendor Support Services Industry Revenue Million Forecast, by End-user Verticals 2019 & 2032
- Table 62: Global Multi-Vendor Support Services Industry Revenue Million Forecast, by Country 2019 & 2032
- Table 63: Global Multi-Vendor Support Services Industry Revenue Million Forecast, by Service Type 2019 & 2032
- Table 64: Global Multi-Vendor Support Services Industry Revenue Million Forecast, by Enterprise Size 2019 & 2032
- Table 65: Global Multi-Vendor Support Services Industry Revenue Million Forecast, by End-user Verticals 2019 & 2032
- Table 66: Global Multi-Vendor Support Services Industry Revenue Million Forecast, by Country 2019 & 2032
- Table 67: Global Multi-Vendor Support Services Industry Revenue Million Forecast, by Service Type 2019 & 2032
- Table 68: Global Multi-Vendor Support Services Industry Revenue Million Forecast, by Enterprise Size 2019 & 2032
- Table 69: Global Multi-Vendor Support Services Industry Revenue Million Forecast, by End-user Verticals 2019 & 2032
- Table 70: Global Multi-Vendor Support Services Industry Revenue Million Forecast, by Country 2019 & 2032
Frequently Asked Questions
1. What is the projected Compound Annual Growth Rate (CAGR) of the Multi-Vendor Support Services Industry?
The projected CAGR is approximately 4.55%.
2. Which companies are prominent players in the Multi-Vendor Support Services Industry?
Key companies in the market include Quantum Corp, Softcat plc, IBM Corporation, Hewlett Packard Enterprise Co, Microsoft Corporation, NetApp Inc, Oracle Corporation, Dell Technologies Inc, Clear Technologies Inc, Evernex Group SAS, Blue Sky Group Ltd.
3. What are the main segments of the Multi-Vendor Support Services Industry?
The market segments include Service Type, Enterprise Size, End-user Verticals.
4. Can you provide details about the market size?
The market size is estimated to be USD 58.89 Million as of 2022.
5. What are some drivers contributing to market growth?
Rising Maintenance Cost of OEM Services.
6. What are the notable trends driving market growth?
IT & Telecommunication Vertical is Expected to Grow at a Significant Rate Over the Forecast Period.
7. Are there any restraints impacting market growth?
Expensive Integration and Maintenance activities; Concerns on Data Security and Privacy; Stringent Data Regulations Imposed in Various Regions.
8. Can you provide examples of recent developments in the market?
October 2022 - It might be challenging to troubleshoot cloud investments when using numerous cloud providers and apps. Because of this, Google Cloud Third-Party Technology Support is offered as a feature with Premium Support for Google Cloud and is designed to seamlessly resolve issues involving many vendors while also setting up, configuring, and troubleshooting organizations. Intending to foster and ensure infrastructure innovation in the cloud, HashiCorp, a Google technology partner, regularly collaborates with Google Cloud.
9. What pricing options are available for accessing the report?
Pricing options include single-user, multi-user, and enterprise licenses priced at USD 4750, USD 5250, and USD 8750 respectively.
10. Is the market size provided in terms of value or volume?
The market size is provided in terms of value, measured in Million.
11. Are there any specific market keywords associated with the report?
Yes, the market keyword associated with the report is "Multi-Vendor Support Services Industry," which aids in identifying and referencing the specific market segment covered.
12. How do I determine which pricing option suits my needs best?
The pricing options vary based on user requirements and access needs. Individual users may opt for single-user licenses, while businesses requiring broader access may choose multi-user or enterprise licenses for cost-effective access to the report.
13. Are there any additional resources or data provided in the Multi-Vendor Support Services Industry report?
While the report offers comprehensive insights, it's advisable to review the specific contents or supplementary materials provided to ascertain if additional resources or data are available.
14. How can I stay updated on further developments or reports in the Multi-Vendor Support Services Industry?
To stay informed about further developments, trends, and reports in the Multi-Vendor Support Services Industry, consider subscribing to industry newsletters, following relevant companies and organizations, or regularly checking reputable industry news sources and publications.
Methodology
Step 1 - Identification of Relevant Samples Size from Population Database


Step 2 - Approaches for Defining Global Market Size (Value, Volume* & Price*)

Note*: In applicable scenarios
Step 3 - Data Sources
Primary Research
- Web Analytics
- Survey Reports
- Research Institute
- Latest Research Reports
- Opinion Leaders
Secondary Research
- Annual Reports
- White Paper
- Latest Press Release
- Industry Association
- Paid Database
- Investor Presentations

Step 4 - Data Triangulation
Involves using different sources of information in order to increase the validity of a study
These sources are likely to be stakeholders in a program - participants, other researchers, program staff, other community members, and so on.
Then we put all data in single framework & apply various statistical tools to find out the dynamic on the market.
During the analysis stage, feedback from the stakeholder groups would be compared to determine areas of agreement as well as areas of divergence


