
Key Insights
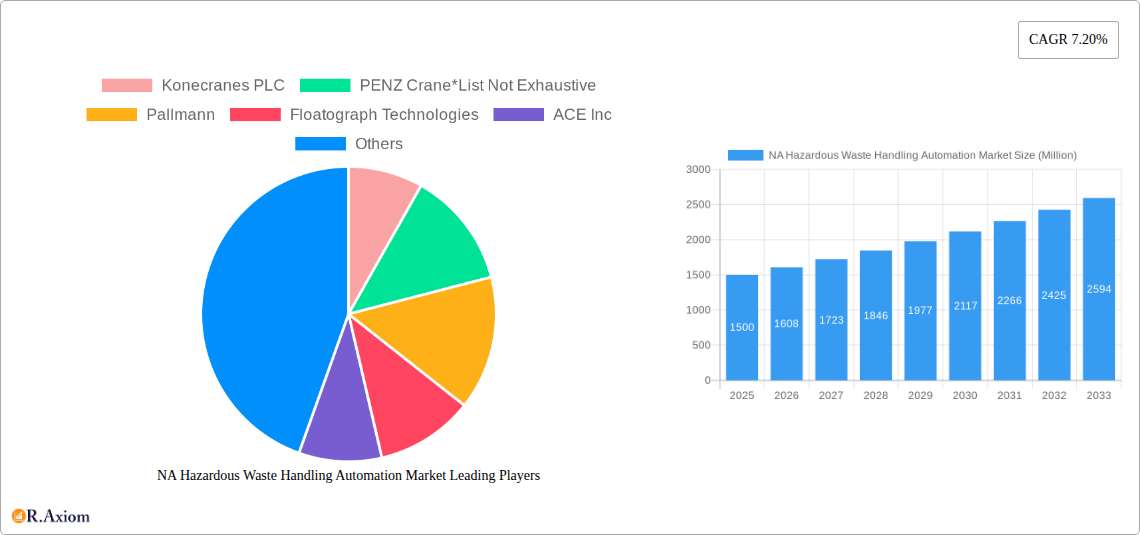
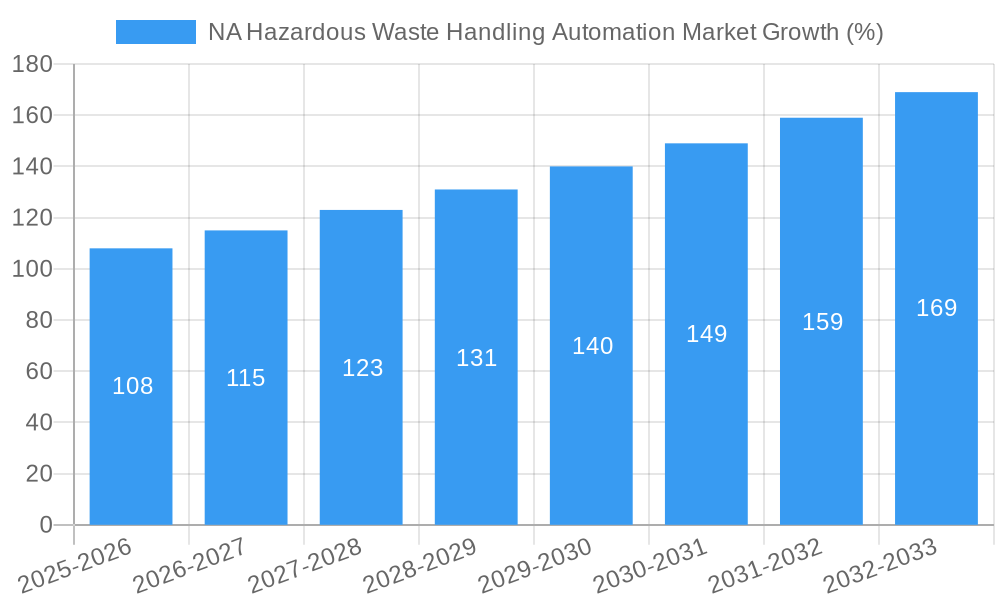
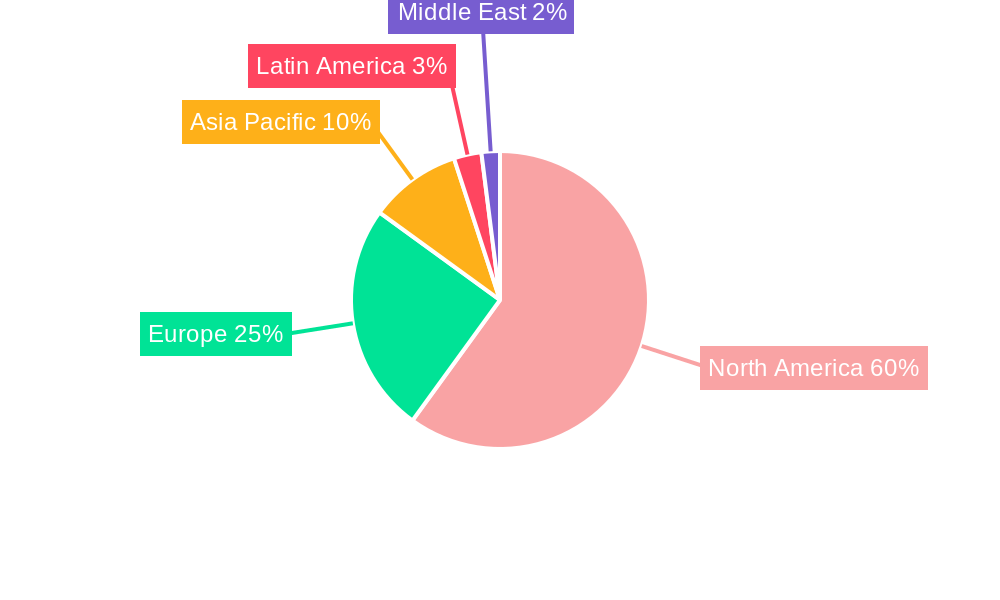
The North American hazardous waste handling automation market is experiencing robust growth, driven by stringent environmental regulations, increasing industrial waste generation, and a rising focus on worker safety. The market, estimated at $XX million in 2025, is projected to exhibit a Compound Annual Growth Rate (CAGR) of 7.20% from 2025 to 2033. Key drivers include the need for efficient and safe waste management solutions, particularly in sectors like manufacturing, chemical processing, and energy production. Automation technologies, including robotic manipulator arms, telescoping masts, and size reduction systems, are playing a crucial role in improving handling processes, reducing human intervention in hazardous environments, and minimizing the risk of accidents and environmental contamination. Growth is further fueled by advancements in sensor technology, AI-powered systems for waste sorting and classification, and the increasing adoption of Industry 4.0 principles within waste management facilities. While the market faces certain restraints such as the high initial investment costs associated with automation systems and the need for skilled personnel for operation and maintenance, the long-term benefits in terms of cost savings, improved efficiency, and enhanced safety are expected to outweigh these challenges. The market segmentation reveals significant opportunities across different waste types (listed, characteristic, universal, mixed), product categories, and end-user industries. North America, particularly the US and Canada, constitutes a major market share due to the presence of established industrial sectors and robust environmental regulations.
The competitive landscape is characterized by a mix of established players and emerging technology providers. Companies like Konecranes PLC, Pallmann, and PaR Systems Inc. are actively contributing to market growth through innovative product development and strategic partnerships. Future growth will be significantly influenced by technological advancements, government initiatives promoting sustainable waste management practices, and the increasing adoption of automation across various segments of the hazardous waste handling industry. The market is expected to witness further consolidation, with larger players potentially acquiring smaller companies to expand their product portfolios and market reach. Continued innovation in areas like AI, robotics, and remote operation will be critical to shaping the trajectory of this dynamic market in the coming years. Specific growth rates for sub-segments will vary depending on technological innovation rates and regulatory pressures.
NA Hazardous Waste Handling Automation Market: A Comprehensive Report (2019-2033)
This comprehensive report provides a detailed analysis of the North American (NA) Hazardous Waste Handling Automation Market, offering actionable insights for stakeholders across the industry. The report covers the period 2019-2033, with a focus on the forecast period 2025-2033 and a base year of 2025. The market is segmented by type of waste, product type, end-user industry, and country (US and Canada). The total market size in 2025 is estimated at xx Million and is projected to reach xx Million by 2033, exhibiting a CAGR of xx%.
NA Hazardous Waste Handling Automation Market Concentration & Innovation
The NA hazardous waste handling automation market exhibits a moderately concentrated landscape, with several key players holding significant market share. While precise market share figures for individual companies are proprietary data, Konecranes PLC, PENZ Crane, Pallmann, Floatograph Technologies, ACE Inc, PaR Systems Inc, Hiab, Hosokawa Micron Powder Systems, DX Engineering, and Terex MHPS GmbH represent a significant portion of the market. Innovation is driven by stringent environmental regulations, rising labor costs, and the increasing need for efficient and safe hazardous waste management. Recent M&A activities, such as DX Engineering's acquisition of Hi-Z Antennas in August 2022, reflect consolidation and strategic expansion within the sector. While the exact value of this deal remains undisclosed, it highlights the growing importance of technological integration within the industry. The average M&A deal value in the sector for the period 2019-2024 is estimated to be around xx Million.
- Market Concentration: Moderately concentrated, with several dominant players.
- Innovation Drivers: Stringent environmental regulations, rising labor costs, demand for safety and efficiency.
- Regulatory Frameworks: Significant influence on market growth and technological adoption.
- Product Substitutes: Limited direct substitutes, but alternative waste management approaches pose indirect competition.
- End-User Trends: Growing focus on sustainability and automation across various industries.
- M&A Activities: Increasing consolidation and strategic acquisitions driving market evolution.
NA Hazardous Waste Handling Automation Market Industry Trends & Insights
The NA hazardous waste handling automation market is experiencing robust growth fueled by several key trends. The increasing stringency of environmental regulations is a major driver, pushing companies to adopt more efficient and environmentally friendly waste management practices. Furthermore, the rising costs of manual labor are making automation a more economically viable option. Technological advancements, such as the development of advanced robotics and AI-powered systems, are enhancing the capabilities and efficiency of waste handling automation solutions. The market penetration of automated systems within the hazardous waste sector shows significant growth, particularly in the manufacturing and chemical industries. Consumer preferences for environmentally conscious practices are indirectly influencing this market as well, pushing corporations to adopt more eco-friendly methods. Competitive dynamics are characterized by both collaboration and competition, with companies focusing on product differentiation, technological innovation, and strategic partnerships. The market is expected to witness further consolidation through mergers and acquisitions in the coming years.
Dominant Markets & Segments in NA Hazardous Waste Handling Automation Market
The US dominates the NA hazardous waste handling automation market, owing to its larger industrial base and stricter environmental regulations compared to Canada. Within the segmentation:
By Type of Waste: Listed wastes currently hold the largest market share due to the higher volume and stricter regulations associated with their handling.
By Product: Cranes and manipulator arms represent the largest segments due to their versatile applications in various waste handling processes. Size reduction systems show significant growth potential due to the increasing need for efficient waste volume reduction.
By End-user Industry: The manufacturing and chemical industries are the key drivers of market growth due to their large volume of hazardous waste generation.
Key Drivers (US): Strong industrial base, stringent environmental regulations, robust infrastructure.
Key Drivers (Canada): Growing industrial sector, increasing focus on environmental sustainability.
Dominant Region: United States.
Dominant Segment (By Type of Waste): Listed Wastes.
Dominant Segment (By Product): Cranes and Manipulator Arms.
Dominant Segment (By End-user Industry): Manufacturing and Chemical Industries.
NA Hazardous Waste Handling Automation Market Product Developments
Recent product innovations have focused on enhancing safety, efficiency, and precision in hazardous waste handling. This includes the development of advanced robotics, AI-powered systems for automated sorting and segregation, and improved materials handling equipment. Companies are emphasizing the integration of IoT and cloud-based technologies to enable real-time monitoring and data analysis of waste handling processes. These advancements are leading to better control of hazardous materials, reduced risk of accidents, and improved overall efficiency. The market fit for these innovations is very strong, driven by increasing demand for sustainable and safe waste management practices.
Report Scope & Segmentation Analysis
This report segments the NA hazardous waste handling automation market by:
Type of Waste: Listed Wastes, Characteristic Wastes, Universal Wastes, Mixed Wastes. Growth projections vary by waste type, with listed wastes showing the highest growth due to stringent regulations.
Product: Manipulator Arms, Telescoping Masts, Cranes, Trusses, Size Reduction Systems, Other Products. Cranes and manipulator arms dominate the market share, but size reduction systems are expected to show significant growth.
End-user Industry: Manufacturing, Chemical, Energy, Consumer Care, Government, Other End-user Industries. The manufacturing and chemical sectors currently lead in market share, with steady growth projected across all segments.
Country: US, Canada. The US is the larger market, but Canada shows potential for growth in alignment with environmental regulations.
Key Drivers of NA Hazardous Waste Handling Automation Market Growth
Several factors are driving the growth of the NA hazardous waste handling automation market:
- Stringent Environmental Regulations: Compliance mandates are forcing companies to adopt automated solutions.
- Rising Labor Costs: Automation provides a cost-effective alternative to manual labor.
- Technological Advancements: Innovations in robotics and AI are enhancing efficiency and safety.
- Improved Safety and Reduced Risk: Automation minimizes human exposure to hazardous materials.
Challenges in the NA Hazardous Waste Handling Automation Market Sector
The market faces some challenges:
- High Initial Investment Costs: Implementing automated systems requires significant upfront investment.
- Integration Complexity: Integrating new systems with existing infrastructure can be challenging.
- Regulatory Hurdles: Navigating complex environmental regulations can be time-consuming.
- Lack of Skilled Labor: Operating and maintaining automated systems requires specialized skills. This leads to xx Million of annual loss to the industry in training and labor.
Emerging Opportunities in NA Hazardous Waste Handling Automation Market
Several emerging opportunities are shaping the market:
- AI and Machine Learning Integration: Advanced algorithms can optimize waste handling processes.
- Remote Monitoring and Control: IoT enables real-time monitoring and remote operation of systems.
- Sustainable Waste Management Practices: Automation facilitates environmentally friendly waste disposal.
- Expansion into Emerging Markets: Growing industrial sectors in other North American regions create new opportunities.
Leading Players in the NA Hazardous Waste Handling Automation Market Market
- Konecranes PLC
- PENZ Crane
- Pallmann
- Floatograph Technologies
- ACE Inc
- PaR Systems Inc
- Hiab
- Hosokawa Micron Powder Systems
- DX Engineering
- Terex MHPS GmbH
Key Developments in NA Hazardous Waste Handling Automation Market Industry
- August 2022: DX Engineering acquired Hi-Z Antennas, expanding its product portfolio and capabilities. This demonstrates an increase in technological integration within the market.
- March 2022: XL Kranlogistik's significant order for Terex tower cranes shows growing demand for automated crane solutions within the waste handling sector. This purchase added xx Million to the Terex MHPS GmbH revenue.
Strategic Outlook for NA Hazardous Waste Handling Automation Market Market
The NA hazardous waste handling automation market is poised for sustained growth, driven by technological advancements, stringent environmental regulations, and increasing demand for efficient and safe waste management practices. Companies that focus on innovation, strategic partnerships, and adapting to evolving regulatory frameworks will be well-positioned to capitalize on the market's significant potential. The expanding industrial sector across North America promises strong future growth and market expansion.
NA Hazardous Waste Handling Automation Market Segmentation
-
1. Type of Waste
- 1.1. Listed Wastes
- 1.2. Characteristic Wastes
- 1.3. Universal Wastes
- 1.4. Mixed Wastes
-
2. Product
- 2.1. Manipulator Arms
- 2.2. Telescoping Masts
- 2.3. Cranes
- 2.4. Trusses
- 2.5. Size Reduction Systems
- 2.6. Other Products
-
3. End-user Industry
- 3.1. Manufacturing
- 3.2. Chemical
- 3.3. Energy
- 3.4. Consumer Care
- 3.5. Government
- 3.6. Other End-user Industries
NA Hazardous Waste Handling Automation Market Segmentation By Geography
-
1. North America
- 1.1. United States
- 1.2. Canada
- 1.3. Mexico
-
2. South America
- 2.1. Brazil
- 2.2. Argentina
- 2.3. Rest of South America
-
3. Europe
- 3.1. United Kingdom
- 3.2. Germany
- 3.3. France
- 3.4. Italy
- 3.5. Spain
- 3.6. Russia
- 3.7. Benelux
- 3.8. Nordics
- 3.9. Rest of Europe
-
4. Middle East & Africa
- 4.1. Turkey
- 4.2. Israel
- 4.3. GCC
- 4.4. North Africa
- 4.5. South Africa
- 4.6. Rest of Middle East & Africa
-
5. Asia Pacific
- 5.1. China
- 5.2. India
- 5.3. Japan
- 5.4. South Korea
- 5.5. ASEAN
- 5.6. Oceania
- 5.7. Rest of Asia Pacific
NA Hazardous Waste Handling Automation Market REPORT HIGHLIGHTS
| Aspects | Details |
|---|---|
| Study Period | 2019-2033 |
| Base Year | 2024 |
| Estimated Year | 2025 |
| Forecast Period | 2025-2033 |
| Historical Period | 2019-2024 |
| Growth Rate | CAGR of 7.20% from 2019-2033 |
| Segmentation |
|
Table of Contents
- 1. Introduction
- 1.1. Research Scope
- 1.2. Market Segmentation
- 1.3. Research Methodology
- 1.4. Definitions and Assumptions
- 2. Executive Summary
- 2.1. Introduction
- 3. Market Dynamics
- 3.1. Introduction
- 3.2. Market Drivers
- 3.2.1. Government and Industry Regulations; Growing Concerns overWaste Management
- 3.3. Market Restrains
- 3.3.1. Fluctuations in Raw Material Prices
- 3.4. Market Trends
- 3.4.1. Growing Concerns Over Listed Waste Management Expected to Drive Market Demand
- 4. Market Factor Analysis
- 4.1. Porters Five Forces
- 4.2. Supply/Value Chain
- 4.3. PESTEL analysis
- 4.4. Market Entropy
- 4.5. Patent/Trademark Analysis
- 5. Global NA Hazardous Waste Handling Automation Market Analysis, Insights and Forecast, 2019-2031
- 5.1. Market Analysis, Insights and Forecast - by Type of Waste
- 5.1.1. Listed Wastes
- 5.1.2. Characteristic Wastes
- 5.1.3. Universal Wastes
- 5.1.4. Mixed Wastes
- 5.2. Market Analysis, Insights and Forecast - by Product
- 5.2.1. Manipulator Arms
- 5.2.2. Telescoping Masts
- 5.2.3. Cranes
- 5.2.4. Trusses
- 5.2.5. Size Reduction Systems
- 5.2.6. Other Products
- 5.3. Market Analysis, Insights and Forecast - by End-user Industry
- 5.3.1. Manufacturing
- 5.3.2. Chemical
- 5.3.3. Energy
- 5.3.4. Consumer Care
- 5.3.5. Government
- 5.3.6. Other End-user Industries
- 5.4. Market Analysis, Insights and Forecast - by Region
- 5.4.1. North America
- 5.4.2. South America
- 5.4.3. Europe
- 5.4.4. Middle East & Africa
- 5.4.5. Asia Pacific
- 5.1. Market Analysis, Insights and Forecast - by Type of Waste
- 6. North America NA Hazardous Waste Handling Automation Market Analysis, Insights and Forecast, 2019-2031
- 6.1. Market Analysis, Insights and Forecast - by Type of Waste
- 6.1.1. Listed Wastes
- 6.1.2. Characteristic Wastes
- 6.1.3. Universal Wastes
- 6.1.4. Mixed Wastes
- 6.2. Market Analysis, Insights and Forecast - by Product
- 6.2.1. Manipulator Arms
- 6.2.2. Telescoping Masts
- 6.2.3. Cranes
- 6.2.4. Trusses
- 6.2.5. Size Reduction Systems
- 6.2.6. Other Products
- 6.3. Market Analysis, Insights and Forecast - by End-user Industry
- 6.3.1. Manufacturing
- 6.3.2. Chemical
- 6.3.3. Energy
- 6.3.4. Consumer Care
- 6.3.5. Government
- 6.3.6. Other End-user Industries
- 6.1. Market Analysis, Insights and Forecast - by Type of Waste
- 7. South America NA Hazardous Waste Handling Automation Market Analysis, Insights and Forecast, 2019-2031
- 7.1. Market Analysis, Insights and Forecast - by Type of Waste
- 7.1.1. Listed Wastes
- 7.1.2. Characteristic Wastes
- 7.1.3. Universal Wastes
- 7.1.4. Mixed Wastes
- 7.2. Market Analysis, Insights and Forecast - by Product
- 7.2.1. Manipulator Arms
- 7.2.2. Telescoping Masts
- 7.2.3. Cranes
- 7.2.4. Trusses
- 7.2.5. Size Reduction Systems
- 7.2.6. Other Products
- 7.3. Market Analysis, Insights and Forecast - by End-user Industry
- 7.3.1. Manufacturing
- 7.3.2. Chemical
- 7.3.3. Energy
- 7.3.4. Consumer Care
- 7.3.5. Government
- 7.3.6. Other End-user Industries
- 7.1. Market Analysis, Insights and Forecast - by Type of Waste
- 8. Europe NA Hazardous Waste Handling Automation Market Analysis, Insights and Forecast, 2019-2031
- 8.1. Market Analysis, Insights and Forecast - by Type of Waste
- 8.1.1. Listed Wastes
- 8.1.2. Characteristic Wastes
- 8.1.3. Universal Wastes
- 8.1.4. Mixed Wastes
- 8.2. Market Analysis, Insights and Forecast - by Product
- 8.2.1. Manipulator Arms
- 8.2.2. Telescoping Masts
- 8.2.3. Cranes
- 8.2.4. Trusses
- 8.2.5. Size Reduction Systems
- 8.2.6. Other Products
- 8.3. Market Analysis, Insights and Forecast - by End-user Industry
- 8.3.1. Manufacturing
- 8.3.2. Chemical
- 8.3.3. Energy
- 8.3.4. Consumer Care
- 8.3.5. Government
- 8.3.6. Other End-user Industries
- 8.1. Market Analysis, Insights and Forecast - by Type of Waste
- 9. Middle East & Africa NA Hazardous Waste Handling Automation Market Analysis, Insights and Forecast, 2019-2031
- 9.1. Market Analysis, Insights and Forecast - by Type of Waste
- 9.1.1. Listed Wastes
- 9.1.2. Characteristic Wastes
- 9.1.3. Universal Wastes
- 9.1.4. Mixed Wastes
- 9.2. Market Analysis, Insights and Forecast - by Product
- 9.2.1. Manipulator Arms
- 9.2.2. Telescoping Masts
- 9.2.3. Cranes
- 9.2.4. Trusses
- 9.2.5. Size Reduction Systems
- 9.2.6. Other Products
- 9.3. Market Analysis, Insights and Forecast - by End-user Industry
- 9.3.1. Manufacturing
- 9.3.2. Chemical
- 9.3.3. Energy
- 9.3.4. Consumer Care
- 9.3.5. Government
- 9.3.6. Other End-user Industries
- 9.1. Market Analysis, Insights and Forecast - by Type of Waste
- 10. Asia Pacific NA Hazardous Waste Handling Automation Market Analysis, Insights and Forecast, 2019-2031
- 10.1. Market Analysis, Insights and Forecast - by Type of Waste
- 10.1.1. Listed Wastes
- 10.1.2. Characteristic Wastes
- 10.1.3. Universal Wastes
- 10.1.4. Mixed Wastes
- 10.2. Market Analysis, Insights and Forecast - by Product
- 10.2.1. Manipulator Arms
- 10.2.2. Telescoping Masts
- 10.2.3. Cranes
- 10.2.4. Trusses
- 10.2.5. Size Reduction Systems
- 10.2.6. Other Products
- 10.3. Market Analysis, Insights and Forecast - by End-user Industry
- 10.3.1. Manufacturing
- 10.3.2. Chemical
- 10.3.3. Energy
- 10.3.4. Consumer Care
- 10.3.5. Government
- 10.3.6. Other End-user Industries
- 10.1. Market Analysis, Insights and Forecast - by Type of Waste
- 11. North America NA Hazardous Waste Handling Automation Market Analysis, Insights and Forecast, 2019-2031
- 11.1. Market Analysis, Insights and Forecast - By Country/Sub-region
- 11.1.1.
- 12. Europe NA Hazardous Waste Handling Automation Market Analysis, Insights and Forecast, 2019-2031
- 12.1. Market Analysis, Insights and Forecast - By Country/Sub-region
- 12.1.1.
- 13. Asia Pacific NA Hazardous Waste Handling Automation Market Analysis, Insights and Forecast, 2019-2031
- 13.1. Market Analysis, Insights and Forecast - By Country/Sub-region
- 13.1.1.
- 14. Latin America NA Hazardous Waste Handling Automation Market Analysis, Insights and Forecast, 2019-2031
- 14.1. Market Analysis, Insights and Forecast - By Country/Sub-region
- 14.1.1.
- 15. Middle East NA Hazardous Waste Handling Automation Market Analysis, Insights and Forecast, 2019-2031
- 15.1. Market Analysis, Insights and Forecast - By Country/Sub-region
- 15.1.1.
- 16. Competitive Analysis
- 16.1. Global Market Share Analysis 2024
- 16.2. Company Profiles
- 16.2.1 Konecranes PLC
- 16.2.1.1. Overview
- 16.2.1.2. Products
- 16.2.1.3. SWOT Analysis
- 16.2.1.4. Recent Developments
- 16.2.1.5. Financials (Based on Availability)
- 16.2.2 PENZ Crane*List Not Exhaustive
- 16.2.2.1. Overview
- 16.2.2.2. Products
- 16.2.2.3. SWOT Analysis
- 16.2.2.4. Recent Developments
- 16.2.2.5. Financials (Based on Availability)
- 16.2.3 Pallmann
- 16.2.3.1. Overview
- 16.2.3.2. Products
- 16.2.3.3. SWOT Analysis
- 16.2.3.4. Recent Developments
- 16.2.3.5. Financials (Based on Availability)
- 16.2.4 Floatograph Technologies
- 16.2.4.1. Overview
- 16.2.4.2. Products
- 16.2.4.3. SWOT Analysis
- 16.2.4.4. Recent Developments
- 16.2.4.5. Financials (Based on Availability)
- 16.2.5 ACE Inc
- 16.2.5.1. Overview
- 16.2.5.2. Products
- 16.2.5.3. SWOT Analysis
- 16.2.5.4. Recent Developments
- 16.2.5.5. Financials (Based on Availability)
- 16.2.6 PaR Systems Inc
- 16.2.6.1. Overview
- 16.2.6.2. Products
- 16.2.6.3. SWOT Analysis
- 16.2.6.4. Recent Developments
- 16.2.6.5. Financials (Based on Availability)
- 16.2.7 Hiab
- 16.2.7.1. Overview
- 16.2.7.2. Products
- 16.2.7.3. SWOT Analysis
- 16.2.7.4. Recent Developments
- 16.2.7.5. Financials (Based on Availability)
- 16.2.8 Hosokawa Micron Powder Systems
- 16.2.8.1. Overview
- 16.2.8.2. Products
- 16.2.8.3. SWOT Analysis
- 16.2.8.4. Recent Developments
- 16.2.8.5. Financials (Based on Availability)
- 16.2.9 DX Engineering
- 16.2.9.1. Overview
- 16.2.9.2. Products
- 16.2.9.3. SWOT Analysis
- 16.2.9.4. Recent Developments
- 16.2.9.5. Financials (Based on Availability)
- 16.2.10 Terex MHPS GmbH
- 16.2.10.1. Overview
- 16.2.10.2. Products
- 16.2.10.3. SWOT Analysis
- 16.2.10.4. Recent Developments
- 16.2.10.5. Financials (Based on Availability)
- 16.2.1 Konecranes PLC
List of Figures
- Figure 1: Global NA Hazardous Waste Handling Automation Market Revenue Breakdown (Million, %) by Region 2024 & 2032
- Figure 2: North America NA Hazardous Waste Handling Automation Market Revenue (Million), by Country 2024 & 2032
- Figure 3: North America NA Hazardous Waste Handling Automation Market Revenue Share (%), by Country 2024 & 2032
- Figure 4: Europe NA Hazardous Waste Handling Automation Market Revenue (Million), by Country 2024 & 2032
- Figure 5: Europe NA Hazardous Waste Handling Automation Market Revenue Share (%), by Country 2024 & 2032
- Figure 6: Asia Pacific NA Hazardous Waste Handling Automation Market Revenue (Million), by Country 2024 & 2032
- Figure 7: Asia Pacific NA Hazardous Waste Handling Automation Market Revenue Share (%), by Country 2024 & 2032
- Figure 8: Latin America NA Hazardous Waste Handling Automation Market Revenue (Million), by Country 2024 & 2032
- Figure 9: Latin America NA Hazardous Waste Handling Automation Market Revenue Share (%), by Country 2024 & 2032
- Figure 10: Middle East NA Hazardous Waste Handling Automation Market Revenue (Million), by Country 2024 & 2032
- Figure 11: Middle East NA Hazardous Waste Handling Automation Market Revenue Share (%), by Country 2024 & 2032
- Figure 12: North America NA Hazardous Waste Handling Automation Market Revenue (Million), by Type of Waste 2024 & 2032
- Figure 13: North America NA Hazardous Waste Handling Automation Market Revenue Share (%), by Type of Waste 2024 & 2032
- Figure 14: North America NA Hazardous Waste Handling Automation Market Revenue (Million), by Product 2024 & 2032
- Figure 15: North America NA Hazardous Waste Handling Automation Market Revenue Share (%), by Product 2024 & 2032
- Figure 16: North America NA Hazardous Waste Handling Automation Market Revenue (Million), by End-user Industry 2024 & 2032
- Figure 17: North America NA Hazardous Waste Handling Automation Market Revenue Share (%), by End-user Industry 2024 & 2032
- Figure 18: North America NA Hazardous Waste Handling Automation Market Revenue (Million), by Country 2024 & 2032
- Figure 19: North America NA Hazardous Waste Handling Automation Market Revenue Share (%), by Country 2024 & 2032
- Figure 20: South America NA Hazardous Waste Handling Automation Market Revenue (Million), by Type of Waste 2024 & 2032
- Figure 21: South America NA Hazardous Waste Handling Automation Market Revenue Share (%), by Type of Waste 2024 & 2032
- Figure 22: South America NA Hazardous Waste Handling Automation Market Revenue (Million), by Product 2024 & 2032
- Figure 23: South America NA Hazardous Waste Handling Automation Market Revenue Share (%), by Product 2024 & 2032
- Figure 24: South America NA Hazardous Waste Handling Automation Market Revenue (Million), by End-user Industry 2024 & 2032
- Figure 25: South America NA Hazardous Waste Handling Automation Market Revenue Share (%), by End-user Industry 2024 & 2032
- Figure 26: South America NA Hazardous Waste Handling Automation Market Revenue (Million), by Country 2024 & 2032
- Figure 27: South America NA Hazardous Waste Handling Automation Market Revenue Share (%), by Country 2024 & 2032
- Figure 28: Europe NA Hazardous Waste Handling Automation Market Revenue (Million), by Type of Waste 2024 & 2032
- Figure 29: Europe NA Hazardous Waste Handling Automation Market Revenue Share (%), by Type of Waste 2024 & 2032
- Figure 30: Europe NA Hazardous Waste Handling Automation Market Revenue (Million), by Product 2024 & 2032
- Figure 31: Europe NA Hazardous Waste Handling Automation Market Revenue Share (%), by Product 2024 & 2032
- Figure 32: Europe NA Hazardous Waste Handling Automation Market Revenue (Million), by End-user Industry 2024 & 2032
- Figure 33: Europe NA Hazardous Waste Handling Automation Market Revenue Share (%), by End-user Industry 2024 & 2032
- Figure 34: Europe NA Hazardous Waste Handling Automation Market Revenue (Million), by Country 2024 & 2032
- Figure 35: Europe NA Hazardous Waste Handling Automation Market Revenue Share (%), by Country 2024 & 2032
- Figure 36: Middle East & Africa NA Hazardous Waste Handling Automation Market Revenue (Million), by Type of Waste 2024 & 2032
- Figure 37: Middle East & Africa NA Hazardous Waste Handling Automation Market Revenue Share (%), by Type of Waste 2024 & 2032
- Figure 38: Middle East & Africa NA Hazardous Waste Handling Automation Market Revenue (Million), by Product 2024 & 2032
- Figure 39: Middle East & Africa NA Hazardous Waste Handling Automation Market Revenue Share (%), by Product 2024 & 2032
- Figure 40: Middle East & Africa NA Hazardous Waste Handling Automation Market Revenue (Million), by End-user Industry 2024 & 2032
- Figure 41: Middle East & Africa NA Hazardous Waste Handling Automation Market Revenue Share (%), by End-user Industry 2024 & 2032
- Figure 42: Middle East & Africa NA Hazardous Waste Handling Automation Market Revenue (Million), by Country 2024 & 2032
- Figure 43: Middle East & Africa NA Hazardous Waste Handling Automation Market Revenue Share (%), by Country 2024 & 2032
- Figure 44: Asia Pacific NA Hazardous Waste Handling Automation Market Revenue (Million), by Type of Waste 2024 & 2032
- Figure 45: Asia Pacific NA Hazardous Waste Handling Automation Market Revenue Share (%), by Type of Waste 2024 & 2032
- Figure 46: Asia Pacific NA Hazardous Waste Handling Automation Market Revenue (Million), by Product 2024 & 2032
- Figure 47: Asia Pacific NA Hazardous Waste Handling Automation Market Revenue Share (%), by Product 2024 & 2032
- Figure 48: Asia Pacific NA Hazardous Waste Handling Automation Market Revenue (Million), by End-user Industry 2024 & 2032
- Figure 49: Asia Pacific NA Hazardous Waste Handling Automation Market Revenue Share (%), by End-user Industry 2024 & 2032
- Figure 50: Asia Pacific NA Hazardous Waste Handling Automation Market Revenue (Million), by Country 2024 & 2032
- Figure 51: Asia Pacific NA Hazardous Waste Handling Automation Market Revenue Share (%), by Country 2024 & 2032
List of Tables
- Table 1: Global NA Hazardous Waste Handling Automation Market Revenue Million Forecast, by Region 2019 & 2032
- Table 2: Global NA Hazardous Waste Handling Automation Market Revenue Million Forecast, by Type of Waste 2019 & 2032
- Table 3: Global NA Hazardous Waste Handling Automation Market Revenue Million Forecast, by Product 2019 & 2032
- Table 4: Global NA Hazardous Waste Handling Automation Market Revenue Million Forecast, by End-user Industry 2019 & 2032
- Table 5: Global NA Hazardous Waste Handling Automation Market Revenue Million Forecast, by Region 2019 & 2032
- Table 6: Global NA Hazardous Waste Handling Automation Market Revenue Million Forecast, by Country 2019 & 2032
- Table 7: NA Hazardous Waste Handling Automation Market Revenue (Million) Forecast, by Application 2019 & 2032
- Table 8: Global NA Hazardous Waste Handling Automation Market Revenue Million Forecast, by Country 2019 & 2032
- Table 9: NA Hazardous Waste Handling Automation Market Revenue (Million) Forecast, by Application 2019 & 2032
- Table 10: Global NA Hazardous Waste Handling Automation Market Revenue Million Forecast, by Country 2019 & 2032
- Table 11: NA Hazardous Waste Handling Automation Market Revenue (Million) Forecast, by Application 2019 & 2032
- Table 12: Global NA Hazardous Waste Handling Automation Market Revenue Million Forecast, by Country 2019 & 2032
- Table 13: NA Hazardous Waste Handling Automation Market Revenue (Million) Forecast, by Application 2019 & 2032
- Table 14: Global NA Hazardous Waste Handling Automation Market Revenue Million Forecast, by Country 2019 & 2032
- Table 15: NA Hazardous Waste Handling Automation Market Revenue (Million) Forecast, by Application 2019 & 2032
- Table 16: Global NA Hazardous Waste Handling Automation Market Revenue Million Forecast, by Type of Waste 2019 & 2032
- Table 17: Global NA Hazardous Waste Handling Automation Market Revenue Million Forecast, by Product 2019 & 2032
- Table 18: Global NA Hazardous Waste Handling Automation Market Revenue Million Forecast, by End-user Industry 2019 & 2032
- Table 19: Global NA Hazardous Waste Handling Automation Market Revenue Million Forecast, by Country 2019 & 2032
- Table 20: United States NA Hazardous Waste Handling Automation Market Revenue (Million) Forecast, by Application 2019 & 2032
- Table 21: Canada NA Hazardous Waste Handling Automation Market Revenue (Million) Forecast, by Application 2019 & 2032
- Table 22: Mexico NA Hazardous Waste Handling Automation Market Revenue (Million) Forecast, by Application 2019 & 2032
- Table 23: Global NA Hazardous Waste Handling Automation Market Revenue Million Forecast, by Type of Waste 2019 & 2032
- Table 24: Global NA Hazardous Waste Handling Automation Market Revenue Million Forecast, by Product 2019 & 2032
- Table 25: Global NA Hazardous Waste Handling Automation Market Revenue Million Forecast, by End-user Industry 2019 & 2032
- Table 26: Global NA Hazardous Waste Handling Automation Market Revenue Million Forecast, by Country 2019 & 2032
- Table 27: Brazil NA Hazardous Waste Handling Automation Market Revenue (Million) Forecast, by Application 2019 & 2032
- Table 28: Argentina NA Hazardous Waste Handling Automation Market Revenue (Million) Forecast, by Application 2019 & 2032
- Table 29: Rest of South America NA Hazardous Waste Handling Automation Market Revenue (Million) Forecast, by Application 2019 & 2032
- Table 30: Global NA Hazardous Waste Handling Automation Market Revenue Million Forecast, by Type of Waste 2019 & 2032
- Table 31: Global NA Hazardous Waste Handling Automation Market Revenue Million Forecast, by Product 2019 & 2032
- Table 32: Global NA Hazardous Waste Handling Automation Market Revenue Million Forecast, by End-user Industry 2019 & 2032
- Table 33: Global NA Hazardous Waste Handling Automation Market Revenue Million Forecast, by Country 2019 & 2032
- Table 34: United Kingdom NA Hazardous Waste Handling Automation Market Revenue (Million) Forecast, by Application 2019 & 2032
- Table 35: Germany NA Hazardous Waste Handling Automation Market Revenue (Million) Forecast, by Application 2019 & 2032
- Table 36: France NA Hazardous Waste Handling Automation Market Revenue (Million) Forecast, by Application 2019 & 2032
- Table 37: Italy NA Hazardous Waste Handling Automation Market Revenue (Million) Forecast, by Application 2019 & 2032
- Table 38: Spain NA Hazardous Waste Handling Automation Market Revenue (Million) Forecast, by Application 2019 & 2032
- Table 39: Russia NA Hazardous Waste Handling Automation Market Revenue (Million) Forecast, by Application 2019 & 2032
- Table 40: Benelux NA Hazardous Waste Handling Automation Market Revenue (Million) Forecast, by Application 2019 & 2032
- Table 41: Nordics NA Hazardous Waste Handling Automation Market Revenue (Million) Forecast, by Application 2019 & 2032
- Table 42: Rest of Europe NA Hazardous Waste Handling Automation Market Revenue (Million) Forecast, by Application 2019 & 2032
- Table 43: Global NA Hazardous Waste Handling Automation Market Revenue Million Forecast, by Type of Waste 2019 & 2032
- Table 44: Global NA Hazardous Waste Handling Automation Market Revenue Million Forecast, by Product 2019 & 2032
- Table 45: Global NA Hazardous Waste Handling Automation Market Revenue Million Forecast, by End-user Industry 2019 & 2032
- Table 46: Global NA Hazardous Waste Handling Automation Market Revenue Million Forecast, by Country 2019 & 2032
- Table 47: Turkey NA Hazardous Waste Handling Automation Market Revenue (Million) Forecast, by Application 2019 & 2032
- Table 48: Israel NA Hazardous Waste Handling Automation Market Revenue (Million) Forecast, by Application 2019 & 2032
- Table 49: GCC NA Hazardous Waste Handling Automation Market Revenue (Million) Forecast, by Application 2019 & 2032
- Table 50: North Africa NA Hazardous Waste Handling Automation Market Revenue (Million) Forecast, by Application 2019 & 2032
- Table 51: South Africa NA Hazardous Waste Handling Automation Market Revenue (Million) Forecast, by Application 2019 & 2032
- Table 52: Rest of Middle East & Africa NA Hazardous Waste Handling Automation Market Revenue (Million) Forecast, by Application 2019 & 2032
- Table 53: Global NA Hazardous Waste Handling Automation Market Revenue Million Forecast, by Type of Waste 2019 & 2032
- Table 54: Global NA Hazardous Waste Handling Automation Market Revenue Million Forecast, by Product 2019 & 2032
- Table 55: Global NA Hazardous Waste Handling Automation Market Revenue Million Forecast, by End-user Industry 2019 & 2032
- Table 56: Global NA Hazardous Waste Handling Automation Market Revenue Million Forecast, by Country 2019 & 2032
- Table 57: China NA Hazardous Waste Handling Automation Market Revenue (Million) Forecast, by Application 2019 & 2032
- Table 58: India NA Hazardous Waste Handling Automation Market Revenue (Million) Forecast, by Application 2019 & 2032
- Table 59: Japan NA Hazardous Waste Handling Automation Market Revenue (Million) Forecast, by Application 2019 & 2032
- Table 60: South Korea NA Hazardous Waste Handling Automation Market Revenue (Million) Forecast, by Application 2019 & 2032
- Table 61: ASEAN NA Hazardous Waste Handling Automation Market Revenue (Million) Forecast, by Application 2019 & 2032
- Table 62: Oceania NA Hazardous Waste Handling Automation Market Revenue (Million) Forecast, by Application 2019 & 2032
- Table 63: Rest of Asia Pacific NA Hazardous Waste Handling Automation Market Revenue (Million) Forecast, by Application 2019 & 2032
Frequently Asked Questions
1. What is the projected Compound Annual Growth Rate (CAGR) of the NA Hazardous Waste Handling Automation Market?
The projected CAGR is approximately 7.20%.
2. Which companies are prominent players in the NA Hazardous Waste Handling Automation Market?
Key companies in the market include Konecranes PLC, PENZ Crane*List Not Exhaustive, Pallmann, Floatograph Technologies, ACE Inc, PaR Systems Inc, Hiab, Hosokawa Micron Powder Systems, DX Engineering, Terex MHPS GmbH.
3. What are the main segments of the NA Hazardous Waste Handling Automation Market?
The market segments include Type of Waste, Product, End-user Industry.
4. Can you provide details about the market size?
The market size is estimated to be USD XX Million as of 2022.
5. What are some drivers contributing to market growth?
Government and Industry Regulations; Growing Concerns overWaste Management.
6. What are the notable trends driving market growth?
Growing Concerns Over Listed Waste Management Expected to Drive Market Demand.
7. Are there any restraints impacting market growth?
Fluctuations in Raw Material Prices.
8. Can you provide examples of recent developments in the market?
Aug 2022: Hi-Z Antennas' whole range of HF directive receiving array products for ham radio operators was bought by DX Engineering, assuring that hams worldwide will still be able to use the company's equipment. The design/manufacturing team at DX Engineering will now create Hi-Z devices.
9. What pricing options are available for accessing the report?
Pricing options include single-user, multi-user, and enterprise licenses priced at USD 4750, USD 4950, and USD 6800 respectively.
10. Is the market size provided in terms of value or volume?
The market size is provided in terms of value, measured in Million.
11. Are there any specific market keywords associated with the report?
Yes, the market keyword associated with the report is "NA Hazardous Waste Handling Automation Market," which aids in identifying and referencing the specific market segment covered.
12. How do I determine which pricing option suits my needs best?
The pricing options vary based on user requirements and access needs. Individual users may opt for single-user licenses, while businesses requiring broader access may choose multi-user or enterprise licenses for cost-effective access to the report.
13. Are there any additional resources or data provided in the NA Hazardous Waste Handling Automation Market report?
While the report offers comprehensive insights, it's advisable to review the specific contents or supplementary materials provided to ascertain if additional resources or data are available.
14. How can I stay updated on further developments or reports in the NA Hazardous Waste Handling Automation Market?
To stay informed about further developments, trends, and reports in the NA Hazardous Waste Handling Automation Market, consider subscribing to industry newsletters, following relevant companies and organizations, or regularly checking reputable industry news sources and publications.
Methodology
Step 1 - Identification of Relevant Samples Size from Population Database


Step 2 - Approaches for Defining Global Market Size (Value, Volume* & Price*)

Note*: In applicable scenarios
Step 3 - Data Sources
Primary Research
- Web Analytics
- Survey Reports
- Research Institute
- Latest Research Reports
- Opinion Leaders
Secondary Research
- Annual Reports
- White Paper
- Latest Press Release
- Industry Association
- Paid Database
- Investor Presentations

Step 4 - Data Triangulation
Involves using different sources of information in order to increase the validity of a study
These sources are likely to be stakeholders in a program - participants, other researchers, program staff, other community members, and so on.
Then we put all data in single framework & apply various statistical tools to find out the dynamic on the market.
During the analysis stage, feedback from the stakeholder groups would be compared to determine areas of agreement as well as areas of divergence


