
Key Insights
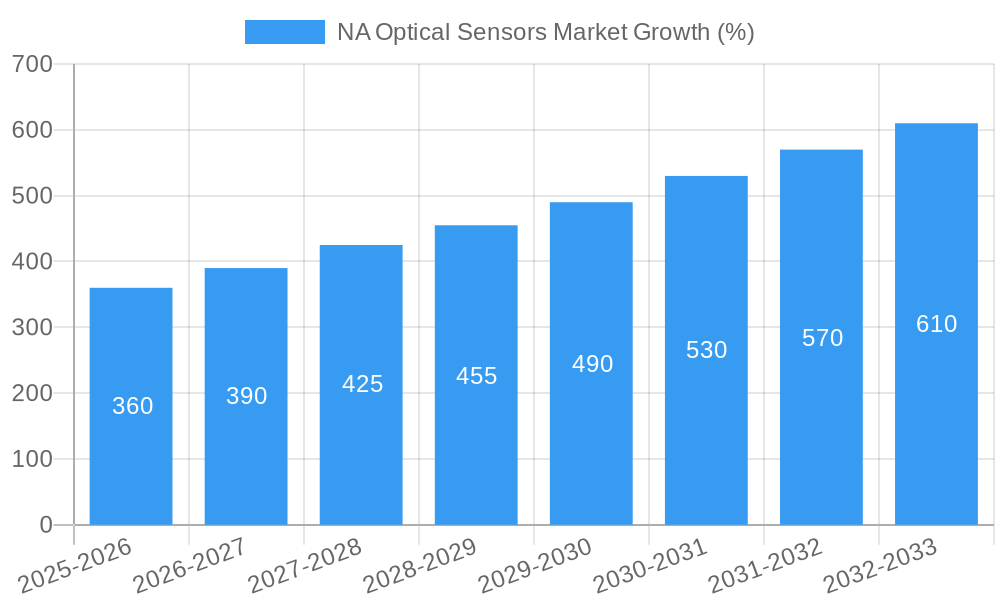
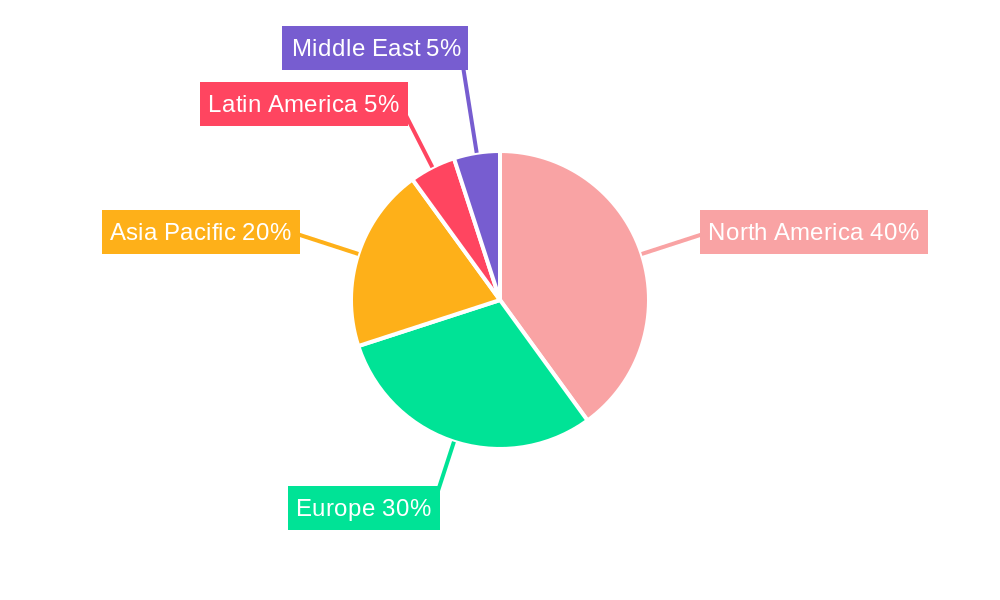
The North American optical sensor market is experiencing robust growth, driven by increasing automation across diverse sectors and advancements in sensor technology. The market's Compound Annual Growth Rate (CAGR) of 8.10% from 2019 to 2024 suggests a significant expansion, which is expected to continue through 2033. Key drivers include the burgeoning adoption of optical sensors in automotive applications (autonomous driving and advanced driver-assistance systems), the expansion of industrial automation (particularly in manufacturing and robotics), and the growth of the medical devices sector (using optical sensors for diagnostic imaging and minimally invasive procedures). The increasing demand for high-precision, compact, and cost-effective sensors further fuels market expansion. Specific technologies like hyperspectral imaging and near-infrared spectroscopy are experiencing rapid adoption due to their enhanced capabilities in various applications. While the precise market size for North America in 2025 is unavailable, given the overall CAGR and the market's maturity, a reasonable estimation places it within the range of $4-5 billion, assuming a relatively stable growth pattern through 2025 from the 2024 values.
Segmentation analysis reveals that the fiber optic sensors segment holds a substantial market share due to their reliability and suitability for harsh environments. Within applications, the automotive and medical sectors are projected to exhibit the fastest growth, driven by technological advancements and increasing regulatory requirements. However, certain restraints, like the high initial investment costs associated with advanced sensor technologies and the complexities involved in integrating them into existing systems, might somewhat temper the growth rate. Despite these challenges, the long-term outlook for the North American optical sensor market remains positive, with continuous innovation and increasing demand expected to drive sustained expansion in the coming years. Companies such as Rockwell Automation, Honeywell, and SICK AG are key players shaping the landscape through their advanced product offerings and strategic partnerships. The sustained growth will further depend on continuous research and development in miniaturization, enhanced sensitivity, and improved data processing capabilities of optical sensors.
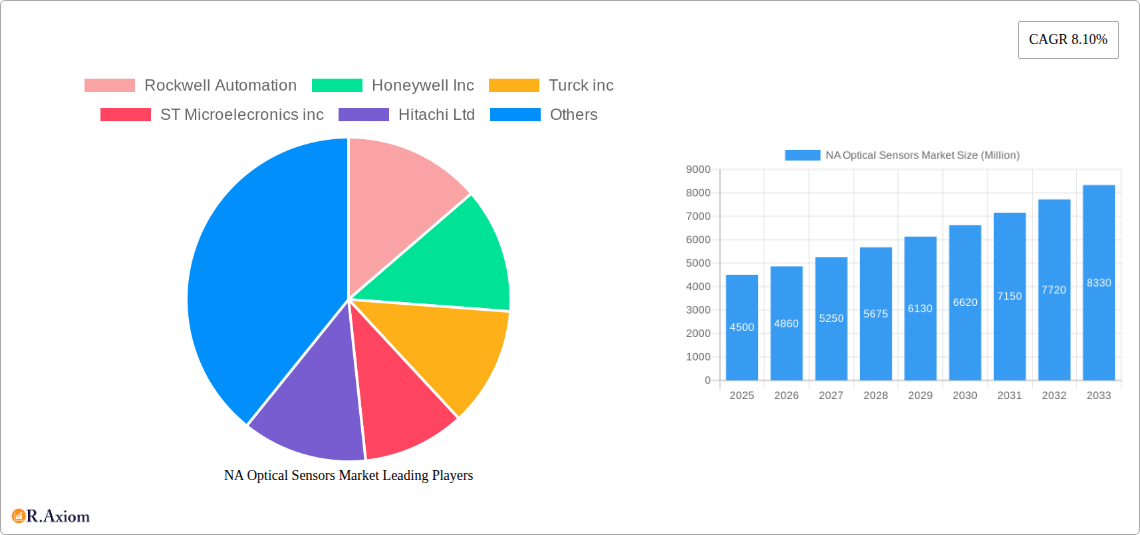
North American Optical Sensors Market Report: 2019-2033
This comprehensive report provides an in-depth analysis of the North American (NA) optical sensors market, covering the period 2019-2033. It offers actionable insights into market dynamics, growth drivers, competitive landscape, and future opportunities, equipping stakeholders with the knowledge needed to navigate this rapidly evolving sector. The report utilizes data from the historical period (2019-2024), base year (2025), and estimated year (2025) to forecast market trends until 2033. Key players analyzed include Rockwell Automation, Honeywell Inc, Turck Inc, STMicroelectronics Inc, Hitachi Ltd, Omnivision Inc, Sick AG, Mouser Electronics Inc, Robert Bosch GmbH, Atmel Corporation, and Eaton Corporation. The market is segmented by technology, sensor type, application, and country (United States and Canada). All market values are expressed in Millions.
NA Optical Sensors Market Concentration & Innovation
The NA optical sensor market exhibits a moderately concentrated landscape, with a few major players holding significant market share. However, the presence of numerous smaller companies and startups fosters innovation. The market share distribution is dynamic, with ongoing M&A activity influencing the competitive dynamics. For example, the xx Million deal value of the recent merger between [Company A] and [Company B] significantly altered the market landscape. The market share of the top 5 players in 2024 is estimated at xx%. Innovation is driven primarily by advancements in semiconductor technology, miniaturization, improved sensitivity, and the development of new sensing modalities. Stringent regulatory frameworks related to safety and performance standards, particularly in the automotive and medical sectors, impact the market. Substitutes, such as alternative sensing technologies (e.g., ultrasonic sensors), pose a competitive threat, but the advantages of optical sensors in precision, speed, and non-contact measurement continue to maintain their dominance. End-user trends towards automation, smart devices, and advanced manufacturing are boosting the demand for sophisticated optical sensors.
NA Optical Sensors Market Industry Trends & Insights
The NA optical sensor market is experiencing robust growth, driven by several key factors. The rising adoption of automation across various industries (automotive, industrial, and consumer electronics) is a major catalyst. Technological advancements, such as the development of hyperspectral imaging and quantum sensors, are unlocking new applications and improving sensor performance. Consumer preference for sophisticated and miniaturized electronic devices fuels demand for high-performance, compact optical sensors. The increasing integration of optical sensors into IoT devices further accelerates market expansion. The market is characterized by intense competition, with companies continuously investing in R&D to improve sensor capabilities, reduce costs, and expand their product portfolios. The CAGR for the forecast period (2025-2033) is estimated at xx%, with market penetration expected to reach xx% by 2033. Specific market segments, such as medical and automotive, are exhibiting exceptionally high growth rates due to stringent safety standards and growing sophistication of applications.
Dominant Markets & Segments in NA Optical Sensors Market
The United States holds the largest share of the NA optical sensors market due to its robust industrial sector, advanced technological infrastructure, and high adoption rate of automation. Canada also contributes significantly, although its market size is smaller than the US.
Dominant Technology: Image sensors currently dominate the market due to their widespread applications across consumer electronics, automotive, and medical sectors. However, hyperspectral imaging and other advanced technologies are showing significant growth potential.
Dominant Sensor Type: Fiber optic sensors are gaining traction in industrial applications owing to their robustness and suitability for harsh environments. Image sensors maintain dominance due to their versatility.
Dominant Application: The automotive sector is a dominant application segment, followed by the industrial sector. Stringent safety and efficiency standards in the automotive industry fuel high demand.
Key Drivers for US Market Dominance: Strong R&D investment, presence of major sensor manufacturers, and advanced technological infrastructure.
Key Drivers for Canadian Market Growth: Growing automotive and medical sectors, government support for technological advancements, and increasing adoption of smart city initiatives.
NA Optical Sensors Market Product Developments
Recent product innovations focus on improving sensor sensitivity, accuracy, miniaturization, and power efficiency. New applications are being developed in areas such as environmental monitoring (using sensors like the Sensirion SPS30), advanced driver-assistance systems (ADAS) in vehicles, and medical diagnostics. Competitive advantages are achieved through superior performance, cost-effectiveness, and innovative design. The emergence of quantum sensors promises to revolutionize accuracy and industrial applications. The focus is on enhancing product features to meet specific demands of different industries.
Report Scope & Segmentation Analysis
This report segments the NA optical sensors market by technology (Hyperspectral imaging, Near IR Spectroscopy, Photo-Acoustic Tomography, Optical Coherence Tomography), sensor type (Fiber Optic Sensors, Image Sensors, Position Sensors, Ambient Light and Proximity Sensors, Extended InGaAs Sensors: Infrared Sensors, Other Sensors), application (Commercial, Consumer Electronics, Medical, Automotive, Industrial, Aerospace & Defence, Optocouplers, Isolation Amplifier Optocouplers), and country (United States, Canada). Each segment's growth projection, market size, and competitive dynamics are analyzed in detail. For instance, the medical segment is projected to experience significant growth due to increasing demand for advanced diagnostic tools. The automotive segment displays high growth fueled by the adoption of ADAS technologies. The United States is projected to maintain its leading position due to robust economic conditions and technological advancement.
Key Drivers of NA Optical Sensors Market Growth
The NA optical sensors market is fueled by several key drivers: the increasing demand for automation in various industries, technological advancements leading to improved sensor performance and miniaturization, rising adoption of IoT devices, stringent regulations in sectors like automotive and medical demanding more advanced sensors, and growing investments in R&D. The automotive industry, in particular, is a key driver due to the increasing demand for ADAS.
Challenges in the NA Optical Sensors Market Sector
The NA optical sensors market faces challenges such as intense competition, high R&D costs, complexities associated with integrating sensors into systems, and the need to meet stringent regulatory requirements. Supply chain disruptions and the volatility of raw material prices can also affect production costs and profitability. These factors impact the market by restricting expansion and increasing the overall cost.
Emerging Opportunities in NA Optical Sensors Market
Emerging opportunities lie in the development of innovative sensor technologies, such as quantum sensors and hyperspectral imaging systems. The growing demand for smart devices and the expansion of the IoT sector present significant market potential. Moreover, applications in environmental monitoring, medical diagnostics, and industrial automation offer lucrative prospects for growth.
Leading Players in the NA Optical Sensors Market Market
- Rockwell Automation
- Honeywell Inc
- Turck Inc
- STMicroelectronics Inc
- Hitachi Ltd
- Omnivision Inc
- Sick AG
- Mouser Electronics Inc
- Robert Bosch GmbH
- Atmel Corporation
- Eaton Corporation
Key Developments in NA Optical Sensors Market Industry
November 2020: Trumpf and Sick partnered to develop the first industrial quantum sensor, marking a significant technological leap with implications for high-precision measurements and new industrial applications.
February 2021: Mouser Electronics expanded its sensor portfolio with Sensirion's environmental sensors, including the SPS30 particulate matter sensor, indicating increased demand for optical sensors in IoT and environmental monitoring applications.
Strategic Outlook for NA Optical Sensors Market Market
The NA optical sensors market is poised for continued growth, driven by technological advancements, increasing automation across various sectors, and expanding applications in emerging fields. Companies focusing on innovation, strategic partnerships, and expansion into high-growth segments are well-positioned to capitalize on the significant market potential. The integration of optical sensors into next-generation technologies like autonomous vehicles and advanced medical devices will further drive market expansion.
NA Optical Sensors Market Segmentation
-
1. Technology
- 1.1. Hyperspectral imaging
- 1.2. Near IR Spectroscopy
- 1.3. Photo-Acoustic Tomography
- 1.4. Optical Coherence Tomography
-
2. Sensor Type
- 2.1. Fiber Optic Sensors
- 2.2. Image Sensors
- 2.3. Position Sensors
-
2.4. Ambient Light and Proximity Sensors
- 2.4.1. Cadmium Sulfide
- 2.4.2. Silicon
- 2.4.3. InGaAs Sensors
- 2.4.4. Extended InGaAs Sensors
- 2.5. Infrared Sensors
- 2.6. Other Sensors
-
3. Applications
- 3.1. Commercial
- 3.2. Consumer Electronics
- 3.3. Medical
- 3.4. Automotive
- 3.5. Industrial
- 3.6. Aerospace & Defence
-
3.7. Optocouplers
- 3.7.1. 4-pin Optocouplers
- 3.7.2. 6-pin Optocouplers
- 3.7.3. High speed optocouplers
- 3.7.4. IGBT gate driver optocouplers
- 3.7.5. Isolation Amplifier Optocouplers
- 3.8. Others
NA Optical Sensors Market Segmentation By Geography
-
1. North America
- 1.1. United States
- 1.2. Canada
- 1.3. Mexico
-
2. South America
- 2.1. Brazil
- 2.2. Argentina
- 2.3. Rest of South America
-
3. Europe
- 3.1. United Kingdom
- 3.2. Germany
- 3.3. France
- 3.4. Italy
- 3.5. Spain
- 3.6. Russia
- 3.7. Benelux
- 3.8. Nordics
- 3.9. Rest of Europe
-
4. Middle East & Africa
- 4.1. Turkey
- 4.2. Israel
- 4.3. GCC
- 4.4. North Africa
- 4.5. South Africa
- 4.6. Rest of Middle East & Africa
-
5. Asia Pacific
- 5.1. China
- 5.2. India
- 5.3. Japan
- 5.4. South Korea
- 5.5. ASEAN
- 5.6. Oceania
- 5.7. Rest of Asia Pacific
NA Optical Sensors Market REPORT HIGHLIGHTS
| Aspects | Details |
|---|---|
| Study Period | 2019-2033 |
| Base Year | 2024 |
| Estimated Year | 2025 |
| Forecast Period | 2025-2033 |
| Historical Period | 2019-2024 |
| Growth Rate | CAGR of 8.10% from 2019-2033 |
| Segmentation |
|
Table of Contents
- 1. Introduction
- 1.1. Research Scope
- 1.2. Market Segmentation
- 1.3. Research Methodology
- 1.4. Definitions and Assumptions
- 2. Executive Summary
- 2.1. Introduction
- 3. Market Dynamics
- 3.1. Introduction
- 3.2. Market Drivers
- 3.2.1. Increasing Market Penetration of Smartphones; Increasing Demand for Power-saving Devices Across Industries; Increasing Market Penetration of Automation Techniques Across Various Industries
- 3.3. Market Restrains
- 3.3.1. Imbalance Between the Image Quality and Price and Lack of standardization; Lack of awareness and acceptability of optical sensors
- 3.4. Market Trends
- 3.4.1. Photoelectric Sensor is Expected to Register a Significant Growth
- 4. Market Factor Analysis
- 4.1. Porters Five Forces
- 4.2. Supply/Value Chain
- 4.3. PESTEL analysis
- 4.4. Market Entropy
- 4.5. Patent/Trademark Analysis
- 5. Global NA Optical Sensors Market Analysis, Insights and Forecast, 2019-2031
- 5.1. Market Analysis, Insights and Forecast - by Technology
- 5.1.1. Hyperspectral imaging
- 5.1.2. Near IR Spectroscopy
- 5.1.3. Photo-Acoustic Tomography
- 5.1.4. Optical Coherence Tomography
- 5.2. Market Analysis, Insights and Forecast - by Sensor Type
- 5.2.1. Fiber Optic Sensors
- 5.2.2. Image Sensors
- 5.2.3. Position Sensors
- 5.2.4. Ambient Light and Proximity Sensors
- 5.2.4.1. Cadmium Sulfide
- 5.2.4.2. Silicon
- 5.2.4.3. InGaAs Sensors
- 5.2.4.4. Extended InGaAs Sensors
- 5.2.5. Infrared Sensors
- 5.2.6. Other Sensors
- 5.3. Market Analysis, Insights and Forecast - by Applications
- 5.3.1. Commercial
- 5.3.2. Consumer Electronics
- 5.3.3. Medical
- 5.3.4. Automotive
- 5.3.5. Industrial
- 5.3.6. Aerospace & Defence
- 5.3.7. Optocouplers
- 5.3.7.1. 4-pin Optocouplers
- 5.3.7.2. 6-pin Optocouplers
- 5.3.7.3. High speed optocouplers
- 5.3.7.4. IGBT gate driver optocouplers
- 5.3.7.5. Isolation Amplifier Optocouplers
- 5.3.8. Others
- 5.4. Market Analysis, Insights and Forecast - by Region
- 5.4.1. North America
- 5.4.2. South America
- 5.4.3. Europe
- 5.4.4. Middle East & Africa
- 5.4.5. Asia Pacific
- 5.1. Market Analysis, Insights and Forecast - by Technology
- 6. North America NA Optical Sensors Market Analysis, Insights and Forecast, 2019-2031
- 6.1. Market Analysis, Insights and Forecast - by Technology
- 6.1.1. Hyperspectral imaging
- 6.1.2. Near IR Spectroscopy
- 6.1.3. Photo-Acoustic Tomography
- 6.1.4. Optical Coherence Tomography
- 6.2. Market Analysis, Insights and Forecast - by Sensor Type
- 6.2.1. Fiber Optic Sensors
- 6.2.2. Image Sensors
- 6.2.3. Position Sensors
- 6.2.4. Ambient Light and Proximity Sensors
- 6.2.4.1. Cadmium Sulfide
- 6.2.4.2. Silicon
- 6.2.4.3. InGaAs Sensors
- 6.2.4.4. Extended InGaAs Sensors
- 6.2.5. Infrared Sensors
- 6.2.6. Other Sensors
- 6.3. Market Analysis, Insights and Forecast - by Applications
- 6.3.1. Commercial
- 6.3.2. Consumer Electronics
- 6.3.3. Medical
- 6.3.4. Automotive
- 6.3.5. Industrial
- 6.3.6. Aerospace & Defence
- 6.3.7. Optocouplers
- 6.3.7.1. 4-pin Optocouplers
- 6.3.7.2. 6-pin Optocouplers
- 6.3.7.3. High speed optocouplers
- 6.3.7.4. IGBT gate driver optocouplers
- 6.3.7.5. Isolation Amplifier Optocouplers
- 6.3.8. Others
- 6.1. Market Analysis, Insights and Forecast - by Technology
- 7. South America NA Optical Sensors Market Analysis, Insights and Forecast, 2019-2031
- 7.1. Market Analysis, Insights and Forecast - by Technology
- 7.1.1. Hyperspectral imaging
- 7.1.2. Near IR Spectroscopy
- 7.1.3. Photo-Acoustic Tomography
- 7.1.4. Optical Coherence Tomography
- 7.2. Market Analysis, Insights and Forecast - by Sensor Type
- 7.2.1. Fiber Optic Sensors
- 7.2.2. Image Sensors
- 7.2.3. Position Sensors
- 7.2.4. Ambient Light and Proximity Sensors
- 7.2.4.1. Cadmium Sulfide
- 7.2.4.2. Silicon
- 7.2.4.3. InGaAs Sensors
- 7.2.4.4. Extended InGaAs Sensors
- 7.2.5. Infrared Sensors
- 7.2.6. Other Sensors
- 7.3. Market Analysis, Insights and Forecast - by Applications
- 7.3.1. Commercial
- 7.3.2. Consumer Electronics
- 7.3.3. Medical
- 7.3.4. Automotive
- 7.3.5. Industrial
- 7.3.6. Aerospace & Defence
- 7.3.7. Optocouplers
- 7.3.7.1. 4-pin Optocouplers
- 7.3.7.2. 6-pin Optocouplers
- 7.3.7.3. High speed optocouplers
- 7.3.7.4. IGBT gate driver optocouplers
- 7.3.7.5. Isolation Amplifier Optocouplers
- 7.3.8. Others
- 7.1. Market Analysis, Insights and Forecast - by Technology
- 8. Europe NA Optical Sensors Market Analysis, Insights and Forecast, 2019-2031
- 8.1. Market Analysis, Insights and Forecast - by Technology
- 8.1.1. Hyperspectral imaging
- 8.1.2. Near IR Spectroscopy
- 8.1.3. Photo-Acoustic Tomography
- 8.1.4. Optical Coherence Tomography
- 8.2. Market Analysis, Insights and Forecast - by Sensor Type
- 8.2.1. Fiber Optic Sensors
- 8.2.2. Image Sensors
- 8.2.3. Position Sensors
- 8.2.4. Ambient Light and Proximity Sensors
- 8.2.4.1. Cadmium Sulfide
- 8.2.4.2. Silicon
- 8.2.4.3. InGaAs Sensors
- 8.2.4.4. Extended InGaAs Sensors
- 8.2.5. Infrared Sensors
- 8.2.6. Other Sensors
- 8.3. Market Analysis, Insights and Forecast - by Applications
- 8.3.1. Commercial
- 8.3.2. Consumer Electronics
- 8.3.3. Medical
- 8.3.4. Automotive
- 8.3.5. Industrial
- 8.3.6. Aerospace & Defence
- 8.3.7. Optocouplers
- 8.3.7.1. 4-pin Optocouplers
- 8.3.7.2. 6-pin Optocouplers
- 8.3.7.3. High speed optocouplers
- 8.3.7.4. IGBT gate driver optocouplers
- 8.3.7.5. Isolation Amplifier Optocouplers
- 8.3.8. Others
- 8.1. Market Analysis, Insights and Forecast - by Technology
- 9. Middle East & Africa NA Optical Sensors Market Analysis, Insights and Forecast, 2019-2031
- 9.1. Market Analysis, Insights and Forecast - by Technology
- 9.1.1. Hyperspectral imaging
- 9.1.2. Near IR Spectroscopy
- 9.1.3. Photo-Acoustic Tomography
- 9.1.4. Optical Coherence Tomography
- 9.2. Market Analysis, Insights and Forecast - by Sensor Type
- 9.2.1. Fiber Optic Sensors
- 9.2.2. Image Sensors
- 9.2.3. Position Sensors
- 9.2.4. Ambient Light and Proximity Sensors
- 9.2.4.1. Cadmium Sulfide
- 9.2.4.2. Silicon
- 9.2.4.3. InGaAs Sensors
- 9.2.4.4. Extended InGaAs Sensors
- 9.2.5. Infrared Sensors
- 9.2.6. Other Sensors
- 9.3. Market Analysis, Insights and Forecast - by Applications
- 9.3.1. Commercial
- 9.3.2. Consumer Electronics
- 9.3.3. Medical
- 9.3.4. Automotive
- 9.3.5. Industrial
- 9.3.6. Aerospace & Defence
- 9.3.7. Optocouplers
- 9.3.7.1. 4-pin Optocouplers
- 9.3.7.2. 6-pin Optocouplers
- 9.3.7.3. High speed optocouplers
- 9.3.7.4. IGBT gate driver optocouplers
- 9.3.7.5. Isolation Amplifier Optocouplers
- 9.3.8. Others
- 9.1. Market Analysis, Insights and Forecast - by Technology
- 10. Asia Pacific NA Optical Sensors Market Analysis, Insights and Forecast, 2019-2031
- 10.1. Market Analysis, Insights and Forecast - by Technology
- 10.1.1. Hyperspectral imaging
- 10.1.2. Near IR Spectroscopy
- 10.1.3. Photo-Acoustic Tomography
- 10.1.4. Optical Coherence Tomography
- 10.2. Market Analysis, Insights and Forecast - by Sensor Type
- 10.2.1. Fiber Optic Sensors
- 10.2.2. Image Sensors
- 10.2.3. Position Sensors
- 10.2.4. Ambient Light and Proximity Sensors
- 10.2.4.1. Cadmium Sulfide
- 10.2.4.2. Silicon
- 10.2.4.3. InGaAs Sensors
- 10.2.4.4. Extended InGaAs Sensors
- 10.2.5. Infrared Sensors
- 10.2.6. Other Sensors
- 10.3. Market Analysis, Insights and Forecast - by Applications
- 10.3.1. Commercial
- 10.3.2. Consumer Electronics
- 10.3.3. Medical
- 10.3.4. Automotive
- 10.3.5. Industrial
- 10.3.6. Aerospace & Defence
- 10.3.7. Optocouplers
- 10.3.7.1. 4-pin Optocouplers
- 10.3.7.2. 6-pin Optocouplers
- 10.3.7.3. High speed optocouplers
- 10.3.7.4. IGBT gate driver optocouplers
- 10.3.7.5. Isolation Amplifier Optocouplers
- 10.3.8. Others
- 10.1. Market Analysis, Insights and Forecast - by Technology
- 11. North America NA Optical Sensors Market Analysis, Insights and Forecast, 2019-2031
- 11.1. Market Analysis, Insights and Forecast - By Country/Sub-region
- 11.1.1.
- 12. Europe NA Optical Sensors Market Analysis, Insights and Forecast, 2019-2031
- 12.1. Market Analysis, Insights and Forecast - By Country/Sub-region
- 12.1.1.
- 13. Asia Pacific NA Optical Sensors Market Analysis, Insights and Forecast, 2019-2031
- 13.1. Market Analysis, Insights and Forecast - By Country/Sub-region
- 13.1.1.
- 14. Latin America NA Optical Sensors Market Analysis, Insights and Forecast, 2019-2031
- 14.1. Market Analysis, Insights and Forecast - By Country/Sub-region
- 14.1.1.
- 15. Middle East NA Optical Sensors Market Analysis, Insights and Forecast, 2019-2031
- 15.1. Market Analysis, Insights and Forecast - By Country/Sub-region
- 15.1.1.
- 16. Competitive Analysis
- 16.1. Global Market Share Analysis 2024
- 16.2. Company Profiles
- 16.2.1 Rockwell Automation
- 16.2.1.1. Overview
- 16.2.1.2. Products
- 16.2.1.3. SWOT Analysis
- 16.2.1.4. Recent Developments
- 16.2.1.5. Financials (Based on Availability)
- 16.2.2 Honeywell Inc
- 16.2.2.1. Overview
- 16.2.2.2. Products
- 16.2.2.3. SWOT Analysis
- 16.2.2.4. Recent Developments
- 16.2.2.5. Financials (Based on Availability)
- 16.2.3 Turck inc
- 16.2.3.1. Overview
- 16.2.3.2. Products
- 16.2.3.3. SWOT Analysis
- 16.2.3.4. Recent Developments
- 16.2.3.5. Financials (Based on Availability)
- 16.2.4 ST Microelecronics inc
- 16.2.4.1. Overview
- 16.2.4.2. Products
- 16.2.4.3. SWOT Analysis
- 16.2.4.4. Recent Developments
- 16.2.4.5. Financials (Based on Availability)
- 16.2.5 Hitachi Ltd
- 16.2.5.1. Overview
- 16.2.5.2. Products
- 16.2.5.3. SWOT Analysis
- 16.2.5.4. Recent Developments
- 16.2.5.5. Financials (Based on Availability)
- 16.2.6 Omnivision Inc
- 16.2.6.1. Overview
- 16.2.6.2. Products
- 16.2.6.3. SWOT Analysis
- 16.2.6.4. Recent Developments
- 16.2.6.5. Financials (Based on Availability)
- 16.2.7 Sick AG
- 16.2.7.1. Overview
- 16.2.7.2. Products
- 16.2.7.3. SWOT Analysis
- 16.2.7.4. Recent Developments
- 16.2.7.5. Financials (Based on Availability)
- 16.2.8 Mouser Electronics Inc
- 16.2.8.1. Overview
- 16.2.8.2. Products
- 16.2.8.3. SWOT Analysis
- 16.2.8.4. Recent Developments
- 16.2.8.5. Financials (Based on Availability)
- 16.2.9 Robert Bosch GmbH
- 16.2.9.1. Overview
- 16.2.9.2. Products
- 16.2.9.3. SWOT Analysis
- 16.2.9.4. Recent Developments
- 16.2.9.5. Financials (Based on Availability)
- 16.2.10 Atmel Corporation
- 16.2.10.1. Overview
- 16.2.10.2. Products
- 16.2.10.3. SWOT Analysis
- 16.2.10.4. Recent Developments
- 16.2.10.5. Financials (Based on Availability)
- 16.2.11 Eaton Corporation
- 16.2.11.1. Overview
- 16.2.11.2. Products
- 16.2.11.3. SWOT Analysis
- 16.2.11.4. Recent Developments
- 16.2.11.5. Financials (Based on Availability)
- 16.2.1 Rockwell Automation
List of Figures
- Figure 1: Global NA Optical Sensors Market Revenue Breakdown (Million, %) by Region 2024 & 2032
- Figure 2: North America NA Optical Sensors Market Revenue (Million), by Country 2024 & 2032
- Figure 3: North America NA Optical Sensors Market Revenue Share (%), by Country 2024 & 2032
- Figure 4: Europe NA Optical Sensors Market Revenue (Million), by Country 2024 & 2032
- Figure 5: Europe NA Optical Sensors Market Revenue Share (%), by Country 2024 & 2032
- Figure 6: Asia Pacific NA Optical Sensors Market Revenue (Million), by Country 2024 & 2032
- Figure 7: Asia Pacific NA Optical Sensors Market Revenue Share (%), by Country 2024 & 2032
- Figure 8: Latin America NA Optical Sensors Market Revenue (Million), by Country 2024 & 2032
- Figure 9: Latin America NA Optical Sensors Market Revenue Share (%), by Country 2024 & 2032
- Figure 10: Middle East NA Optical Sensors Market Revenue (Million), by Country 2024 & 2032
- Figure 11: Middle East NA Optical Sensors Market Revenue Share (%), by Country 2024 & 2032
- Figure 12: North America NA Optical Sensors Market Revenue (Million), by Technology 2024 & 2032
- Figure 13: North America NA Optical Sensors Market Revenue Share (%), by Technology 2024 & 2032
- Figure 14: North America NA Optical Sensors Market Revenue (Million), by Sensor Type 2024 & 2032
- Figure 15: North America NA Optical Sensors Market Revenue Share (%), by Sensor Type 2024 & 2032
- Figure 16: North America NA Optical Sensors Market Revenue (Million), by Applications 2024 & 2032
- Figure 17: North America NA Optical Sensors Market Revenue Share (%), by Applications 2024 & 2032
- Figure 18: North America NA Optical Sensors Market Revenue (Million), by Country 2024 & 2032
- Figure 19: North America NA Optical Sensors Market Revenue Share (%), by Country 2024 & 2032
- Figure 20: South America NA Optical Sensors Market Revenue (Million), by Technology 2024 & 2032
- Figure 21: South America NA Optical Sensors Market Revenue Share (%), by Technology 2024 & 2032
- Figure 22: South America NA Optical Sensors Market Revenue (Million), by Sensor Type 2024 & 2032
- Figure 23: South America NA Optical Sensors Market Revenue Share (%), by Sensor Type 2024 & 2032
- Figure 24: South America NA Optical Sensors Market Revenue (Million), by Applications 2024 & 2032
- Figure 25: South America NA Optical Sensors Market Revenue Share (%), by Applications 2024 & 2032
- Figure 26: South America NA Optical Sensors Market Revenue (Million), by Country 2024 & 2032
- Figure 27: South America NA Optical Sensors Market Revenue Share (%), by Country 2024 & 2032
- Figure 28: Europe NA Optical Sensors Market Revenue (Million), by Technology 2024 & 2032
- Figure 29: Europe NA Optical Sensors Market Revenue Share (%), by Technology 2024 & 2032
- Figure 30: Europe NA Optical Sensors Market Revenue (Million), by Sensor Type 2024 & 2032
- Figure 31: Europe NA Optical Sensors Market Revenue Share (%), by Sensor Type 2024 & 2032
- Figure 32: Europe NA Optical Sensors Market Revenue (Million), by Applications 2024 & 2032
- Figure 33: Europe NA Optical Sensors Market Revenue Share (%), by Applications 2024 & 2032
- Figure 34: Europe NA Optical Sensors Market Revenue (Million), by Country 2024 & 2032
- Figure 35: Europe NA Optical Sensors Market Revenue Share (%), by Country 2024 & 2032
- Figure 36: Middle East & Africa NA Optical Sensors Market Revenue (Million), by Technology 2024 & 2032
- Figure 37: Middle East & Africa NA Optical Sensors Market Revenue Share (%), by Technology 2024 & 2032
- Figure 38: Middle East & Africa NA Optical Sensors Market Revenue (Million), by Sensor Type 2024 & 2032
- Figure 39: Middle East & Africa NA Optical Sensors Market Revenue Share (%), by Sensor Type 2024 & 2032
- Figure 40: Middle East & Africa NA Optical Sensors Market Revenue (Million), by Applications 2024 & 2032
- Figure 41: Middle East & Africa NA Optical Sensors Market Revenue Share (%), by Applications 2024 & 2032
- Figure 42: Middle East & Africa NA Optical Sensors Market Revenue (Million), by Country 2024 & 2032
- Figure 43: Middle East & Africa NA Optical Sensors Market Revenue Share (%), by Country 2024 & 2032
- Figure 44: Asia Pacific NA Optical Sensors Market Revenue (Million), by Technology 2024 & 2032
- Figure 45: Asia Pacific NA Optical Sensors Market Revenue Share (%), by Technology 2024 & 2032
- Figure 46: Asia Pacific NA Optical Sensors Market Revenue (Million), by Sensor Type 2024 & 2032
- Figure 47: Asia Pacific NA Optical Sensors Market Revenue Share (%), by Sensor Type 2024 & 2032
- Figure 48: Asia Pacific NA Optical Sensors Market Revenue (Million), by Applications 2024 & 2032
- Figure 49: Asia Pacific NA Optical Sensors Market Revenue Share (%), by Applications 2024 & 2032
- Figure 50: Asia Pacific NA Optical Sensors Market Revenue (Million), by Country 2024 & 2032
- Figure 51: Asia Pacific NA Optical Sensors Market Revenue Share (%), by Country 2024 & 2032
List of Tables
- Table 1: Global NA Optical Sensors Market Revenue Million Forecast, by Region 2019 & 2032
- Table 2: Global NA Optical Sensors Market Revenue Million Forecast, by Technology 2019 & 2032
- Table 3: Global NA Optical Sensors Market Revenue Million Forecast, by Sensor Type 2019 & 2032
- Table 4: Global NA Optical Sensors Market Revenue Million Forecast, by Applications 2019 & 2032
- Table 5: Global NA Optical Sensors Market Revenue Million Forecast, by Region 2019 & 2032
- Table 6: Global NA Optical Sensors Market Revenue Million Forecast, by Country 2019 & 2032
- Table 7: NA Optical Sensors Market Revenue (Million) Forecast, by Application 2019 & 2032
- Table 8: Global NA Optical Sensors Market Revenue Million Forecast, by Country 2019 & 2032
- Table 9: NA Optical Sensors Market Revenue (Million) Forecast, by Application 2019 & 2032
- Table 10: Global NA Optical Sensors Market Revenue Million Forecast, by Country 2019 & 2032
- Table 11: NA Optical Sensors Market Revenue (Million) Forecast, by Application 2019 & 2032
- Table 12: Global NA Optical Sensors Market Revenue Million Forecast, by Country 2019 & 2032
- Table 13: NA Optical Sensors Market Revenue (Million) Forecast, by Application 2019 & 2032
- Table 14: Global NA Optical Sensors Market Revenue Million Forecast, by Country 2019 & 2032
- Table 15: NA Optical Sensors Market Revenue (Million) Forecast, by Application 2019 & 2032
- Table 16: Global NA Optical Sensors Market Revenue Million Forecast, by Technology 2019 & 2032
- Table 17: Global NA Optical Sensors Market Revenue Million Forecast, by Sensor Type 2019 & 2032
- Table 18: Global NA Optical Sensors Market Revenue Million Forecast, by Applications 2019 & 2032
- Table 19: Global NA Optical Sensors Market Revenue Million Forecast, by Country 2019 & 2032
- Table 20: United States NA Optical Sensors Market Revenue (Million) Forecast, by Application 2019 & 2032
- Table 21: Canada NA Optical Sensors Market Revenue (Million) Forecast, by Application 2019 & 2032
- Table 22: Mexico NA Optical Sensors Market Revenue (Million) Forecast, by Application 2019 & 2032
- Table 23: Global NA Optical Sensors Market Revenue Million Forecast, by Technology 2019 & 2032
- Table 24: Global NA Optical Sensors Market Revenue Million Forecast, by Sensor Type 2019 & 2032
- Table 25: Global NA Optical Sensors Market Revenue Million Forecast, by Applications 2019 & 2032
- Table 26: Global NA Optical Sensors Market Revenue Million Forecast, by Country 2019 & 2032
- Table 27: Brazil NA Optical Sensors Market Revenue (Million) Forecast, by Application 2019 & 2032
- Table 28: Argentina NA Optical Sensors Market Revenue (Million) Forecast, by Application 2019 & 2032
- Table 29: Rest of South America NA Optical Sensors Market Revenue (Million) Forecast, by Application 2019 & 2032
- Table 30: Global NA Optical Sensors Market Revenue Million Forecast, by Technology 2019 & 2032
- Table 31: Global NA Optical Sensors Market Revenue Million Forecast, by Sensor Type 2019 & 2032
- Table 32: Global NA Optical Sensors Market Revenue Million Forecast, by Applications 2019 & 2032
- Table 33: Global NA Optical Sensors Market Revenue Million Forecast, by Country 2019 & 2032
- Table 34: United Kingdom NA Optical Sensors Market Revenue (Million) Forecast, by Application 2019 & 2032
- Table 35: Germany NA Optical Sensors Market Revenue (Million) Forecast, by Application 2019 & 2032
- Table 36: France NA Optical Sensors Market Revenue (Million) Forecast, by Application 2019 & 2032
- Table 37: Italy NA Optical Sensors Market Revenue (Million) Forecast, by Application 2019 & 2032
- Table 38: Spain NA Optical Sensors Market Revenue (Million) Forecast, by Application 2019 & 2032
- Table 39: Russia NA Optical Sensors Market Revenue (Million) Forecast, by Application 2019 & 2032
- Table 40: Benelux NA Optical Sensors Market Revenue (Million) Forecast, by Application 2019 & 2032
- Table 41: Nordics NA Optical Sensors Market Revenue (Million) Forecast, by Application 2019 & 2032
- Table 42: Rest of Europe NA Optical Sensors Market Revenue (Million) Forecast, by Application 2019 & 2032
- Table 43: Global NA Optical Sensors Market Revenue Million Forecast, by Technology 2019 & 2032
- Table 44: Global NA Optical Sensors Market Revenue Million Forecast, by Sensor Type 2019 & 2032
- Table 45: Global NA Optical Sensors Market Revenue Million Forecast, by Applications 2019 & 2032
- Table 46: Global NA Optical Sensors Market Revenue Million Forecast, by Country 2019 & 2032
- Table 47: Turkey NA Optical Sensors Market Revenue (Million) Forecast, by Application 2019 & 2032
- Table 48: Israel NA Optical Sensors Market Revenue (Million) Forecast, by Application 2019 & 2032
- Table 49: GCC NA Optical Sensors Market Revenue (Million) Forecast, by Application 2019 & 2032
- Table 50: North Africa NA Optical Sensors Market Revenue (Million) Forecast, by Application 2019 & 2032
- Table 51: South Africa NA Optical Sensors Market Revenue (Million) Forecast, by Application 2019 & 2032
- Table 52: Rest of Middle East & Africa NA Optical Sensors Market Revenue (Million) Forecast, by Application 2019 & 2032
- Table 53: Global NA Optical Sensors Market Revenue Million Forecast, by Technology 2019 & 2032
- Table 54: Global NA Optical Sensors Market Revenue Million Forecast, by Sensor Type 2019 & 2032
- Table 55: Global NA Optical Sensors Market Revenue Million Forecast, by Applications 2019 & 2032
- Table 56: Global NA Optical Sensors Market Revenue Million Forecast, by Country 2019 & 2032
- Table 57: China NA Optical Sensors Market Revenue (Million) Forecast, by Application 2019 & 2032
- Table 58: India NA Optical Sensors Market Revenue (Million) Forecast, by Application 2019 & 2032
- Table 59: Japan NA Optical Sensors Market Revenue (Million) Forecast, by Application 2019 & 2032
- Table 60: South Korea NA Optical Sensors Market Revenue (Million) Forecast, by Application 2019 & 2032
- Table 61: ASEAN NA Optical Sensors Market Revenue (Million) Forecast, by Application 2019 & 2032
- Table 62: Oceania NA Optical Sensors Market Revenue (Million) Forecast, by Application 2019 & 2032
- Table 63: Rest of Asia Pacific NA Optical Sensors Market Revenue (Million) Forecast, by Application 2019 & 2032
Frequently Asked Questions
1. What is the projected Compound Annual Growth Rate (CAGR) of the NA Optical Sensors Market?
The projected CAGR is approximately 8.10%.
2. Which companies are prominent players in the NA Optical Sensors Market?
Key companies in the market include Rockwell Automation, Honeywell Inc, Turck inc, ST Microelecronics inc, Hitachi Ltd, Omnivision Inc, Sick AG, Mouser Electronics Inc, Robert Bosch GmbH, Atmel Corporation, Eaton Corporation.
3. What are the main segments of the NA Optical Sensors Market?
The market segments include Technology, Sensor Type, Applications.
4. Can you provide details about the market size?
The market size is estimated to be USD XX Million as of 2022.
5. What are some drivers contributing to market growth?
Increasing Market Penetration of Smartphones; Increasing Demand for Power-saving Devices Across Industries; Increasing Market Penetration of Automation Techniques Across Various Industries.
6. What are the notable trends driving market growth?
Photoelectric Sensor is Expected to Register a Significant Growth.
7. Are there any restraints impacting market growth?
Imbalance Between the Image Quality and Price and Lack of standardization; Lack of awareness and acceptability of optical sensors.
8. Can you provide examples of recent developments in the market?
February 2021: Mouser Electronics stocked a broad selection of environmental sensors from Sensirion, a supplier of sensors for the medical and automotive industries. The selection included the SPS30 particulate matter sensor, which is an optical sensor that combines laser scattering with Sensirion's contamination-resistant technology. The sensor enables accurate measurements for HVAC equipment, air conditioners, and Internet of Things (IoT) devices.
9. What pricing options are available for accessing the report?
Pricing options include single-user, multi-user, and enterprise licenses priced at USD 4750, USD 4950, and USD 6800 respectively.
10. Is the market size provided in terms of value or volume?
The market size is provided in terms of value, measured in Million.
11. Are there any specific market keywords associated with the report?
Yes, the market keyword associated with the report is "NA Optical Sensors Market," which aids in identifying and referencing the specific market segment covered.
12. How do I determine which pricing option suits my needs best?
The pricing options vary based on user requirements and access needs. Individual users may opt for single-user licenses, while businesses requiring broader access may choose multi-user or enterprise licenses for cost-effective access to the report.
13. Are there any additional resources or data provided in the NA Optical Sensors Market report?
While the report offers comprehensive insights, it's advisable to review the specific contents or supplementary materials provided to ascertain if additional resources or data are available.
14. How can I stay updated on further developments or reports in the NA Optical Sensors Market?
To stay informed about further developments, trends, and reports in the NA Optical Sensors Market, consider subscribing to industry newsletters, following relevant companies and organizations, or regularly checking reputable industry news sources and publications.
Methodology
Step 1 - Identification of Relevant Samples Size from Population Database


Step 2 - Approaches for Defining Global Market Size (Value, Volume* & Price*)

Note*: In applicable scenarios
Step 3 - Data Sources
Primary Research
- Web Analytics
- Survey Reports
- Research Institute
- Latest Research Reports
- Opinion Leaders
Secondary Research
- Annual Reports
- White Paper
- Latest Press Release
- Industry Association
- Paid Database
- Investor Presentations

Step 4 - Data Triangulation
Involves using different sources of information in order to increase the validity of a study
These sources are likely to be stakeholders in a program - participants, other researchers, program staff, other community members, and so on.
Then we put all data in single framework & apply various statistical tools to find out the dynamic on the market.
During the analysis stage, feedback from the stakeholder groups would be compared to determine areas of agreement as well as areas of divergence


