
Key Insights
The nanohybrid composites market is experiencing robust growth, driven by increasing demand across diverse sectors. The market's Compound Annual Growth Rate (CAGR) exceeding 10% from 2019 to 2024 indicates significant expansion, projected to continue through 2033. This growth is fueled by several key factors. Firstly, the superior mechanical properties, lightweight nature, and enhanced durability of nanohybrid composites compared to traditional materials are driving adoption in high-performance applications. The expanding electrical and electronics industry, particularly in areas like advanced packaging and flexible electronics, presents a significant opportunity. Similarly, the automotive and aerospace industries are increasingly utilizing nanohybrid composites to reduce weight and improve fuel efficiency. Furthermore, advancements in nanomaterial synthesis and processing techniques are lowering production costs and enabling the creation of more specialized and customized composites, further stimulating market growth. The market segmentation reveals silica (SiO2), titanium dioxide (TiO2), and zirconia (ZrO2) as dominant material types, with dental materials, electrical and electronics, and paints and coatings representing the major application areas. Key players such as 3M, BASF SE, and Merck KGaA are driving innovation and expansion, leading to a highly competitive yet dynamic landscape.
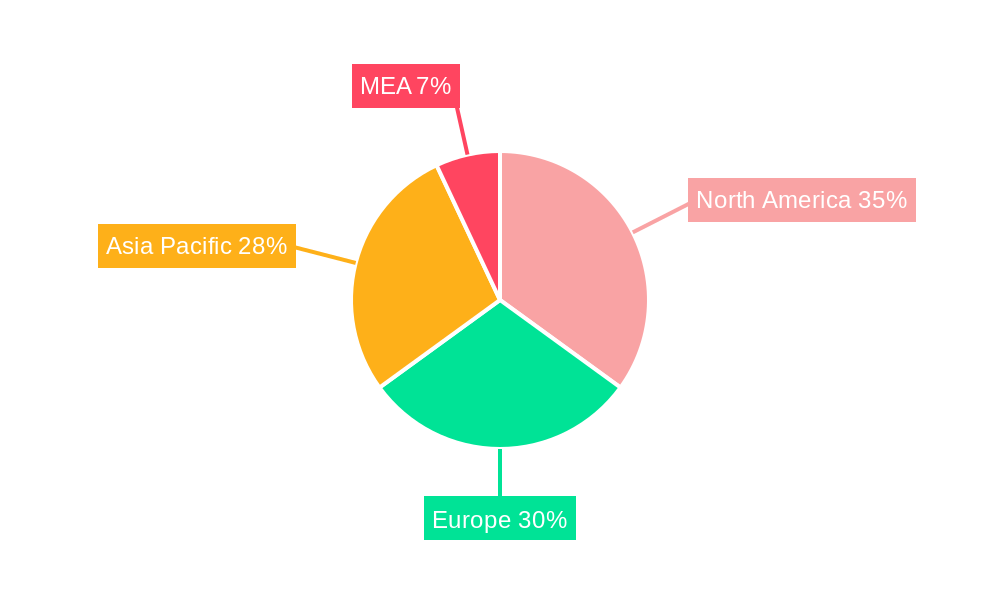
Geographic distribution shows a strong presence across North America, Europe, and the Asia-Pacific region. North America, benefiting from strong technological advancements and substantial research and development efforts, holds a significant market share. However, the Asia-Pacific region, particularly China and India, is projected to exhibit the fastest growth rate due to rapid industrialization and increasing infrastructure development. While challenges remain, such as the relatively high cost of production and potential environmental concerns related to certain nanomaterials, the overall market outlook remains positive. Continued innovation in material science and expanding applications are expected to overcome these challenges and sustain the robust growth trajectory of the nanohybrid composites market in the coming years. This growth is further supported by government initiatives promoting sustainable and lightweight materials in various industries globally.

Nanohybrid Composites Market: A Comprehensive Report (2019-2033)
This in-depth report provides a comprehensive analysis of the Nanohybrid Composites market, offering invaluable insights for stakeholders, investors, and industry professionals. The study period spans from 2019 to 2033, with 2025 serving as the base and estimated year. The forecast period covers 2025-2033, and the historical period encompasses 2019-2024. The report meticulously examines market segmentation by material type (Silica (SiO2), Titanium dioxide (TiO2), Zirconia (ZrO2), Carbons, Metals) and application (Dental Materials, Electrical and Electronics, Paints and Coatings, Other Applications), offering detailed growth projections and competitive landscapes for each segment. Key players such as ZYVEX TECHNOLOGIES, Merck KGaA, Inframat Corporation, Kerr Corporation, 3M, BASF SE, TAIHO Corporation, Jiangsu Cnano Technology Co, EPG AG, RTP Company, Akzo Nobel N V, Nanocyl S A, Foster Corporation, PlasmaChem GmbH, SHOWA DENKO K K, and Powdermet Inc. are analyzed, providing a complete overview of the market dynamics. The report projects a market value of xx Million by 2033, showcasing significant growth opportunities.
Nanohybrid Composites Market Concentration & Innovation
This section analyzes the competitive landscape of the nanohybrid composites market, including market concentration, innovation drivers, regulatory frameworks, and market dynamics. The market exhibits a moderately concentrated structure, with the top five players holding an estimated xx% market share in 2025. Innovation is driven by the ongoing research and development in nanomaterials, leading to the creation of novel composite materials with enhanced properties. Stringent regulatory frameworks concerning the safety and environmental impact of nanomaterials are influencing product development and market growth. Key product substitutes include traditional composite materials and other advanced materials. End-user trends, particularly in the electronics and automotive industries, are driving demand for lighter, stronger, and more durable nanohybrid composites. The market has witnessed several mergers and acquisitions (M&A) in recent years, with deal values ranging from xx Million to xx Million. These M&A activities indicate a strategic consolidation within the industry, aiming to enhance product portfolios and market reach.
- Market Share Concentration: Top 5 players hold approximately xx% of the market share.
- Innovation Drivers: Research & Development in nanomaterials, demand for high-performance materials.
- Regulatory Landscape: Stringent safety and environmental regulations impacting product development.
- M&A Activity: Significant M&A activity with deal values ranging from xx Million to xx Million.
Nanohybrid Composites Market Industry Trends & Insights
The nanohybrid composites market is experiencing robust growth, driven by increasing demand across diverse sectors including automotive, aerospace, electronics, and healthcare. Projected to grow at a CAGR of [Insert Updated CAGR]% during the forecast period (2025-2033), this expansion is fueled by several key factors. The rising adoption of nanohybrid composites in high-performance applications requiring enhanced strength, lightweight properties, and durability is a significant driver. Technological advancements, such as the development of novel nanomaterials (e.g., graphene, carbon nanotubes, and MXenes) and innovative manufacturing techniques (e.g., 3D printing and advanced polymer processing), are continuously improving material properties and expanding application possibilities. Furthermore, the growing consumer preference for sustainable and lightweight products is boosting market demand. The competitive landscape is dynamic, shaped by factors such as pricing strategies, intellectual property portfolios, research and development investments, and strategic partnerships. Market penetration varies across different applications; while sectors like dental materials and electronic components demonstrate significant adoption, substantial untapped potential remains in other areas, including construction, energy, and biomedical engineering. This section provides granular data and projections for different market segments, considering macroeconomic influences such as economic growth in emerging markets, fluctuations in raw material prices (e.g., carbon nanotubes and polymers), and geopolitical factors. A detailed analysis of regional market trends and growth opportunities is also included.
Dominant Markets & Segments in Nanohybrid Composites Market
The global nanohybrid composites market is geographically diverse, with significant regional variations in growth rates and market dynamics. Currently, the [Region Name, e.g., North America] region dominates the market, accounting for approximately xx% of the global market share in 2025. This dominance is primarily attributed to the high adoption rates in various end-use sectors and robust technological advancements.
Key Drivers for Dominant Regions:
- North America: Strong R&D investment, presence of major market players, high demand from aerospace and automotive industries.
- Europe: Stringent environmental regulations driving demand for eco-friendly composites, growing automotive industry.
- Asia Pacific: Rapid economic growth, rising disposable income, and increasing manufacturing activities.
Dominant Segments:
- Material Type: Silica (SiO2) currently holds the largest market share, owing to its cost-effectiveness and versatile properties. However, the Zirconia (ZrO2) segment is expected to showcase substantial growth due to its high strength and biocompatibility, especially in dental applications.
- Application: The electrical and electronics segment is anticipated to dominate the market throughout the forecast period due to the increasing demand for high-performance electronic components. The dental materials segment also exhibits strong growth potential, driven by technological advancements and increasing consumer awareness of advanced dental solutions.
Nanohybrid Composites Market Product Developments
Recent product innovations in the nanohybrid composites market are focused on enhancing material properties like strength, flexibility, and durability. New manufacturing techniques are being employed to improve the quality and consistency of composite materials while minimizing production costs. The development of specialized nanohybrid composites tailored for specific applications (e.g., high-temperature resistance for aerospace, biocompatibility for medical implants) is a key trend. This translates to enhanced market fit and competitive advantages for manufacturers who can offer customized solutions.
Report Scope & Segmentation Analysis
This report provides a comprehensive analysis of the nanohybrid composites market, segmented by material type and application.
Material Type: Silica (SiO2), Titanium dioxide (TiO2), Zirconia (ZrO2), Carbons, Metals. Each segment's market size, growth rate, and competitive landscape are analyzed in detail. For instance, the Silica (SiO2) segment is expected to maintain its leading position due to its wide availability and cost-effectiveness.
Application: Dental Materials, Electrical and Electronics, Paints and Coatings, Other Applications. Each segment's market dynamics, growth projections, and key players are analyzed. The Electrical and Electronics segment exhibits promising growth potential due to increasing demand for lightweight and high-performance components.
Key Drivers of Nanohybrid Composites Market Growth
The nanohybrid composites market is driven by several key factors: Firstly, the growing demand for high-performance materials across various industries, including automotive, aerospace, and electronics, is a major catalyst. Secondly, technological advancements leading to the development of superior nanohybrid composites with enhanced properties are fueling market growth. Finally, supportive government policies and initiatives promoting the adoption of advanced materials are also contributing to the expansion of this market.
Challenges in the Nanohybrid Composites Market Sector
The nanohybrid composites market faces several challenges. High production costs, especially for specialized nanomaterials, are a major barrier to wider adoption. Concerns regarding the potential environmental and health impacts of nanomaterials necessitate stringent regulatory compliance, adding to production costs and complexity. Furthermore, competition from traditional composite materials and other advanced materials puts downward pressure on pricing and margins.
Emerging Opportunities in Nanohybrid Composites Market
Significant emerging opportunities are driving further expansion within the nanohybrid composites market. The development of biocompatible nanohybrid composites for advanced medical applications, such as drug delivery systems, tissue engineering scaffolds, and implantable devices, presents a rapidly growing segment. The increasing focus on sustainability is fueling the demand for environmentally friendly nanohybrid composites derived from renewable resources and exhibiting biodegradability. Furthermore, ongoing research and development efforts are focused on exploring novel nanomaterials with enhanced properties, leading to the creation of high-performance composites with superior strength-to-weight ratios, thermal conductivity, and electrical properties. Expansion into new and developing markets, particularly in regions with burgeoning infrastructure development and industrial growth, presents substantial untapped potential.
Leading Players in the Nanohybrid Composites Market Market
- ZYVEX TECHNOLOGIES
- Merck KGaA
- Inframat Corporation
- Kerr Corporation
- 3M
- BASF SE
- TAIHO Corporation
- Jiangsu Cnano Technology Co
- EPG AG
- RTP Company
- Akzo Nobel N V
- Nanocyl S A
- Foster Corporation
- PlasmaChem GmbH
- SHOWA DENKO K K
- Powdermet Inc
Key Developments in Nanohybrid Composites Market Industry
- Jan 2023: Company X launched a new line of high-strength nanohybrid composites for aerospace applications, highlighting improved [specific property, e.g., fatigue resistance, thermal stability].
- May 2022: Company Y and Company Z announced a strategic partnership to develop novel biocompatible nanohybrid composites for medical implants, focusing on [specific application, e.g., bone regeneration, cardiovascular stents].
- Oct 2021: New regulations on the use of nanomaterials in consumer products were implemented in [Region Name], impacting [specific aspect, e.g., labeling requirements, safety testing protocols].
- [Add other relevant key developments with specifics]
Strategic Outlook for Nanohybrid Composites Market Market
The future of the nanohybrid composites market is bright, with substantial growth potential driven by technological advancements, increasing demand from various industries, and supportive government policies. Continued innovation in nanomaterials and manufacturing techniques will be key to unlocking new opportunities and enhancing market competitiveness. The focus on sustainability and environmental concerns will shape future product development, creating a demand for eco-friendly nanohybrid composites.
Nanohybrid Composites Market Segmentation
-
1. Material Type
- 1.1. Silica (SiO2)
- 1.2. Titanium dioxide (TiO2)
- 1.3. Zirconia (ZrO2)
- 1.4. Carbons
- 1.5. Metals
-
2. Application
- 2.1. Dental Materials
- 2.2. Electrical and Electronics
- 2.3. Paints and Coatings
- 2.4. Other Applications
Nanohybrid Composites Market Segmentation By Geography
-
1. Asia Pacific
- 1.1. China
- 1.2. India
- 1.3. Japan
- 1.4. South Korea
- 1.5. Rest of Asia Pacific
-
2. North America
- 2.1. United States
- 2.2. Canada
- 2.3. Mexico
-
3. Europe
- 3.1. Germany
- 3.2. United Kingdom
- 3.3. Italy
- 3.4. France
- 3.5. Rest of Europe
-
4. Rest of the World
- 4.1. South America
- 4.2. Middle East and Africa
Nanohybrid Composites Market REPORT HIGHLIGHTS
| Aspects | Details |
|---|---|
| Study Period | 2019-2033 |
| Base Year | 2024 |
| Estimated Year | 2025 |
| Forecast Period | 2025-2033 |
| Historical Period | 2019-2024 |
| Growth Rate | CAGR of > 10.00% from 2019-2033 |
| Segmentation |
|
Table of Contents
- 1. Introduction
- 1.1. Research Scope
- 1.2. Market Segmentation
- 1.3. Research Methodology
- 1.4. Definitions and Assumptions
- 2. Executive Summary
- 2.1. Introduction
- 3. Market Dynamics
- 3.1. Introduction
- 3.2. Market Drivers
- 3.2.1. Growing Usage of Nanohybrid Composites in the Dental Industry; Other Drivers
- 3.3. Market Restrains
- 3.3.1. Substitutions like Nano-filled Composites
- 3.4. Market Trends
- 3.4.1. Progressive Usage of Dental Materials Rises the Demand for the Market
- 4. Market Factor Analysis
- 4.1. Porters Five Forces
- 4.2. Supply/Value Chain
- 4.3. PESTEL analysis
- 4.4. Market Entropy
- 4.5. Patent/Trademark Analysis
- 5. Global Nanohybrid Composites Market Analysis, Insights and Forecast, 2019-2031
- 5.1. Market Analysis, Insights and Forecast - by Material Type
- 5.1.1. Silica (SiO2)
- 5.1.2. Titanium dioxide (TiO2)
- 5.1.3. Zirconia (ZrO2)
- 5.1.4. Carbons
- 5.1.5. Metals
- 5.2. Market Analysis, Insights and Forecast - by Application
- 5.2.1. Dental Materials
- 5.2.2. Electrical and Electronics
- 5.2.3. Paints and Coatings
- 5.2.4. Other Applications
- 5.3. Market Analysis, Insights and Forecast - by Region
- 5.3.1. Asia Pacific
- 5.3.2. North America
- 5.3.3. Europe
- 5.3.4. Rest of the World
- 5.1. Market Analysis, Insights and Forecast - by Material Type
- 6. Asia Pacific Nanohybrid Composites Market Analysis, Insights and Forecast, 2019-2031
- 6.1. Market Analysis, Insights and Forecast - by Material Type
- 6.1.1. Silica (SiO2)
- 6.1.2. Titanium dioxide (TiO2)
- 6.1.3. Zirconia (ZrO2)
- 6.1.4. Carbons
- 6.1.5. Metals
- 6.2. Market Analysis, Insights and Forecast - by Application
- 6.2.1. Dental Materials
- 6.2.2. Electrical and Electronics
- 6.2.3. Paints and Coatings
- 6.2.4. Other Applications
- 6.1. Market Analysis, Insights and Forecast - by Material Type
- 7. North America Nanohybrid Composites Market Analysis, Insights and Forecast, 2019-2031
- 7.1. Market Analysis, Insights and Forecast - by Material Type
- 7.1.1. Silica (SiO2)
- 7.1.2. Titanium dioxide (TiO2)
- 7.1.3. Zirconia (ZrO2)
- 7.1.4. Carbons
- 7.1.5. Metals
- 7.2. Market Analysis, Insights and Forecast - by Application
- 7.2.1. Dental Materials
- 7.2.2. Electrical and Electronics
- 7.2.3. Paints and Coatings
- 7.2.4. Other Applications
- 7.1. Market Analysis, Insights and Forecast - by Material Type
- 8. Europe Nanohybrid Composites Market Analysis, Insights and Forecast, 2019-2031
- 8.1. Market Analysis, Insights and Forecast - by Material Type
- 8.1.1. Silica (SiO2)
- 8.1.2. Titanium dioxide (TiO2)
- 8.1.3. Zirconia (ZrO2)
- 8.1.4. Carbons
- 8.1.5. Metals
- 8.2. Market Analysis, Insights and Forecast - by Application
- 8.2.1. Dental Materials
- 8.2.2. Electrical and Electronics
- 8.2.3. Paints and Coatings
- 8.2.4. Other Applications
- 8.1. Market Analysis, Insights and Forecast - by Material Type
- 9. Rest of the World Nanohybrid Composites Market Analysis, Insights and Forecast, 2019-2031
- 9.1. Market Analysis, Insights and Forecast - by Material Type
- 9.1.1. Silica (SiO2)
- 9.1.2. Titanium dioxide (TiO2)
- 9.1.3. Zirconia (ZrO2)
- 9.1.4. Carbons
- 9.1.5. Metals
- 9.2. Market Analysis, Insights and Forecast - by Application
- 9.2.1. Dental Materials
- 9.2.2. Electrical and Electronics
- 9.2.3. Paints and Coatings
- 9.2.4. Other Applications
- 9.1. Market Analysis, Insights and Forecast - by Material Type
- 10. North America Nanohybrid Composites Market Analysis, Insights and Forecast, 2019-2031
- 10.1. Market Analysis, Insights and Forecast - By Country/Sub-region
- 10.1.1 United States
- 10.1.2 Canada
- 10.1.3 Mexico
- 11. Europe Nanohybrid Composites Market Analysis, Insights and Forecast, 2019-2031
- 11.1. Market Analysis, Insights and Forecast - By Country/Sub-region
- 11.1.1 Germany
- 11.1.2 United Kingdom
- 11.1.3 France
- 11.1.4 Spain
- 11.1.5 Italy
- 11.1.6 Spain
- 11.1.7 Belgium
- 11.1.8 Netherland
- 11.1.9 Nordics
- 11.1.10 Rest of Europe
- 12. Asia Pacific Nanohybrid Composites Market Analysis, Insights and Forecast, 2019-2031
- 12.1. Market Analysis, Insights and Forecast - By Country/Sub-region
- 12.1.1 China
- 12.1.2 Japan
- 12.1.3 India
- 12.1.4 South Korea
- 12.1.5 Southeast Asia
- 12.1.6 Australia
- 12.1.7 Indonesia
- 12.1.8 Phillipes
- 12.1.9 Singapore
- 12.1.10 Thailandc
- 12.1.11 Rest of Asia Pacific
- 13. MEA Nanohybrid Composites Market Analysis, Insights and Forecast, 2019-2031
- 13.1. Market Analysis, Insights and Forecast - By Country/Sub-region
- 13.1.1 United Arab Emirates
- 13.1.2 Saudi Arabia
- 13.1.3 South Africa
- 13.1.4 Rest of Middle East and Africa
- 14. Competitive Analysis
- 14.1. Global Market Share Analysis 2024
- 14.2. Company Profiles
- 14.2.1 ZYVEX TECHNOLOGIES*List Not Exhaustive
- 14.2.1.1. Overview
- 14.2.1.2. Products
- 14.2.1.3. SWOT Analysis
- 14.2.1.4. Recent Developments
- 14.2.1.5. Financials (Based on Availability)
- 14.2.2 Merck KGaA
- 14.2.2.1. Overview
- 14.2.2.2. Products
- 14.2.2.3. SWOT Analysis
- 14.2.2.4. Recent Developments
- 14.2.2.5. Financials (Based on Availability)
- 14.2.3 Inframat Corporation
- 14.2.3.1. Overview
- 14.2.3.2. Products
- 14.2.3.3. SWOT Analysis
- 14.2.3.4. Recent Developments
- 14.2.3.5. Financials (Based on Availability)
- 14.2.4 Kerr Corporation
- 14.2.4.1. Overview
- 14.2.4.2. Products
- 14.2.4.3. SWOT Analysis
- 14.2.4.4. Recent Developments
- 14.2.4.5. Financials (Based on Availability)
- 14.2.5 3M
- 14.2.5.1. Overview
- 14.2.5.2. Products
- 14.2.5.3. SWOT Analysis
- 14.2.5.4. Recent Developments
- 14.2.5.5. Financials (Based on Availability)
- 14.2.6 BASF SE
- 14.2.6.1. Overview
- 14.2.6.2. Products
- 14.2.6.3. SWOT Analysis
- 14.2.6.4. Recent Developments
- 14.2.6.5. Financials (Based on Availability)
- 14.2.7 TAIHO Corporation
- 14.2.7.1. Overview
- 14.2.7.2. Products
- 14.2.7.3. SWOT Analysis
- 14.2.7.4. Recent Developments
- 14.2.7.5. Financials (Based on Availability)
- 14.2.8 Jiangsu Cnano Technology Co
- 14.2.8.1. Overview
- 14.2.8.2. Products
- 14.2.8.3. SWOT Analysis
- 14.2.8.4. Recent Developments
- 14.2.8.5. Financials (Based on Availability)
- 14.2.9 EPG AG
- 14.2.9.1. Overview
- 14.2.9.2. Products
- 14.2.9.3. SWOT Analysis
- 14.2.9.4. Recent Developments
- 14.2.9.5. Financials (Based on Availability)
- 14.2.10 RTP Company
- 14.2.10.1. Overview
- 14.2.10.2. Products
- 14.2.10.3. SWOT Analysis
- 14.2.10.4. Recent Developments
- 14.2.10.5. Financials (Based on Availability)
- 14.2.11 Akzo Nobel N V
- 14.2.11.1. Overview
- 14.2.11.2. Products
- 14.2.11.3. SWOT Analysis
- 14.2.11.4. Recent Developments
- 14.2.11.5. Financials (Based on Availability)
- 14.2.12 Nanocyl S A
- 14.2.12.1. Overview
- 14.2.12.2. Products
- 14.2.12.3. SWOT Analysis
- 14.2.12.4. Recent Developments
- 14.2.12.5. Financials (Based on Availability)
- 14.2.13 Foster Corporation
- 14.2.13.1. Overview
- 14.2.13.2. Products
- 14.2.13.3. SWOT Analysis
- 14.2.13.4. Recent Developments
- 14.2.13.5. Financials (Based on Availability)
- 14.2.14 PlasmaChem GmbH
- 14.2.14.1. Overview
- 14.2.14.2. Products
- 14.2.14.3. SWOT Analysis
- 14.2.14.4. Recent Developments
- 14.2.14.5. Financials (Based on Availability)
- 14.2.15 SHOWA DENKO K K
- 14.2.15.1. Overview
- 14.2.15.2. Products
- 14.2.15.3. SWOT Analysis
- 14.2.15.4. Recent Developments
- 14.2.15.5. Financials (Based on Availability)
- 14.2.16 Powdermet Inc
- 14.2.16.1. Overview
- 14.2.16.2. Products
- 14.2.16.3. SWOT Analysis
- 14.2.16.4. Recent Developments
- 14.2.16.5. Financials (Based on Availability)
- 14.2.1 ZYVEX TECHNOLOGIES*List Not Exhaustive
List of Figures
- Figure 1: Global Nanohybrid Composites Market Revenue Breakdown (Million, %) by Region 2024 & 2032
- Figure 2: North America Nanohybrid Composites Market Revenue (Million), by Country 2024 & 2032
- Figure 3: North America Nanohybrid Composites Market Revenue Share (%), by Country 2024 & 2032
- Figure 4: Europe Nanohybrid Composites Market Revenue (Million), by Country 2024 & 2032
- Figure 5: Europe Nanohybrid Composites Market Revenue Share (%), by Country 2024 & 2032
- Figure 6: Asia Pacific Nanohybrid Composites Market Revenue (Million), by Country 2024 & 2032
- Figure 7: Asia Pacific Nanohybrid Composites Market Revenue Share (%), by Country 2024 & 2032
- Figure 8: MEA Nanohybrid Composites Market Revenue (Million), by Country 2024 & 2032
- Figure 9: MEA Nanohybrid Composites Market Revenue Share (%), by Country 2024 & 2032
- Figure 10: Asia Pacific Nanohybrid Composites Market Revenue (Million), by Material Type 2024 & 2032
- Figure 11: Asia Pacific Nanohybrid Composites Market Revenue Share (%), by Material Type 2024 & 2032
- Figure 12: Asia Pacific Nanohybrid Composites Market Revenue (Million), by Application 2024 & 2032
- Figure 13: Asia Pacific Nanohybrid Composites Market Revenue Share (%), by Application 2024 & 2032
- Figure 14: Asia Pacific Nanohybrid Composites Market Revenue (Million), by Country 2024 & 2032
- Figure 15: Asia Pacific Nanohybrid Composites Market Revenue Share (%), by Country 2024 & 2032
- Figure 16: North America Nanohybrid Composites Market Revenue (Million), by Material Type 2024 & 2032
- Figure 17: North America Nanohybrid Composites Market Revenue Share (%), by Material Type 2024 & 2032
- Figure 18: North America Nanohybrid Composites Market Revenue (Million), by Application 2024 & 2032
- Figure 19: North America Nanohybrid Composites Market Revenue Share (%), by Application 2024 & 2032
- Figure 20: North America Nanohybrid Composites Market Revenue (Million), by Country 2024 & 2032
- Figure 21: North America Nanohybrid Composites Market Revenue Share (%), by Country 2024 & 2032
- Figure 22: Europe Nanohybrid Composites Market Revenue (Million), by Material Type 2024 & 2032
- Figure 23: Europe Nanohybrid Composites Market Revenue Share (%), by Material Type 2024 & 2032
- Figure 24: Europe Nanohybrid Composites Market Revenue (Million), by Application 2024 & 2032
- Figure 25: Europe Nanohybrid Composites Market Revenue Share (%), by Application 2024 & 2032
- Figure 26: Europe Nanohybrid Composites Market Revenue (Million), by Country 2024 & 2032
- Figure 27: Europe Nanohybrid Composites Market Revenue Share (%), by Country 2024 & 2032
- Figure 28: Rest of the World Nanohybrid Composites Market Revenue (Million), by Material Type 2024 & 2032
- Figure 29: Rest of the World Nanohybrid Composites Market Revenue Share (%), by Material Type 2024 & 2032
- Figure 30: Rest of the World Nanohybrid Composites Market Revenue (Million), by Application 2024 & 2032
- Figure 31: Rest of the World Nanohybrid Composites Market Revenue Share (%), by Application 2024 & 2032
- Figure 32: Rest of the World Nanohybrid Composites Market Revenue (Million), by Country 2024 & 2032
- Figure 33: Rest of the World Nanohybrid Composites Market Revenue Share (%), by Country 2024 & 2032
List of Tables
- Table 1: Global Nanohybrid Composites Market Revenue Million Forecast, by Region 2019 & 2032
- Table 2: Global Nanohybrid Composites Market Revenue Million Forecast, by Material Type 2019 & 2032
- Table 3: Global Nanohybrid Composites Market Revenue Million Forecast, by Application 2019 & 2032
- Table 4: Global Nanohybrid Composites Market Revenue Million Forecast, by Region 2019 & 2032
- Table 5: Global Nanohybrid Composites Market Revenue Million Forecast, by Country 2019 & 2032
- Table 6: United States Nanohybrid Composites Market Revenue (Million) Forecast, by Application 2019 & 2032
- Table 7: Canada Nanohybrid Composites Market Revenue (Million) Forecast, by Application 2019 & 2032
- Table 8: Mexico Nanohybrid Composites Market Revenue (Million) Forecast, by Application 2019 & 2032
- Table 9: Global Nanohybrid Composites Market Revenue Million Forecast, by Country 2019 & 2032
- Table 10: Germany Nanohybrid Composites Market Revenue (Million) Forecast, by Application 2019 & 2032
- Table 11: United Kingdom Nanohybrid Composites Market Revenue (Million) Forecast, by Application 2019 & 2032
- Table 12: France Nanohybrid Composites Market Revenue (Million) Forecast, by Application 2019 & 2032
- Table 13: Spain Nanohybrid Composites Market Revenue (Million) Forecast, by Application 2019 & 2032
- Table 14: Italy Nanohybrid Composites Market Revenue (Million) Forecast, by Application 2019 & 2032
- Table 15: Spain Nanohybrid Composites Market Revenue (Million) Forecast, by Application 2019 & 2032
- Table 16: Belgium Nanohybrid Composites Market Revenue (Million) Forecast, by Application 2019 & 2032
- Table 17: Netherland Nanohybrid Composites Market Revenue (Million) Forecast, by Application 2019 & 2032
- Table 18: Nordics Nanohybrid Composites Market Revenue (Million) Forecast, by Application 2019 & 2032
- Table 19: Rest of Europe Nanohybrid Composites Market Revenue (Million) Forecast, by Application 2019 & 2032
- Table 20: Global Nanohybrid Composites Market Revenue Million Forecast, by Country 2019 & 2032
- Table 21: China Nanohybrid Composites Market Revenue (Million) Forecast, by Application 2019 & 2032
- Table 22: Japan Nanohybrid Composites Market Revenue (Million) Forecast, by Application 2019 & 2032
- Table 23: India Nanohybrid Composites Market Revenue (Million) Forecast, by Application 2019 & 2032
- Table 24: South Korea Nanohybrid Composites Market Revenue (Million) Forecast, by Application 2019 & 2032
- Table 25: Southeast Asia Nanohybrid Composites Market Revenue (Million) Forecast, by Application 2019 & 2032
- Table 26: Australia Nanohybrid Composites Market Revenue (Million) Forecast, by Application 2019 & 2032
- Table 27: Indonesia Nanohybrid Composites Market Revenue (Million) Forecast, by Application 2019 & 2032
- Table 28: Phillipes Nanohybrid Composites Market Revenue (Million) Forecast, by Application 2019 & 2032
- Table 29: Singapore Nanohybrid Composites Market Revenue (Million) Forecast, by Application 2019 & 2032
- Table 30: Thailandc Nanohybrid Composites Market Revenue (Million) Forecast, by Application 2019 & 2032
- Table 31: Rest of Asia Pacific Nanohybrid Composites Market Revenue (Million) Forecast, by Application 2019 & 2032
- Table 32: Global Nanohybrid Composites Market Revenue Million Forecast, by Country 2019 & 2032
- Table 33: United Arab Emirates Nanohybrid Composites Market Revenue (Million) Forecast, by Application 2019 & 2032
- Table 34: Saudi Arabia Nanohybrid Composites Market Revenue (Million) Forecast, by Application 2019 & 2032
- Table 35: South Africa Nanohybrid Composites Market Revenue (Million) Forecast, by Application 2019 & 2032
- Table 36: Rest of Middle East and Africa Nanohybrid Composites Market Revenue (Million) Forecast, by Application 2019 & 2032
- Table 37: Global Nanohybrid Composites Market Revenue Million Forecast, by Material Type 2019 & 2032
- Table 38: Global Nanohybrid Composites Market Revenue Million Forecast, by Application 2019 & 2032
- Table 39: Global Nanohybrid Composites Market Revenue Million Forecast, by Country 2019 & 2032
- Table 40: China Nanohybrid Composites Market Revenue (Million) Forecast, by Application 2019 & 2032
- Table 41: India Nanohybrid Composites Market Revenue (Million) Forecast, by Application 2019 & 2032
- Table 42: Japan Nanohybrid Composites Market Revenue (Million) Forecast, by Application 2019 & 2032
- Table 43: South Korea Nanohybrid Composites Market Revenue (Million) Forecast, by Application 2019 & 2032
- Table 44: Rest of Asia Pacific Nanohybrid Composites Market Revenue (Million) Forecast, by Application 2019 & 2032
- Table 45: Global Nanohybrid Composites Market Revenue Million Forecast, by Material Type 2019 & 2032
- Table 46: Global Nanohybrid Composites Market Revenue Million Forecast, by Application 2019 & 2032
- Table 47: Global Nanohybrid Composites Market Revenue Million Forecast, by Country 2019 & 2032
- Table 48: United States Nanohybrid Composites Market Revenue (Million) Forecast, by Application 2019 & 2032
- Table 49: Canada Nanohybrid Composites Market Revenue (Million) Forecast, by Application 2019 & 2032
- Table 50: Mexico Nanohybrid Composites Market Revenue (Million) Forecast, by Application 2019 & 2032
- Table 51: Global Nanohybrid Composites Market Revenue Million Forecast, by Material Type 2019 & 2032
- Table 52: Global Nanohybrid Composites Market Revenue Million Forecast, by Application 2019 & 2032
- Table 53: Global Nanohybrid Composites Market Revenue Million Forecast, by Country 2019 & 2032
- Table 54: Germany Nanohybrid Composites Market Revenue (Million) Forecast, by Application 2019 & 2032
- Table 55: United Kingdom Nanohybrid Composites Market Revenue (Million) Forecast, by Application 2019 & 2032
- Table 56: Italy Nanohybrid Composites Market Revenue (Million) Forecast, by Application 2019 & 2032
- Table 57: France Nanohybrid Composites Market Revenue (Million) Forecast, by Application 2019 & 2032
- Table 58: Rest of Europe Nanohybrid Composites Market Revenue (Million) Forecast, by Application 2019 & 2032
- Table 59: Global Nanohybrid Composites Market Revenue Million Forecast, by Material Type 2019 & 2032
- Table 60: Global Nanohybrid Composites Market Revenue Million Forecast, by Application 2019 & 2032
- Table 61: Global Nanohybrid Composites Market Revenue Million Forecast, by Country 2019 & 2032
- Table 62: South America Nanohybrid Composites Market Revenue (Million) Forecast, by Application 2019 & 2032
- Table 63: Middle East and Africa Nanohybrid Composites Market Revenue (Million) Forecast, by Application 2019 & 2032
Frequently Asked Questions
1. What is the projected Compound Annual Growth Rate (CAGR) of the Nanohybrid Composites Market?
The projected CAGR is approximately > 10.00%.
2. Which companies are prominent players in the Nanohybrid Composites Market?
Key companies in the market include ZYVEX TECHNOLOGIES*List Not Exhaustive, Merck KGaA, Inframat Corporation, Kerr Corporation, 3M, BASF SE, TAIHO Corporation, Jiangsu Cnano Technology Co, EPG AG, RTP Company, Akzo Nobel N V, Nanocyl S A, Foster Corporation, PlasmaChem GmbH, SHOWA DENKO K K, Powdermet Inc.
3. What are the main segments of the Nanohybrid Composites Market?
The market segments include Material Type, Application.
4. Can you provide details about the market size?
The market size is estimated to be USD XX Million as of 2022.
5. What are some drivers contributing to market growth?
Growing Usage of Nanohybrid Composites in the Dental Industry; Other Drivers.
6. What are the notable trends driving market growth?
Progressive Usage of Dental Materials Rises the Demand for the Market.
7. Are there any restraints impacting market growth?
Substitutions like Nano-filled Composites.
8. Can you provide examples of recent developments in the market?
N/A
9. What pricing options are available for accessing the report?
Pricing options include single-user, multi-user, and enterprise licenses priced at USD 4750, USD 5250, and USD 8750 respectively.
10. Is the market size provided in terms of value or volume?
The market size is provided in terms of value, measured in Million.
11. Are there any specific market keywords associated with the report?
Yes, the market keyword associated with the report is "Nanohybrid Composites Market," which aids in identifying and referencing the specific market segment covered.
12. How do I determine which pricing option suits my needs best?
The pricing options vary based on user requirements and access needs. Individual users may opt for single-user licenses, while businesses requiring broader access may choose multi-user or enterprise licenses for cost-effective access to the report.
13. Are there any additional resources or data provided in the Nanohybrid Composites Market report?
While the report offers comprehensive insights, it's advisable to review the specific contents or supplementary materials provided to ascertain if additional resources or data are available.
14. How can I stay updated on further developments or reports in the Nanohybrid Composites Market?
To stay informed about further developments, trends, and reports in the Nanohybrid Composites Market, consider subscribing to industry newsletters, following relevant companies and organizations, or regularly checking reputable industry news sources and publications.
Methodology
Step 1 - Identification of Relevant Samples Size from Population Database


Step 2 - Approaches for Defining Global Market Size (Value, Volume* & Price*)

Note*: In applicable scenarios
Step 3 - Data Sources
Primary Research
- Web Analytics
- Survey Reports
- Research Institute
- Latest Research Reports
- Opinion Leaders
Secondary Research
- Annual Reports
- White Paper
- Latest Press Release
- Industry Association
- Paid Database
- Investor Presentations

Step 4 - Data Triangulation
Involves using different sources of information in order to increase the validity of a study
These sources are likely to be stakeholders in a program - participants, other researchers, program staff, other community members, and so on.
Then we put all data in single framework & apply various statistical tools to find out the dynamic on the market.
During the analysis stage, feedback from the stakeholder groups would be compared to determine areas of agreement as well as areas of divergence


