
Key Insights
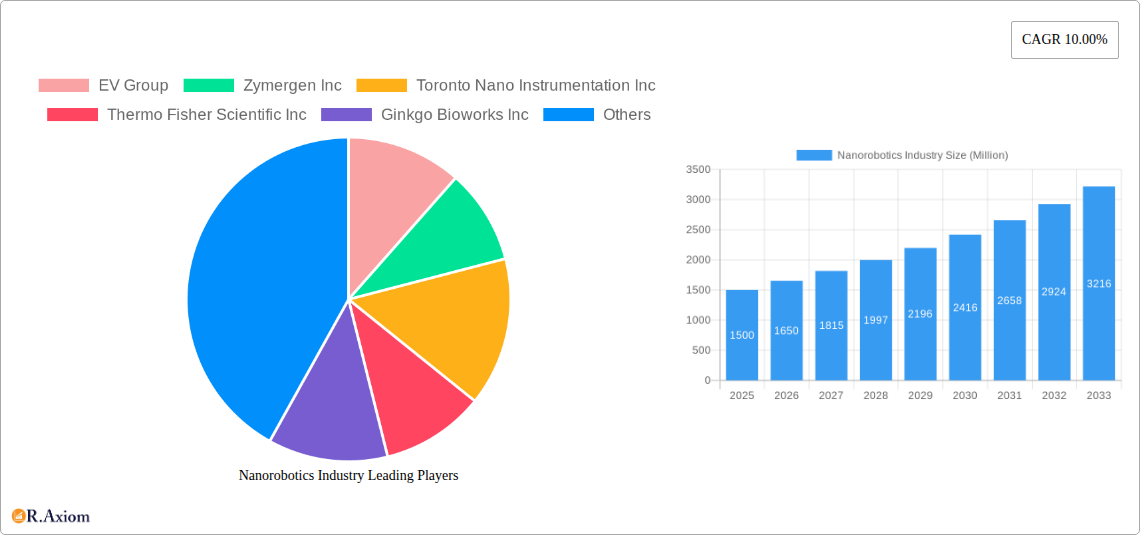
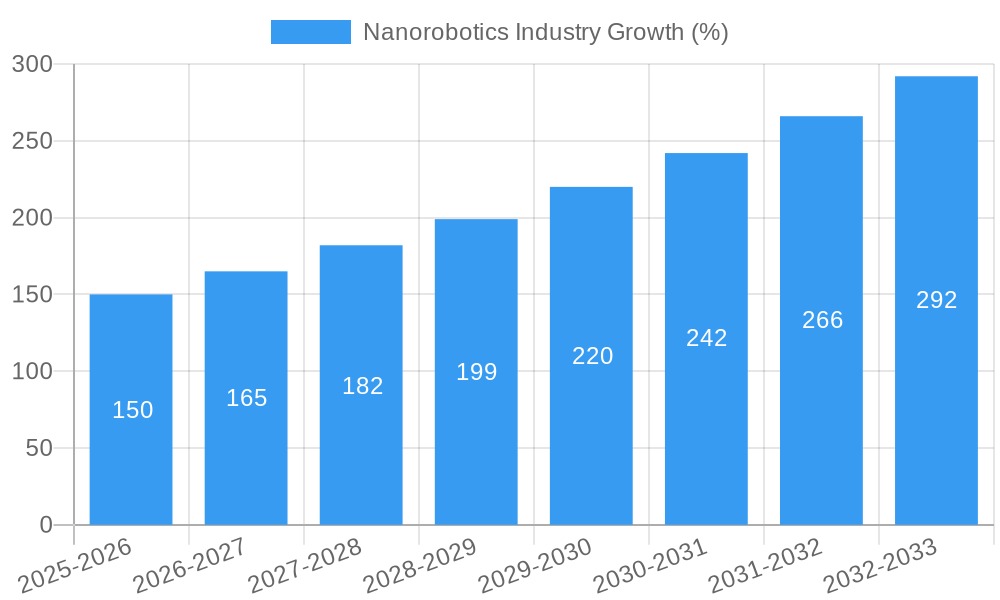
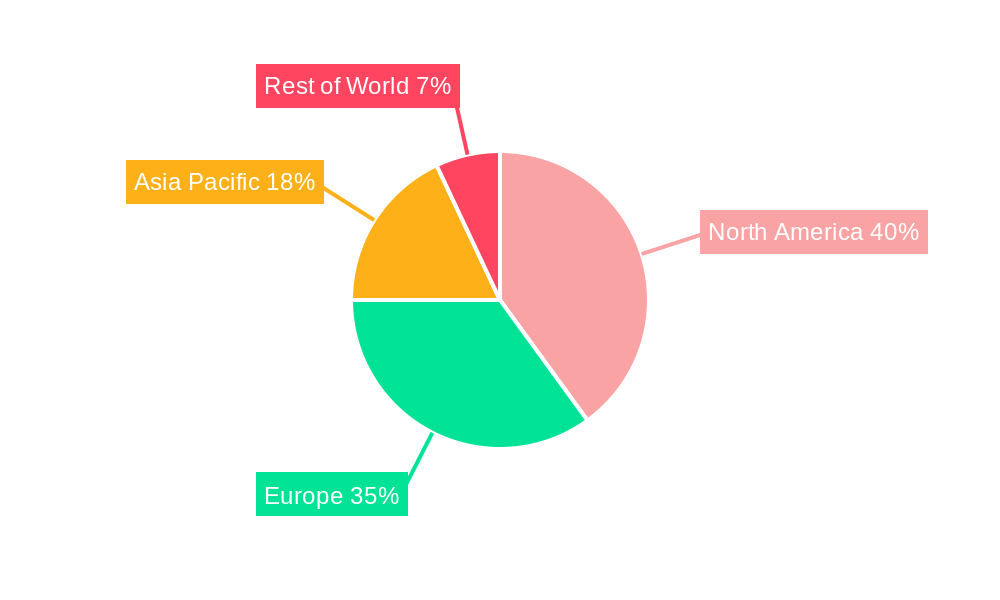
The nanorobotics market is experiencing robust growth, projected to reach a substantial size by 2033, driven by significant advancements in nanotechnology and its expanding applications across diverse sectors. A Compound Annual Growth Rate (CAGR) of 10% from 2025 to 2033 indicates a consistently expanding market. Key drivers include the increasing demand for minimally invasive medical procedures, the need for highly efficient drug delivery systems, and the rising adoption of nanorobotics in advanced imaging techniques. The market segmentation reveals a strong focus on biochips and nanobots for medical imaging and drug delivery applications, reflecting the immediate commercial potential in healthcare. While the 3D printing segment shows promise, it is currently a smaller contributor compared to the more established biochip and nanobot segments. Technological hurdles in manufacturing and regulatory challenges associated with the integration of nanorobotics into healthcare systems act as key restraints, although ongoing research and development efforts are actively addressing these limitations. North America and Europe currently dominate the market due to established research infrastructure and regulatory frameworks, but the Asia-Pacific region is expected to exhibit rapid growth due to increasing investment in nanotechnology and a growing healthcare sector.
The competitive landscape is characterized by a mix of established players and emerging innovative companies. Companies like Thermo Fisher Scientific and Illumina, with their experience in related fields, are well-positioned to capitalize on this expanding market, while smaller, specialized firms like Zymergen and Ginkgo Bioworks are contributing to the development of novel nanorobotic technologies. Future market growth will likely depend on successful technological breakthroughs that reduce manufacturing costs, enhance the precision and functionality of nanorobots, and overcome regulatory concerns surrounding their widespread adoption. Continued research into applications beyond healthcare, such as information storage and advanced manufacturing, will also unlock new avenues for market expansion and diversification. The long-term outlook for the nanorobotics market remains highly promising, with its potential to revolutionize numerous industries.
This comprehensive report provides a detailed analysis of the global nanorobotics industry, offering invaluable insights for stakeholders, investors, and industry professionals. The report covers the period from 2019 to 2033, with a focus on the forecast period of 2025-2033 and a base year of 2025. The market is segmented by type of manufacturing (Biochips, Nubots, Bacteria-based Nanobots, 3D Printing, Other Types) and application (Medical Imaging, Information Storage, Drug Delivery, Health Sensors and Replicators, Other Applications). The report features leading companies such as EV Group, Zymergen Inc, Toronto Nano Instrumentation Inc, Thermo Fisher Scientific Inc, Ginkgo Bioworks Inc, Oxford Instruments, Imina Technologies SA, Synthace Limited, Illumina Inc, and Nanoics Imaging Limited. Expect detailed analysis of market size (in Millions), CAGR, and key market trends.
Nanorobotics Industry Market Concentration & Innovation
The nanorobotics industry is characterized by a moderately concentrated market, with a few major players holding significant market share. However, the emergence of innovative startups and the increasing investment in R&D are driving fragmentation. Market share analysis reveals that Thermo Fisher Scientific Inc and Illumina Inc currently hold the largest market share, estimated at xx% and xx% respectively, as of 2025. The total market value in 2025 is estimated to be $xx Million. Innovation is largely driven by advancements in nanomaterials, microfabrication techniques, and bioengineering. Regulatory frameworks, while still evolving, are increasingly focusing on safety and ethical considerations, impacting market growth. Product substitutes are limited, largely due to the unique capabilities of nanorobotics. M&A activity is significant, with several large companies acquiring smaller, specialized firms to expand their product portfolios and technological expertise. Between 2019 and 2024, the total value of M&A deals in the nanorobotics industry reached approximately $xx Million. Future M&A activity is expected to increase, driven by the desire to consolidate market share and accelerate innovation.
- Market Share (2025): Thermo Fisher Scientific Inc (xx%), Illumina Inc (xx%), Others (xx%)
- M&A Deal Value (2019-2024): $xx Million
- Key Innovation Drivers: Advancements in nanomaterials, microfabrication, and bioengineering.
Nanorobotics Industry Industry Trends & Insights
The nanorobotics industry is experiencing robust growth, fueled by several key trends. The market is projected to reach $xx Million by 2033, exhibiting a CAGR of xx% during the forecast period (2025-2033). Technological disruptions, such as the development of advanced microscopy techniques and more sophisticated control mechanisms for nanorobots, are significantly impacting market dynamics. Consumer preferences are increasingly shifting towards personalized medicine and minimally invasive procedures, driving the demand for targeted drug delivery systems and advanced medical imaging. Competitive dynamics are intense, with established players focusing on expanding their product portfolios and entering new markets, while startups are developing innovative solutions and attracting significant funding. Market penetration is increasing across various applications, particularly in medical diagnostics and therapeutics. The rising adoption of nanorobotics in point-of-care diagnostics and personalized medicine is a major factor driving growth. The development of AI-powered nanorobots is also expected to significantly influence market expansion in the coming years.
Dominant Markets & Segments in Nanorobotics Industry
The North American region currently dominates the nanorobotics market, driven by substantial investments in R&D, a well-established healthcare infrastructure, and a supportive regulatory environment. Within this region, the United States holds the largest market share, accounting for approximately xx% of the global market in 2025.
Dominant Segments:
- By Type of Manufacturing: Medical Imaging applications using Biochips hold the largest segment with a projected market size of $xx Million in 2025. This is driven by increased demand for high resolution imaging and minimally invasive procedures. 3D printing is also rapidly growing and accounts for xx% of the total market.
- By Application: The Medical Imaging segment is the most dominant, accounting for approximately xx% of the total market, driven by the increasing demand for advanced diagnostic tools. The Drug Delivery segment is also rapidly growing due to the growing prevalence of chronic diseases.
Key Drivers for North American Dominance:
- Strong R&D investment
- Advanced healthcare infrastructure
- Supportive regulatory environment
- High adoption rate of advanced medical technologies
Nanorobotics Industry Product Developments
Recent product innovations include advanced biochips with enhanced sensitivity and specificity, more sophisticated Nubots capable of performing complex tasks, and bacteria-based nanobots designed for targeted drug delivery. These advancements offer significant competitive advantages, enabling improved diagnostic accuracy, targeted therapeutics, and enhanced patient outcomes. The integration of artificial intelligence and machine learning is also leading to the development of more autonomous and intelligent nanorobotic systems, significantly enhancing capabilities. These improvements demonstrate a strong market fit by addressing unmet clinical needs and enhancing treatment efficacy.
Report Scope & Segmentation Analysis
This report segments the nanorobotics market by type of manufacturing (Biochips, Nubots, Bacteria-based Nanobots, 3D Printing, Other Types) and application (Medical Imaging, Information Storage, Drug Delivery, Health Sensors and Replicators, Other Applications). Each segment's growth projections, market size, and competitive dynamics are analyzed. The Biochips segment shows high growth potential due to increased demand for advanced diagnostics, while the Drug Delivery segment is rapidly expanding due to its potential for personalized medicine. The 3D printing segment is experiencing notable expansion due to the increasing demand for high throughput and customized manufacturing. The competitive landscape varies across segments, with some dominated by a few large players, while others are more fragmented.
Key Drivers of Nanorobotics Industry Growth
Several key factors are driving the growth of the nanorobotics industry. Technological advancements, particularly in nanomaterials, microfabrication, and bioengineering, are significantly improving the capabilities of nanorobotic systems. Government funding and private investment in R&D are fueling innovation and accelerating product development. The increasing prevalence of chronic diseases and the rising demand for personalized medicine are creating significant market opportunities. Favorable regulatory policies and increasing acceptance of nanotechnology in healthcare are also contributing to the growth.
Challenges in the Nanorobotics Industry Sector
The nanorobotics industry faces several challenges, including stringent regulatory requirements that can slow down product development and commercialization. Supply chain complexities and the cost of manufacturing advanced nanorobotic systems can also limit market penetration. The need for skilled professionals and the potential safety concerns associated with nanotechnology can impede growth. Intense competition from established players and emerging startups can impact profitability. It is estimated that these challenges collectively lead to a xx% reduction in market growth annually.
Emerging Opportunities in Nanorobotics Industry
Emerging opportunities exist in the development of novel nanomaterials with enhanced functionalities, and the integration of AI and machine learning to create more sophisticated and autonomous nanorobotic systems. The expanding application of nanorobotics in environmental monitoring and remediation presents new market prospects. Increasing research in nanorobotics for personalized cancer therapy and minimally invasive surgery offers significant growth potential. The development of biocompatible and biodegradable nanorobots is also opening doors to new therapeutic applications.
Leading Players in the Nanorobotics Industry Market
- EV Group
- Zymergen Inc
- Toronto Nano Instrumentation Inc
- Thermo Fisher Scientific Inc
- Ginkgo Bioworks Inc
- Oxford Instruments
- Imina Technologies SA
- Synthace Limited
- Illumina Inc
- Nanoics Imaging Limited
Key Developments in Nanorobotics Industry Industry
- 2022-Q4: Thermo Fisher Scientific Inc launched a new line of advanced biochips with improved sensitivity.
- 2023-Q1: Zymergen Inc announced a partnership with a major pharmaceutical company to develop targeted drug delivery systems.
- 2023-Q3: Oxford Instruments acquired a startup specializing in nanorobotics for medical imaging. (Further specific examples would be added here based on actual data)
Strategic Outlook for Nanorobotics Industry Market
The nanorobotics industry is poised for significant growth over the next decade, driven by continuous technological advancements, increased investments in R&D, and the expanding applications in healthcare and other sectors. The development of sophisticated nanorobotic systems with enhanced capabilities and improved safety profiles will be a key driver of market expansion. The increasing adoption of nanorobotics in various fields, coupled with favorable regulatory landscapes, will contribute significantly to market growth. Strategic partnerships and collaborations between industry players and research institutions will be crucial for accelerating innovation and driving market adoption.
Nanorobotics Industry Segmentation
-
1. Type of Manufacuturing
- 1.1. Biochips
- 1.2. Nubots
- 1.3. Bacteria-based Nanobots
- 1.4. 3D Printing
- 1.5. Other Types
-
2. Application
- 2.1. Medical Imaging
- 2.2. Information Storage
- 2.3. Drug Delivery
- 2.4. Health Sensors and Replicators
- 2.5. Other Applications
Nanorobotics Industry Segmentation By Geography
-
1. North America
- 1.1. Unites States
- 1.2. Canada
-
2. Europe
- 2.1. Germany
- 2.2. United Kingdom
- 2.3. France
- 2.4. Rest of Europe
-
3. Asia Pacific
- 3.1. India
- 3.2. China
- 3.3. Japan
- 3.4. Rest of Asia Pacific
-
4. Rest of the World
- 4.1. Latin America
- 4.2. Middle East and Africa
Nanorobotics Industry REPORT HIGHLIGHTS
| Aspects | Details |
|---|---|
| Study Period | 2019-2033 |
| Base Year | 2024 |
| Estimated Year | 2025 |
| Forecast Period | 2025-2033 |
| Historical Period | 2019-2024 |
| Growth Rate | CAGR of 10.00% from 2019-2033 |
| Segmentation |
|
Table of Contents
- 1. Introduction
- 1.1. Research Scope
- 1.2. Market Segmentation
- 1.3. Research Methodology
- 1.4. Definitions and Assumptions
- 2. Executive Summary
- 2.1. Introduction
- 3. Market Dynamics
- 3.1. Introduction
- 3.2. Market Drivers
- 3.2.1. ; Increasing Investment in Technology by Governments and Universities; Growing Demand for Advanced Medical Treatments
- 3.3. Market Restrains
- 3.3.1. ; High Manufacturing and Development Costs
- 3.4. Market Trends
- 3.4.1. Drug Delivery Application is Expected to Witness Significant Growth Rate
- 4. Market Factor Analysis
- 4.1. Porters Five Forces
- 4.2. Supply/Value Chain
- 4.3. PESTEL analysis
- 4.4. Market Entropy
- 4.5. Patent/Trademark Analysis
- 5. Global Nanorobotics Industry Analysis, Insights and Forecast, 2019-2031
- 5.1. Market Analysis, Insights and Forecast - by Type of Manufacuturing
- 5.1.1. Biochips
- 5.1.2. Nubots
- 5.1.3. Bacteria-based Nanobots
- 5.1.4. 3D Printing
- 5.1.5. Other Types
- 5.2. Market Analysis, Insights and Forecast - by Application
- 5.2.1. Medical Imaging
- 5.2.2. Information Storage
- 5.2.3. Drug Delivery
- 5.2.4. Health Sensors and Replicators
- 5.2.5. Other Applications
- 5.3. Market Analysis, Insights and Forecast - by Region
- 5.3.1. North America
- 5.3.2. Europe
- 5.3.3. Asia Pacific
- 5.3.4. Rest of the World
- 5.1. Market Analysis, Insights and Forecast - by Type of Manufacuturing
- 6. North America Nanorobotics Industry Analysis, Insights and Forecast, 2019-2031
- 6.1. Market Analysis, Insights and Forecast - by Type of Manufacuturing
- 6.1.1. Biochips
- 6.1.2. Nubots
- 6.1.3. Bacteria-based Nanobots
- 6.1.4. 3D Printing
- 6.1.5. Other Types
- 6.2. Market Analysis, Insights and Forecast - by Application
- 6.2.1. Medical Imaging
- 6.2.2. Information Storage
- 6.2.3. Drug Delivery
- 6.2.4. Health Sensors and Replicators
- 6.2.5. Other Applications
- 6.1. Market Analysis, Insights and Forecast - by Type of Manufacuturing
- 7. Europe Nanorobotics Industry Analysis, Insights and Forecast, 2019-2031
- 7.1. Market Analysis, Insights and Forecast - by Type of Manufacuturing
- 7.1.1. Biochips
- 7.1.2. Nubots
- 7.1.3. Bacteria-based Nanobots
- 7.1.4. 3D Printing
- 7.1.5. Other Types
- 7.2. Market Analysis, Insights and Forecast - by Application
- 7.2.1. Medical Imaging
- 7.2.2. Information Storage
- 7.2.3. Drug Delivery
- 7.2.4. Health Sensors and Replicators
- 7.2.5. Other Applications
- 7.1. Market Analysis, Insights and Forecast - by Type of Manufacuturing
- 8. Asia Pacific Nanorobotics Industry Analysis, Insights and Forecast, 2019-2031
- 8.1. Market Analysis, Insights and Forecast - by Type of Manufacuturing
- 8.1.1. Biochips
- 8.1.2. Nubots
- 8.1.3. Bacteria-based Nanobots
- 8.1.4. 3D Printing
- 8.1.5. Other Types
- 8.2. Market Analysis, Insights and Forecast - by Application
- 8.2.1. Medical Imaging
- 8.2.2. Information Storage
- 8.2.3. Drug Delivery
- 8.2.4. Health Sensors and Replicators
- 8.2.5. Other Applications
- 8.1. Market Analysis, Insights and Forecast - by Type of Manufacuturing
- 9. Rest of the World Nanorobotics Industry Analysis, Insights and Forecast, 2019-2031
- 9.1. Market Analysis, Insights and Forecast - by Type of Manufacuturing
- 9.1.1. Biochips
- 9.1.2. Nubots
- 9.1.3. Bacteria-based Nanobots
- 9.1.4. 3D Printing
- 9.1.5. Other Types
- 9.2. Market Analysis, Insights and Forecast - by Application
- 9.2.1. Medical Imaging
- 9.2.2. Information Storage
- 9.2.3. Drug Delivery
- 9.2.4. Health Sensors and Replicators
- 9.2.5. Other Applications
- 9.1. Market Analysis, Insights and Forecast - by Type of Manufacuturing
- 10. North America Nanorobotics Industry Analysis, Insights and Forecast, 2019-2031
- 10.1. Market Analysis, Insights and Forecast - By Country/Sub-region
- 10.1.1 United States
- 10.1.2 Canada
- 10.1.3 Mexico
- 11. Europe Nanorobotics Industry Analysis, Insights and Forecast, 2019-2031
- 11.1. Market Analysis, Insights and Forecast - By Country/Sub-region
- 11.1.1 Germany
- 11.1.2 United Kingdom
- 11.1.3 France
- 11.1.4 Spain
- 11.1.5 Italy
- 11.1.6 Spain
- 11.1.7 Belgium
- 11.1.8 Netherland
- 11.1.9 Nordics
- 11.1.10 Rest of Europe
- 12. Asia Pacific Nanorobotics Industry Analysis, Insights and Forecast, 2019-2031
- 12.1. Market Analysis, Insights and Forecast - By Country/Sub-region
- 12.1.1 China
- 12.1.2 Japan
- 12.1.3 India
- 12.1.4 South Korea
- 12.1.5 Southeast Asia
- 12.1.6 Australia
- 12.1.7 Indonesia
- 12.1.8 Phillipes
- 12.1.9 Singapore
- 12.1.10 Thailandc
- 12.1.11 Rest of Asia Pacific
- 13. South America Nanorobotics Industry Analysis, Insights and Forecast, 2019-2031
- 13.1. Market Analysis, Insights and Forecast - By Country/Sub-region
- 13.1.1 Brazil
- 13.1.2 Argentina
- 13.1.3 Peru
- 13.1.4 Chile
- 13.1.5 Colombia
- 13.1.6 Ecuador
- 13.1.7 Venezuela
- 13.1.8 Rest of South America
- 14. North America Nanorobotics Industry Analysis, Insights and Forecast, 2019-2031
- 14.1. Market Analysis, Insights and Forecast - By Country/Sub-region
- 14.1.1 United States
- 14.1.2 Canada
- 14.1.3 Mexico
- 15. MEA Nanorobotics Industry Analysis, Insights and Forecast, 2019-2031
- 15.1. Market Analysis, Insights and Forecast - By Country/Sub-region
- 15.1.1 United Arab Emirates
- 15.1.2 Saudi Arabia
- 15.1.3 South Africa
- 15.1.4 Rest of Middle East and Africa
- 16. Competitive Analysis
- 16.1. Global Market Share Analysis 2024
- 16.2. Company Profiles
- 16.2.1 EV Group
- 16.2.1.1. Overview
- 16.2.1.2. Products
- 16.2.1.3. SWOT Analysis
- 16.2.1.4. Recent Developments
- 16.2.1.5. Financials (Based on Availability)
- 16.2.2 Zymergen Inc
- 16.2.2.1. Overview
- 16.2.2.2. Products
- 16.2.2.3. SWOT Analysis
- 16.2.2.4. Recent Developments
- 16.2.2.5. Financials (Based on Availability)
- 16.2.3 Toronto Nano Instrumentation Inc
- 16.2.3.1. Overview
- 16.2.3.2. Products
- 16.2.3.3. SWOT Analysis
- 16.2.3.4. Recent Developments
- 16.2.3.5. Financials (Based on Availability)
- 16.2.4 Thermo Fisher Scientific Inc
- 16.2.4.1. Overview
- 16.2.4.2. Products
- 16.2.4.3. SWOT Analysis
- 16.2.4.4. Recent Developments
- 16.2.4.5. Financials (Based on Availability)
- 16.2.5 Ginkgo Bioworks Inc
- 16.2.5.1. Overview
- 16.2.5.2. Products
- 16.2.5.3. SWOT Analysis
- 16.2.5.4. Recent Developments
- 16.2.5.5. Financials (Based on Availability)
- 16.2.6 Oxford Instruments
- 16.2.6.1. Overview
- 16.2.6.2. Products
- 16.2.6.3. SWOT Analysis
- 16.2.6.4. Recent Developments
- 16.2.6.5. Financials (Based on Availability)
- 16.2.7 Imina Technologies SA
- 16.2.7.1. Overview
- 16.2.7.2. Products
- 16.2.7.3. SWOT Analysis
- 16.2.7.4. Recent Developments
- 16.2.7.5. Financials (Based on Availability)
- 16.2.8 Synthace Limited
- 16.2.8.1. Overview
- 16.2.8.2. Products
- 16.2.8.3. SWOT Analysis
- 16.2.8.4. Recent Developments
- 16.2.8.5. Financials (Based on Availability)
- 16.2.9 Illumina Inc
- 16.2.9.1. Overview
- 16.2.9.2. Products
- 16.2.9.3. SWOT Analysis
- 16.2.9.4. Recent Developments
- 16.2.9.5. Financials (Based on Availability)
- 16.2.10 Nanoics Imaging Limited
- 16.2.10.1. Overview
- 16.2.10.2. Products
- 16.2.10.3. SWOT Analysis
- 16.2.10.4. Recent Developments
- 16.2.10.5. Financials (Based on Availability)
- 16.2.1 EV Group
List of Figures
- Figure 1: Global Nanorobotics Industry Revenue Breakdown (Million, %) by Region 2024 & 2032
- Figure 2: North America Nanorobotics Industry Revenue (Million), by Country 2024 & 2032
- Figure 3: North America Nanorobotics Industry Revenue Share (%), by Country 2024 & 2032
- Figure 4: Europe Nanorobotics Industry Revenue (Million), by Country 2024 & 2032
- Figure 5: Europe Nanorobotics Industry Revenue Share (%), by Country 2024 & 2032
- Figure 6: Asia Pacific Nanorobotics Industry Revenue (Million), by Country 2024 & 2032
- Figure 7: Asia Pacific Nanorobotics Industry Revenue Share (%), by Country 2024 & 2032
- Figure 8: South America Nanorobotics Industry Revenue (Million), by Country 2024 & 2032
- Figure 9: South America Nanorobotics Industry Revenue Share (%), by Country 2024 & 2032
- Figure 10: North America Nanorobotics Industry Revenue (Million), by Country 2024 & 2032
- Figure 11: North America Nanorobotics Industry Revenue Share (%), by Country 2024 & 2032
- Figure 12: MEA Nanorobotics Industry Revenue (Million), by Country 2024 & 2032
- Figure 13: MEA Nanorobotics Industry Revenue Share (%), by Country 2024 & 2032
- Figure 14: North America Nanorobotics Industry Revenue (Million), by Type of Manufacuturing 2024 & 2032
- Figure 15: North America Nanorobotics Industry Revenue Share (%), by Type of Manufacuturing 2024 & 2032
- Figure 16: North America Nanorobotics Industry Revenue (Million), by Application 2024 & 2032
- Figure 17: North America Nanorobotics Industry Revenue Share (%), by Application 2024 & 2032
- Figure 18: North America Nanorobotics Industry Revenue (Million), by Country 2024 & 2032
- Figure 19: North America Nanorobotics Industry Revenue Share (%), by Country 2024 & 2032
- Figure 20: Europe Nanorobotics Industry Revenue (Million), by Type of Manufacuturing 2024 & 2032
- Figure 21: Europe Nanorobotics Industry Revenue Share (%), by Type of Manufacuturing 2024 & 2032
- Figure 22: Europe Nanorobotics Industry Revenue (Million), by Application 2024 & 2032
- Figure 23: Europe Nanorobotics Industry Revenue Share (%), by Application 2024 & 2032
- Figure 24: Europe Nanorobotics Industry Revenue (Million), by Country 2024 & 2032
- Figure 25: Europe Nanorobotics Industry Revenue Share (%), by Country 2024 & 2032
- Figure 26: Asia Pacific Nanorobotics Industry Revenue (Million), by Type of Manufacuturing 2024 & 2032
- Figure 27: Asia Pacific Nanorobotics Industry Revenue Share (%), by Type of Manufacuturing 2024 & 2032
- Figure 28: Asia Pacific Nanorobotics Industry Revenue (Million), by Application 2024 & 2032
- Figure 29: Asia Pacific Nanorobotics Industry Revenue Share (%), by Application 2024 & 2032
- Figure 30: Asia Pacific Nanorobotics Industry Revenue (Million), by Country 2024 & 2032
- Figure 31: Asia Pacific Nanorobotics Industry Revenue Share (%), by Country 2024 & 2032
- Figure 32: Rest of the World Nanorobotics Industry Revenue (Million), by Type of Manufacuturing 2024 & 2032
- Figure 33: Rest of the World Nanorobotics Industry Revenue Share (%), by Type of Manufacuturing 2024 & 2032
- Figure 34: Rest of the World Nanorobotics Industry Revenue (Million), by Application 2024 & 2032
- Figure 35: Rest of the World Nanorobotics Industry Revenue Share (%), by Application 2024 & 2032
- Figure 36: Rest of the World Nanorobotics Industry Revenue (Million), by Country 2024 & 2032
- Figure 37: Rest of the World Nanorobotics Industry Revenue Share (%), by Country 2024 & 2032
List of Tables
- Table 1: Global Nanorobotics Industry Revenue Million Forecast, by Region 2019 & 2032
- Table 2: Global Nanorobotics Industry Revenue Million Forecast, by Type of Manufacuturing 2019 & 2032
- Table 3: Global Nanorobotics Industry Revenue Million Forecast, by Application 2019 & 2032
- Table 4: Global Nanorobotics Industry Revenue Million Forecast, by Region 2019 & 2032
- Table 5: Global Nanorobotics Industry Revenue Million Forecast, by Country 2019 & 2032
- Table 6: United States Nanorobotics Industry Revenue (Million) Forecast, by Application 2019 & 2032
- Table 7: Canada Nanorobotics Industry Revenue (Million) Forecast, by Application 2019 & 2032
- Table 8: Mexico Nanorobotics Industry Revenue (Million) Forecast, by Application 2019 & 2032
- Table 9: Global Nanorobotics Industry Revenue Million Forecast, by Country 2019 & 2032
- Table 10: Germany Nanorobotics Industry Revenue (Million) Forecast, by Application 2019 & 2032
- Table 11: United Kingdom Nanorobotics Industry Revenue (Million) Forecast, by Application 2019 & 2032
- Table 12: France Nanorobotics Industry Revenue (Million) Forecast, by Application 2019 & 2032
- Table 13: Spain Nanorobotics Industry Revenue (Million) Forecast, by Application 2019 & 2032
- Table 14: Italy Nanorobotics Industry Revenue (Million) Forecast, by Application 2019 & 2032
- Table 15: Spain Nanorobotics Industry Revenue (Million) Forecast, by Application 2019 & 2032
- Table 16: Belgium Nanorobotics Industry Revenue (Million) Forecast, by Application 2019 & 2032
- Table 17: Netherland Nanorobotics Industry Revenue (Million) Forecast, by Application 2019 & 2032
- Table 18: Nordics Nanorobotics Industry Revenue (Million) Forecast, by Application 2019 & 2032
- Table 19: Rest of Europe Nanorobotics Industry Revenue (Million) Forecast, by Application 2019 & 2032
- Table 20: Global Nanorobotics Industry Revenue Million Forecast, by Country 2019 & 2032
- Table 21: China Nanorobotics Industry Revenue (Million) Forecast, by Application 2019 & 2032
- Table 22: Japan Nanorobotics Industry Revenue (Million) Forecast, by Application 2019 & 2032
- Table 23: India Nanorobotics Industry Revenue (Million) Forecast, by Application 2019 & 2032
- Table 24: South Korea Nanorobotics Industry Revenue (Million) Forecast, by Application 2019 & 2032
- Table 25: Southeast Asia Nanorobotics Industry Revenue (Million) Forecast, by Application 2019 & 2032
- Table 26: Australia Nanorobotics Industry Revenue (Million) Forecast, by Application 2019 & 2032
- Table 27: Indonesia Nanorobotics Industry Revenue (Million) Forecast, by Application 2019 & 2032
- Table 28: Phillipes Nanorobotics Industry Revenue (Million) Forecast, by Application 2019 & 2032
- Table 29: Singapore Nanorobotics Industry Revenue (Million) Forecast, by Application 2019 & 2032
- Table 30: Thailandc Nanorobotics Industry Revenue (Million) Forecast, by Application 2019 & 2032
- Table 31: Rest of Asia Pacific Nanorobotics Industry Revenue (Million) Forecast, by Application 2019 & 2032
- Table 32: Global Nanorobotics Industry Revenue Million Forecast, by Country 2019 & 2032
- Table 33: Brazil Nanorobotics Industry Revenue (Million) Forecast, by Application 2019 & 2032
- Table 34: Argentina Nanorobotics Industry Revenue (Million) Forecast, by Application 2019 & 2032
- Table 35: Peru Nanorobotics Industry Revenue (Million) Forecast, by Application 2019 & 2032
- Table 36: Chile Nanorobotics Industry Revenue (Million) Forecast, by Application 2019 & 2032
- Table 37: Colombia Nanorobotics Industry Revenue (Million) Forecast, by Application 2019 & 2032
- Table 38: Ecuador Nanorobotics Industry Revenue (Million) Forecast, by Application 2019 & 2032
- Table 39: Venezuela Nanorobotics Industry Revenue (Million) Forecast, by Application 2019 & 2032
- Table 40: Rest of South America Nanorobotics Industry Revenue (Million) Forecast, by Application 2019 & 2032
- Table 41: Global Nanorobotics Industry Revenue Million Forecast, by Country 2019 & 2032
- Table 42: United States Nanorobotics Industry Revenue (Million) Forecast, by Application 2019 & 2032
- Table 43: Canada Nanorobotics Industry Revenue (Million) Forecast, by Application 2019 & 2032
- Table 44: Mexico Nanorobotics Industry Revenue (Million) Forecast, by Application 2019 & 2032
- Table 45: Global Nanorobotics Industry Revenue Million Forecast, by Country 2019 & 2032
- Table 46: United Arab Emirates Nanorobotics Industry Revenue (Million) Forecast, by Application 2019 & 2032
- Table 47: Saudi Arabia Nanorobotics Industry Revenue (Million) Forecast, by Application 2019 & 2032
- Table 48: South Africa Nanorobotics Industry Revenue (Million) Forecast, by Application 2019 & 2032
- Table 49: Rest of Middle East and Africa Nanorobotics Industry Revenue (Million) Forecast, by Application 2019 & 2032
- Table 50: Global Nanorobotics Industry Revenue Million Forecast, by Type of Manufacuturing 2019 & 2032
- Table 51: Global Nanorobotics Industry Revenue Million Forecast, by Application 2019 & 2032
- Table 52: Global Nanorobotics Industry Revenue Million Forecast, by Country 2019 & 2032
- Table 53: Unites States Nanorobotics Industry Revenue (Million) Forecast, by Application 2019 & 2032
- Table 54: Canada Nanorobotics Industry Revenue (Million) Forecast, by Application 2019 & 2032
- Table 55: Global Nanorobotics Industry Revenue Million Forecast, by Type of Manufacuturing 2019 & 2032
- Table 56: Global Nanorobotics Industry Revenue Million Forecast, by Application 2019 & 2032
- Table 57: Global Nanorobotics Industry Revenue Million Forecast, by Country 2019 & 2032
- Table 58: Germany Nanorobotics Industry Revenue (Million) Forecast, by Application 2019 & 2032
- Table 59: United Kingdom Nanorobotics Industry Revenue (Million) Forecast, by Application 2019 & 2032
- Table 60: France Nanorobotics Industry Revenue (Million) Forecast, by Application 2019 & 2032
- Table 61: Rest of Europe Nanorobotics Industry Revenue (Million) Forecast, by Application 2019 & 2032
- Table 62: Global Nanorobotics Industry Revenue Million Forecast, by Type of Manufacuturing 2019 & 2032
- Table 63: Global Nanorobotics Industry Revenue Million Forecast, by Application 2019 & 2032
- Table 64: Global Nanorobotics Industry Revenue Million Forecast, by Country 2019 & 2032
- Table 65: India Nanorobotics Industry Revenue (Million) Forecast, by Application 2019 & 2032
- Table 66: China Nanorobotics Industry Revenue (Million) Forecast, by Application 2019 & 2032
- Table 67: Japan Nanorobotics Industry Revenue (Million) Forecast, by Application 2019 & 2032
- Table 68: Rest of Asia Pacific Nanorobotics Industry Revenue (Million) Forecast, by Application 2019 & 2032
- Table 69: Global Nanorobotics Industry Revenue Million Forecast, by Type of Manufacuturing 2019 & 2032
- Table 70: Global Nanorobotics Industry Revenue Million Forecast, by Application 2019 & 2032
- Table 71: Global Nanorobotics Industry Revenue Million Forecast, by Country 2019 & 2032
- Table 72: Latin America Nanorobotics Industry Revenue (Million) Forecast, by Application 2019 & 2032
- Table 73: Middle East and Africa Nanorobotics Industry Revenue (Million) Forecast, by Application 2019 & 2032
Frequently Asked Questions
1. What is the projected Compound Annual Growth Rate (CAGR) of the Nanorobotics Industry?
The projected CAGR is approximately 10.00%.
2. Which companies are prominent players in the Nanorobotics Industry?
Key companies in the market include EV Group, Zymergen Inc, Toronto Nano Instrumentation Inc , Thermo Fisher Scientific Inc, Ginkgo Bioworks Inc, Oxford Instruments, Imina Technologies SA, Synthace Limited, Illumina Inc, Nanoics Imaging Limited.
3. What are the main segments of the Nanorobotics Industry?
The market segments include Type of Manufacuturing, Application.
4. Can you provide details about the market size?
The market size is estimated to be USD XX Million as of 2022.
5. What are some drivers contributing to market growth?
; Increasing Investment in Technology by Governments and Universities; Growing Demand for Advanced Medical Treatments.
6. What are the notable trends driving market growth?
Drug Delivery Application is Expected to Witness Significant Growth Rate.
7. Are there any restraints impacting market growth?
; High Manufacturing and Development Costs.
8. Can you provide examples of recent developments in the market?
N/A
9. What pricing options are available for accessing the report?
Pricing options include single-user, multi-user, and enterprise licenses priced at USD 4750, USD 5250, and USD 8750 respectively.
10. Is the market size provided in terms of value or volume?
The market size is provided in terms of value, measured in Million.
11. Are there any specific market keywords associated with the report?
Yes, the market keyword associated with the report is "Nanorobotics Industry," which aids in identifying and referencing the specific market segment covered.
12. How do I determine which pricing option suits my needs best?
The pricing options vary based on user requirements and access needs. Individual users may opt for single-user licenses, while businesses requiring broader access may choose multi-user or enterprise licenses for cost-effective access to the report.
13. Are there any additional resources or data provided in the Nanorobotics Industry report?
While the report offers comprehensive insights, it's advisable to review the specific contents or supplementary materials provided to ascertain if additional resources or data are available.
14. How can I stay updated on further developments or reports in the Nanorobotics Industry?
To stay informed about further developments, trends, and reports in the Nanorobotics Industry, consider subscribing to industry newsletters, following relevant companies and organizations, or regularly checking reputable industry news sources and publications.
Methodology
Step 1 - Identification of Relevant Samples Size from Population Database


Step 2 - Approaches for Defining Global Market Size (Value, Volume* & Price*)

Note*: In applicable scenarios
Step 3 - Data Sources
Primary Research
- Web Analytics
- Survey Reports
- Research Institute
- Latest Research Reports
- Opinion Leaders
Secondary Research
- Annual Reports
- White Paper
- Latest Press Release
- Industry Association
- Paid Database
- Investor Presentations

Step 4 - Data Triangulation
Involves using different sources of information in order to increase the validity of a study
These sources are likely to be stakeholders in a program - participants, other researchers, program staff, other community members, and so on.
Then we put all data in single framework & apply various statistical tools to find out the dynamic on the market.
During the analysis stage, feedback from the stakeholder groups would be compared to determine areas of agreement as well as areas of divergence


