
Key Insights
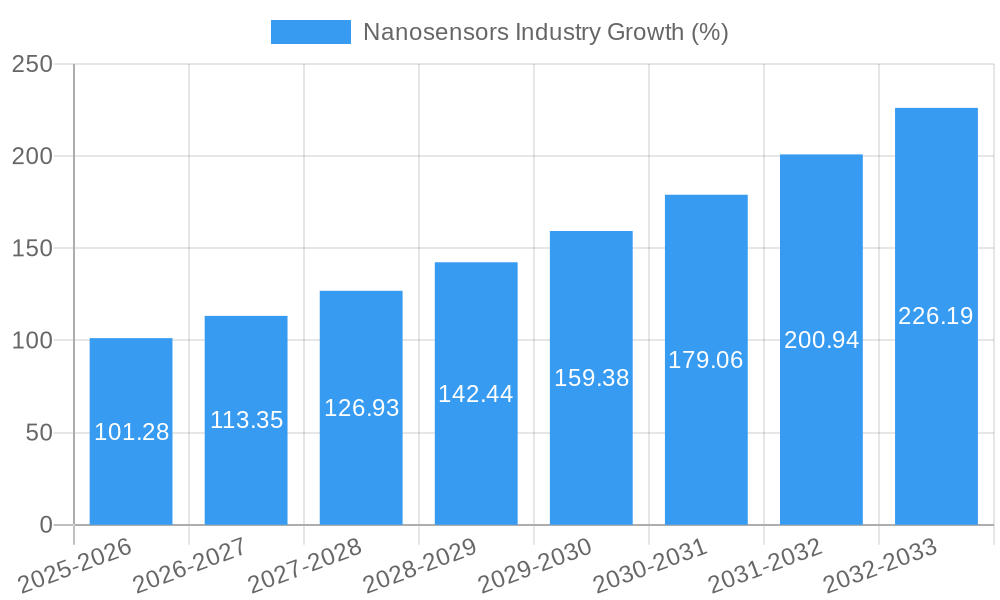
The global nanosensors market, valued at $0.88 billion in 2025, is poised for significant growth, exhibiting a Compound Annual Growth Rate (CAGR) of 11.35% from 2025 to 2033. This robust expansion is driven by several key factors. Firstly, the increasing demand for miniaturization and high-performance sensing across diverse sectors like healthcare (diagnostic tools, drug delivery systems), automotive (advanced driver-assistance systems, emission monitoring), and environmental monitoring is fueling market growth. Technological advancements leading to improved sensitivity, selectivity, and cost-effectiveness of nanosensors are also contributing to market expansion. Furthermore, growing research and development activities focused on novel nanosensor materials and fabrication techniques are further accelerating market growth. The healthcare sector, in particular, is expected to witness substantial growth, propelled by the rising prevalence of chronic diseases and the need for early and precise diagnostics.
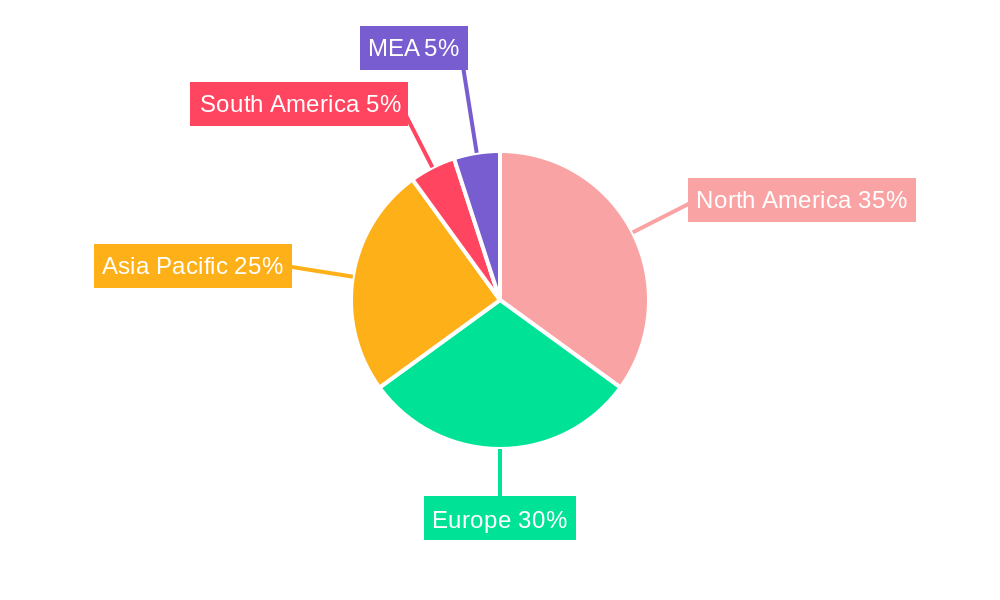
The market segmentation reveals strong growth potential across various types of nanosensors, including biological, chemical, and physical nanosensors. Similarly, end-use verticals show significant opportunities, with aerospace and defense, automotive and industrial, and consumer electronics sectors exhibiting high demand. Geographical analysis suggests North America and Europe currently hold the largest market shares, driven by established technological infrastructure and strong regulatory frameworks. However, the Asia-Pacific region is expected to witness the fastest growth rate owing to increasing investments in research and development, coupled with rising industrialization and technological adoption. While certain restraints exist, including high manufacturing costs and regulatory complexities associated with novel nanomaterials, the overall market outlook remains positive, projecting substantial growth throughout the forecast period.

Nanosensors Industry Market Report: 2019-2033
This comprehensive report provides an in-depth analysis of the global nanosensors industry, covering market size, growth projections, key players, and emerging trends from 2019 to 2033. The report offers actionable insights for stakeholders, investors, and industry professionals seeking to understand and capitalize on the dynamic nanosensors market. The study period spans from 2019 to 2033, with 2025 as the base and estimated year. The forecast period is 2025-2033, and the historical period is 2019-2024. The global market value in 2025 is estimated at $xx Million.
Nanosensors Industry Market Concentration & Innovation
The nanosensors industry exhibits a moderately concentrated market structure, with several major players holding significant market share. However, the landscape is dynamic due to continuous innovation and new entrants. Market share data for 2025 reveals that the top 5 companies account for approximately xx% of the global revenue, with Samsung Electronics co Limited and Agilent Technologies Inc holding the largest shares at xx% and xx%, respectively. Smaller companies and startups, such as Inanon Bio Inc and Nanowear Inc, are driving innovation, particularly in specialized segments like healthcare and wearable technology. The average M&A deal value in the industry during 2022-2024 was approximately $xx Million.
- Innovation Drivers: Miniaturization, advancements in nanomaterials (e.g., carbon nanotubes, graphene), and integration with AI and machine learning are major drivers.
- Regulatory Frameworks: Regulations vary across regions, influencing product development and commercialization. FDA approvals, especially for medical nanosensors, are crucial.
- Product Substitutes: Traditional sensors pose a competitive threat, but nanosensors offer advantages in sensitivity, size, and cost-effectiveness in specific applications.
- End-User Trends: The growing demand for miniaturized, high-performance sensors across diverse sectors is fueling growth. Focus on IoT applications is driving growth in the consumer electronics segment.
- M&A Activities: Strategic acquisitions are reshaping the market, with larger companies acquiring smaller innovators to expand their product portfolios and technological capabilities.
Nanosensors Industry Industry Trends & Insights
The global nanosensors market is experiencing significant growth, driven by technological advancements and increasing demand across diverse sectors. The compound annual growth rate (CAGR) is projected to be xx% during the forecast period (2025-2033), reaching an estimated $xx Million by 2033. Market penetration is highest in the healthcare sector, with increasing adoption of nanosensors in diagnostic tools and wearable health monitors. Significant technological disruptions include the integration of AI and Machine Learning which enhances data analytics and diagnostic capabilities. Consumer preferences are shifting towards minimally invasive and personalized healthcare solutions, further boosting demand for wearable nanosensors. Intense competition among established players and innovative startups is driving innovation and price reductions.
Dominant Markets & Segments in Nanosensors Industry
The healthcare segment dominates the nanosensors market, driven by the increasing prevalence of chronic diseases and the demand for advanced diagnostic tools and personalized medicine. The North American region leads globally, followed by Europe and Asia Pacific.
By Type:
- Biological Nanosensors: The largest segment, driven by applications in medical diagnostics and drug delivery.
- Chemical Nanosensors: Strong growth due to environmental monitoring and industrial process control needs.
- Physical Nanosensors: Growth driven by advancements in material science and applications in aerospace and defense.
By End-use Verticals:
- Healthcare: Highest market share due to the widespread adoption of nanosensors in medical diagnostics, drug delivery, and therapeutic applications. Key drivers include the rising prevalence of chronic diseases, the need for early disease detection, and advancements in personalized medicine.
- Automotive & Industrial: Significant growth driven by the increasing demand for precise sensing in industrial automation and automotive safety systems.
- Consumer Electronics: Driven by the growing popularity of wearable technology and smart devices.
Key Drivers (by region):
- North America: Strong government funding for R&D, advanced healthcare infrastructure, and early adoption of innovative technologies.
- Europe: Focus on environmental monitoring and regulations, coupled with significant government support for nanotechnology research.
- Asia Pacific: Rapid economic growth, increasing disposable incomes, and a large and growing healthcare market.
Nanosensors Industry Product Developments
Recent product innovations include advanced nanosensors for early disease detection, wearable health monitors, and environmental monitoring. These advancements leverage nanomaterials with enhanced sensitivity and selectivity, alongside integration with AI and machine learning algorithms for improved data analysis and diagnostic accuracy. The key competitive advantage lies in superior sensitivity, miniaturization, and cost-effectiveness compared to traditional sensor technologies, providing a strong market fit across various sectors.
Report Scope & Segmentation Analysis
This report segments the nanosensors market by type (biological, chemical, physical) and end-use vertical (aerospace & defense, automotive & industrial, consumer electronics, healthcare, power generation, other). Each segment’s growth is analyzed, considering factors like market size, CAGR, and competitive dynamics. For instance, the biological nanosensors segment is expected to experience a high CAGR due to the rapid advancements in medical diagnostics. Similarly, the healthcare sector shows strong growth potential driven by the increasing demand for personalized medicine.
Key Drivers of Nanosensors Industry Growth
The nanosensors industry’s growth is driven by:
- Technological advancements: Improved sensitivity, miniaturization, and integration with AI and ML are boosting capabilities and applications.
- Economic factors: Increasing disposable income and R&D investment are facilitating growth.
- Regulatory support: Government initiatives promoting nanotechnology research and development.
Challenges in the Nanosensors Industry Sector
Challenges include:
- Regulatory hurdles: Stringent regulations for medical and environmental applications can slow down adoption.
- Supply chain issues: The complex manufacturing process can lead to supply chain disruptions.
- Competitive pressures: The industry is experiencing intense competition among established and emerging players.
Emerging Opportunities in Nanosensors Industry
- New markets: Expanding into emerging economies and untapped applications offers significant potential.
- Technological advancements: Exploring novel nanomaterials and fabrication techniques.
- Consumer preferences: Catering to the growing demand for personalized healthcare and environmental monitoring solutions.
Leading Players in the Nanosensors Industry Market
- Inanon Bio Inc
- Applied Nanotech Inc (PEN Inc)
- Beijing ALT Technology Ltd Co
- Applied Nanodetectors Ltd
- AerBetic
- Nanowear Inc
- Nanoworld AG
- GBS Inc
- Samsung Electronics co Limited
- Agilent Technologies Inc
- BreathDX Ltd
- Oxonica Limited
- Vista Therapeutics Inc
- Bruker Corporation
- LamdaGen Corporation
Key Developments in Nanosensors Industry Industry
- Feb 2024: Fraunhofer IMS and Ruhr University Bochum developed a novel signal amplification process for diagnostic tests using luminescent single-walled carbon nanotubes. This significantly improves sensitivity, speed, and cost-effectiveness of bioanalytical tests, impacting the biological nanosensors market.
- Jan 2024: Nanowear Inc received FDA 510(k) clearance for its SimpleSense platform, a non-invasive, continuous blood pressure monitor. This is a major development in the healthcare sector, impacting the wearable diagnostics market.
- Feb 2023: Researchers developed the first nanosensor to detect and distinguish gibberellins in plants, opening new possibilities for precision agriculture.
- June 2022: LiveMetric's LiveOne wearable blood pressure monitor received FDA clearance, providing a cost-effective alternative to traditional methods.
- June 2022: Karolinska Institute developed a nanosensor for pesticide detection on fruit, improving food safety.
- May 2022: Johns Hopkins University created a highly precise COVID-19 sensor, addressing limitations of existing testing methods. This development significantly impacted the market for rapid diagnostics.
Strategic Outlook for Nanosensors Industry Market
The nanosensors industry is poised for continued growth, driven by ongoing technological advancements and expanding applications. The convergence of nanotechnology, AI, and machine learning will further enhance the capabilities of nanosensors, leading to wider adoption across various sectors. New market opportunities lie in the development of personalized medicine, improved environmental monitoring, advanced industrial automation, and the proliferation of IoT-enabled devices. The market’s future potential is significant, with continued expansion across different applications and geographic regions.
Nanosensors Industry Segmentation
-
1. Type
- 1.1. Biological Nanosensors
- 1.2. Chemical Nanosensors
- 1.3. Physical Nanosensors
-
2. End-use Verticals
- 2.1. Aerospace and Defense
- 2.2. Automotive and Industrial
- 2.3. Consumer Electronics
- 2.4. Healthcare
- 2.5. Power Generation
- 2.6. Other End-use Verticals
Nanosensors Industry Segmentation By Geography
- 1. North America
- 2. Europe
- 3. Asia Pacific
- 4. Latin America
- 5. Middle East
Nanosensors Industry REPORT HIGHLIGHTS
| Aspects | Details |
|---|---|
| Study Period | 2019-2033 |
| Base Year | 2024 |
| Estimated Year | 2025 |
| Forecast Period | 2025-2033 |
| Historical Period | 2019-2024 |
| Growth Rate | CAGR of 11.35% from 2019-2033 |
| Segmentation |
|
Table of Contents
- 1. Introduction
- 1.1. Research Scope
- 1.2. Market Segmentation
- 1.3. Research Methodology
- 1.4. Definitions and Assumptions
- 2. Executive Summary
- 2.1. Introduction
- 3. Market Dynamics
- 3.1. Introduction
- 3.2. Market Drivers
- 3.2.1. Rising Miniaturization trend and Use of Miniaturized Products
- 3.3. Market Restrains
- 3.3.1. High Installation and Maintenance Costs
- 3.4. Market Trends
- 3.4.1. Healthcare Industry to Show Significant Growth
- 4. Market Factor Analysis
- 4.1. Porters Five Forces
- 4.2. Supply/Value Chain
- 4.3. PESTEL analysis
- 4.4. Market Entropy
- 4.5. Patent/Trademark Analysis
- 5. Global Nanosensors Industry Analysis, Insights and Forecast, 2019-2031
- 5.1. Market Analysis, Insights and Forecast - by Type
- 5.1.1. Biological Nanosensors
- 5.1.2. Chemical Nanosensors
- 5.1.3. Physical Nanosensors
- 5.2. Market Analysis, Insights and Forecast - by End-use Verticals
- 5.2.1. Aerospace and Defense
- 5.2.2. Automotive and Industrial
- 5.2.3. Consumer Electronics
- 5.2.4. Healthcare
- 5.2.5. Power Generation
- 5.2.6. Other End-use Verticals
- 5.3. Market Analysis, Insights and Forecast - by Region
- 5.3.1. North America
- 5.3.2. Europe
- 5.3.3. Asia Pacific
- 5.3.4. Latin America
- 5.3.5. Middle East
- 5.1. Market Analysis, Insights and Forecast - by Type
- 6. North America Nanosensors Industry Analysis, Insights and Forecast, 2019-2031
- 6.1. Market Analysis, Insights and Forecast - by Type
- 6.1.1. Biological Nanosensors
- 6.1.2. Chemical Nanosensors
- 6.1.3. Physical Nanosensors
- 6.2. Market Analysis, Insights and Forecast - by End-use Verticals
- 6.2.1. Aerospace and Defense
- 6.2.2. Automotive and Industrial
- 6.2.3. Consumer Electronics
- 6.2.4. Healthcare
- 6.2.5. Power Generation
- 6.2.6. Other End-use Verticals
- 6.1. Market Analysis, Insights and Forecast - by Type
- 7. Europe Nanosensors Industry Analysis, Insights and Forecast, 2019-2031
- 7.1. Market Analysis, Insights and Forecast - by Type
- 7.1.1. Biological Nanosensors
- 7.1.2. Chemical Nanosensors
- 7.1.3. Physical Nanosensors
- 7.2. Market Analysis, Insights and Forecast - by End-use Verticals
- 7.2.1. Aerospace and Defense
- 7.2.2. Automotive and Industrial
- 7.2.3. Consumer Electronics
- 7.2.4. Healthcare
- 7.2.5. Power Generation
- 7.2.6. Other End-use Verticals
- 7.1. Market Analysis, Insights and Forecast - by Type
- 8. Asia Pacific Nanosensors Industry Analysis, Insights and Forecast, 2019-2031
- 8.1. Market Analysis, Insights and Forecast - by Type
- 8.1.1. Biological Nanosensors
- 8.1.2. Chemical Nanosensors
- 8.1.3. Physical Nanosensors
- 8.2. Market Analysis, Insights and Forecast - by End-use Verticals
- 8.2.1. Aerospace and Defense
- 8.2.2. Automotive and Industrial
- 8.2.3. Consumer Electronics
- 8.2.4. Healthcare
- 8.2.5. Power Generation
- 8.2.6. Other End-use Verticals
- 8.1. Market Analysis, Insights and Forecast - by Type
- 9. Latin America Nanosensors Industry Analysis, Insights and Forecast, 2019-2031
- 9.1. Market Analysis, Insights and Forecast - by Type
- 9.1.1. Biological Nanosensors
- 9.1.2. Chemical Nanosensors
- 9.1.3. Physical Nanosensors
- 9.2. Market Analysis, Insights and Forecast - by End-use Verticals
- 9.2.1. Aerospace and Defense
- 9.2.2. Automotive and Industrial
- 9.2.3. Consumer Electronics
- 9.2.4. Healthcare
- 9.2.5. Power Generation
- 9.2.6. Other End-use Verticals
- 9.1. Market Analysis, Insights and Forecast - by Type
- 10. Middle East Nanosensors Industry Analysis, Insights and Forecast, 2019-2031
- 10.1. Market Analysis, Insights and Forecast - by Type
- 10.1.1. Biological Nanosensors
- 10.1.2. Chemical Nanosensors
- 10.1.3. Physical Nanosensors
- 10.2. Market Analysis, Insights and Forecast - by End-use Verticals
- 10.2.1. Aerospace and Defense
- 10.2.2. Automotive and Industrial
- 10.2.3. Consumer Electronics
- 10.2.4. Healthcare
- 10.2.5. Power Generation
- 10.2.6. Other End-use Verticals
- 10.1. Market Analysis, Insights and Forecast - by Type
- 11. North America Nanosensors Industry Analysis, Insights and Forecast, 2019-2031
- 11.1. Market Analysis, Insights and Forecast - By Country/Sub-region
- 11.1.1 United States
- 11.1.2 Canada
- 11.1.3 Mexico
- 12. Europe Nanosensors Industry Analysis, Insights and Forecast, 2019-2031
- 12.1. Market Analysis, Insights and Forecast - By Country/Sub-region
- 12.1.1 Germany
- 12.1.2 United Kingdom
- 12.1.3 France
- 12.1.4 Spain
- 12.1.5 Italy
- 12.1.6 Spain
- 12.1.7 Belgium
- 12.1.8 Netherland
- 12.1.9 Nordics
- 12.1.10 Rest of Europe
- 13. Asia Pacific Nanosensors Industry Analysis, Insights and Forecast, 2019-2031
- 13.1. Market Analysis, Insights and Forecast - By Country/Sub-region
- 13.1.1 China
- 13.1.2 Japan
- 13.1.3 India
- 13.1.4 South Korea
- 13.1.5 Southeast Asia
- 13.1.6 Australia
- 13.1.7 Indonesia
- 13.1.8 Phillipes
- 13.1.9 Singapore
- 13.1.10 Thailandc
- 13.1.11 Rest of Asia Pacific
- 14. South America Nanosensors Industry Analysis, Insights and Forecast, 2019-2031
- 14.1. Market Analysis, Insights and Forecast - By Country/Sub-region
- 14.1.1 Brazil
- 14.1.2 Argentina
- 14.1.3 Peru
- 14.1.4 Chile
- 14.1.5 Colombia
- 14.1.6 Ecuador
- 14.1.7 Venezuela
- 14.1.8 Rest of South America
- 15. North America Nanosensors Industry Analysis, Insights and Forecast, 2019-2031
- 15.1. Market Analysis, Insights and Forecast - By Country/Sub-region
- 15.1.1 United States
- 15.1.2 Canada
- 15.1.3 Mexico
- 16. MEA Nanosensors Industry Analysis, Insights and Forecast, 2019-2031
- 16.1. Market Analysis, Insights and Forecast - By Country/Sub-region
- 16.1.1 United Arab Emirates
- 16.1.2 Saudi Arabia
- 16.1.3 South Africa
- 16.1.4 Rest of Middle East and Africa
- 17. Competitive Analysis
- 17.1. Global Market Share Analysis 2024
- 17.2. Company Profiles
- 17.2.1 Inanon Bio Inc
- 17.2.1.1. Overview
- 17.2.1.2. Products
- 17.2.1.3. SWOT Analysis
- 17.2.1.4. Recent Developments
- 17.2.1.5. Financials (Based on Availability)
- 17.2.2 Applied Nanotech Inc (PEN Inc )
- 17.2.2.1. Overview
- 17.2.2.2. Products
- 17.2.2.3. SWOT Analysis
- 17.2.2.4. Recent Developments
- 17.2.2.5. Financials (Based on Availability)
- 17.2.3 Beijing ALT Technology Ltd Co
- 17.2.3.1. Overview
- 17.2.3.2. Products
- 17.2.3.3. SWOT Analysis
- 17.2.3.4. Recent Developments
- 17.2.3.5. Financials (Based on Availability)
- 17.2.4 Applied Nanodetectors Ltd
- 17.2.4.1. Overview
- 17.2.4.2. Products
- 17.2.4.3. SWOT Analysis
- 17.2.4.4. Recent Developments
- 17.2.4.5. Financials (Based on Availability)
- 17.2.5 AerBetic
- 17.2.5.1. Overview
- 17.2.5.2. Products
- 17.2.5.3. SWOT Analysis
- 17.2.5.4. Recent Developments
- 17.2.5.5. Financials (Based on Availability)
- 17.2.6 Nanowear Inc
- 17.2.6.1. Overview
- 17.2.6.2. Products
- 17.2.6.3. SWOT Analysis
- 17.2.6.4. Recent Developments
- 17.2.6.5. Financials (Based on Availability)
- 17.2.7 Nanoworld AG
- 17.2.7.1. Overview
- 17.2.7.2. Products
- 17.2.7.3. SWOT Analysis
- 17.2.7.4. Recent Developments
- 17.2.7.5. Financials (Based on Availability)
- 17.2.8 GBS Inc
- 17.2.8.1. Overview
- 17.2.8.2. Products
- 17.2.8.3. SWOT Analysis
- 17.2.8.4. Recent Developments
- 17.2.8.5. Financials (Based on Availability)
- 17.2.9 Samsung Electronics co Limited
- 17.2.9.1. Overview
- 17.2.9.2. Products
- 17.2.9.3. SWOT Analysis
- 17.2.9.4. Recent Developments
- 17.2.9.5. Financials (Based on Availability)
- 17.2.10 Agilent Technologies Inc
- 17.2.10.1. Overview
- 17.2.10.2. Products
- 17.2.10.3. SWOT Analysis
- 17.2.10.4. Recent Developments
- 17.2.10.5. Financials (Based on Availability)
- 17.2.11 BreathDX Ltd
- 17.2.11.1. Overview
- 17.2.11.2. Products
- 17.2.11.3. SWOT Analysis
- 17.2.11.4. Recent Developments
- 17.2.11.5. Financials (Based on Availability)
- 17.2.12 Oxonica Limited
- 17.2.12.1. Overview
- 17.2.12.2. Products
- 17.2.12.3. SWOT Analysis
- 17.2.12.4. Recent Developments
- 17.2.12.5. Financials (Based on Availability)
- 17.2.13 Vista Therapeutics Inc
- 17.2.13.1. Overview
- 17.2.13.2. Products
- 17.2.13.3. SWOT Analysis
- 17.2.13.4. Recent Developments
- 17.2.13.5. Financials (Based on Availability)
- 17.2.14 Bruker Corporation
- 17.2.14.1. Overview
- 17.2.14.2. Products
- 17.2.14.3. SWOT Analysis
- 17.2.14.4. Recent Developments
- 17.2.14.5. Financials (Based on Availability)
- 17.2.15 LamdaGen Corporation
- 17.2.15.1. Overview
- 17.2.15.2. Products
- 17.2.15.3. SWOT Analysis
- 17.2.15.4. Recent Developments
- 17.2.15.5. Financials (Based on Availability)
- 17.2.1 Inanon Bio Inc
List of Figures
- Figure 1: Global Nanosensors Industry Revenue Breakdown (Million, %) by Region 2024 & 2032
- Figure 2: Global Nanosensors Industry Volume Breakdown (K Unit, %) by Region 2024 & 2032
- Figure 3: North America Nanosensors Industry Revenue (Million), by Country 2024 & 2032
- Figure 4: North America Nanosensors Industry Volume (K Unit), by Country 2024 & 2032
- Figure 5: North America Nanosensors Industry Revenue Share (%), by Country 2024 & 2032
- Figure 6: North America Nanosensors Industry Volume Share (%), by Country 2024 & 2032
- Figure 7: Europe Nanosensors Industry Revenue (Million), by Country 2024 & 2032
- Figure 8: Europe Nanosensors Industry Volume (K Unit), by Country 2024 & 2032
- Figure 9: Europe Nanosensors Industry Revenue Share (%), by Country 2024 & 2032
- Figure 10: Europe Nanosensors Industry Volume Share (%), by Country 2024 & 2032
- Figure 11: Asia Pacific Nanosensors Industry Revenue (Million), by Country 2024 & 2032
- Figure 12: Asia Pacific Nanosensors Industry Volume (K Unit), by Country 2024 & 2032
- Figure 13: Asia Pacific Nanosensors Industry Revenue Share (%), by Country 2024 & 2032
- Figure 14: Asia Pacific Nanosensors Industry Volume Share (%), by Country 2024 & 2032
- Figure 15: South America Nanosensors Industry Revenue (Million), by Country 2024 & 2032
- Figure 16: South America Nanosensors Industry Volume (K Unit), by Country 2024 & 2032
- Figure 17: South America Nanosensors Industry Revenue Share (%), by Country 2024 & 2032
- Figure 18: South America Nanosensors Industry Volume Share (%), by Country 2024 & 2032
- Figure 19: North America Nanosensors Industry Revenue (Million), by Country 2024 & 2032
- Figure 20: North America Nanosensors Industry Volume (K Unit), by Country 2024 & 2032
- Figure 21: North America Nanosensors Industry Revenue Share (%), by Country 2024 & 2032
- Figure 22: North America Nanosensors Industry Volume Share (%), by Country 2024 & 2032
- Figure 23: MEA Nanosensors Industry Revenue (Million), by Country 2024 & 2032
- Figure 24: MEA Nanosensors Industry Volume (K Unit), by Country 2024 & 2032
- Figure 25: MEA Nanosensors Industry Revenue Share (%), by Country 2024 & 2032
- Figure 26: MEA Nanosensors Industry Volume Share (%), by Country 2024 & 2032
- Figure 27: North America Nanosensors Industry Revenue (Million), by Type 2024 & 2032
- Figure 28: North America Nanosensors Industry Volume (K Unit), by Type 2024 & 2032
- Figure 29: North America Nanosensors Industry Revenue Share (%), by Type 2024 & 2032
- Figure 30: North America Nanosensors Industry Volume Share (%), by Type 2024 & 2032
- Figure 31: North America Nanosensors Industry Revenue (Million), by End-use Verticals 2024 & 2032
- Figure 32: North America Nanosensors Industry Volume (K Unit), by End-use Verticals 2024 & 2032
- Figure 33: North America Nanosensors Industry Revenue Share (%), by End-use Verticals 2024 & 2032
- Figure 34: North America Nanosensors Industry Volume Share (%), by End-use Verticals 2024 & 2032
- Figure 35: North America Nanosensors Industry Revenue (Million), by Country 2024 & 2032
- Figure 36: North America Nanosensors Industry Volume (K Unit), by Country 2024 & 2032
- Figure 37: North America Nanosensors Industry Revenue Share (%), by Country 2024 & 2032
- Figure 38: North America Nanosensors Industry Volume Share (%), by Country 2024 & 2032
- Figure 39: Europe Nanosensors Industry Revenue (Million), by Type 2024 & 2032
- Figure 40: Europe Nanosensors Industry Volume (K Unit), by Type 2024 & 2032
- Figure 41: Europe Nanosensors Industry Revenue Share (%), by Type 2024 & 2032
- Figure 42: Europe Nanosensors Industry Volume Share (%), by Type 2024 & 2032
- Figure 43: Europe Nanosensors Industry Revenue (Million), by End-use Verticals 2024 & 2032
- Figure 44: Europe Nanosensors Industry Volume (K Unit), by End-use Verticals 2024 & 2032
- Figure 45: Europe Nanosensors Industry Revenue Share (%), by End-use Verticals 2024 & 2032
- Figure 46: Europe Nanosensors Industry Volume Share (%), by End-use Verticals 2024 & 2032
- Figure 47: Europe Nanosensors Industry Revenue (Million), by Country 2024 & 2032
- Figure 48: Europe Nanosensors Industry Volume (K Unit), by Country 2024 & 2032
- Figure 49: Europe Nanosensors Industry Revenue Share (%), by Country 2024 & 2032
- Figure 50: Europe Nanosensors Industry Volume Share (%), by Country 2024 & 2032
- Figure 51: Asia Pacific Nanosensors Industry Revenue (Million), by Type 2024 & 2032
- Figure 52: Asia Pacific Nanosensors Industry Volume (K Unit), by Type 2024 & 2032
- Figure 53: Asia Pacific Nanosensors Industry Revenue Share (%), by Type 2024 & 2032
- Figure 54: Asia Pacific Nanosensors Industry Volume Share (%), by Type 2024 & 2032
- Figure 55: Asia Pacific Nanosensors Industry Revenue (Million), by End-use Verticals 2024 & 2032
- Figure 56: Asia Pacific Nanosensors Industry Volume (K Unit), by End-use Verticals 2024 & 2032
- Figure 57: Asia Pacific Nanosensors Industry Revenue Share (%), by End-use Verticals 2024 & 2032
- Figure 58: Asia Pacific Nanosensors Industry Volume Share (%), by End-use Verticals 2024 & 2032
- Figure 59: Asia Pacific Nanosensors Industry Revenue (Million), by Country 2024 & 2032
- Figure 60: Asia Pacific Nanosensors Industry Volume (K Unit), by Country 2024 & 2032
- Figure 61: Asia Pacific Nanosensors Industry Revenue Share (%), by Country 2024 & 2032
- Figure 62: Asia Pacific Nanosensors Industry Volume Share (%), by Country 2024 & 2032
- Figure 63: Latin America Nanosensors Industry Revenue (Million), by Type 2024 & 2032
- Figure 64: Latin America Nanosensors Industry Volume (K Unit), by Type 2024 & 2032
- Figure 65: Latin America Nanosensors Industry Revenue Share (%), by Type 2024 & 2032
- Figure 66: Latin America Nanosensors Industry Volume Share (%), by Type 2024 & 2032
- Figure 67: Latin America Nanosensors Industry Revenue (Million), by End-use Verticals 2024 & 2032
- Figure 68: Latin America Nanosensors Industry Volume (K Unit), by End-use Verticals 2024 & 2032
- Figure 69: Latin America Nanosensors Industry Revenue Share (%), by End-use Verticals 2024 & 2032
- Figure 70: Latin America Nanosensors Industry Volume Share (%), by End-use Verticals 2024 & 2032
- Figure 71: Latin America Nanosensors Industry Revenue (Million), by Country 2024 & 2032
- Figure 72: Latin America Nanosensors Industry Volume (K Unit), by Country 2024 & 2032
- Figure 73: Latin America Nanosensors Industry Revenue Share (%), by Country 2024 & 2032
- Figure 74: Latin America Nanosensors Industry Volume Share (%), by Country 2024 & 2032
- Figure 75: Middle East Nanosensors Industry Revenue (Million), by Type 2024 & 2032
- Figure 76: Middle East Nanosensors Industry Volume (K Unit), by Type 2024 & 2032
- Figure 77: Middle East Nanosensors Industry Revenue Share (%), by Type 2024 & 2032
- Figure 78: Middle East Nanosensors Industry Volume Share (%), by Type 2024 & 2032
- Figure 79: Middle East Nanosensors Industry Revenue (Million), by End-use Verticals 2024 & 2032
- Figure 80: Middle East Nanosensors Industry Volume (K Unit), by End-use Verticals 2024 & 2032
- Figure 81: Middle East Nanosensors Industry Revenue Share (%), by End-use Verticals 2024 & 2032
- Figure 82: Middle East Nanosensors Industry Volume Share (%), by End-use Verticals 2024 & 2032
- Figure 83: Middle East Nanosensors Industry Revenue (Million), by Country 2024 & 2032
- Figure 84: Middle East Nanosensors Industry Volume (K Unit), by Country 2024 & 2032
- Figure 85: Middle East Nanosensors Industry Revenue Share (%), by Country 2024 & 2032
- Figure 86: Middle East Nanosensors Industry Volume Share (%), by Country 2024 & 2032
List of Tables
- Table 1: Global Nanosensors Industry Revenue Million Forecast, by Region 2019 & 2032
- Table 2: Global Nanosensors Industry Volume K Unit Forecast, by Region 2019 & 2032
- Table 3: Global Nanosensors Industry Revenue Million Forecast, by Type 2019 & 2032
- Table 4: Global Nanosensors Industry Volume K Unit Forecast, by Type 2019 & 2032
- Table 5: Global Nanosensors Industry Revenue Million Forecast, by End-use Verticals 2019 & 2032
- Table 6: Global Nanosensors Industry Volume K Unit Forecast, by End-use Verticals 2019 & 2032
- Table 7: Global Nanosensors Industry Revenue Million Forecast, by Region 2019 & 2032
- Table 8: Global Nanosensors Industry Volume K Unit Forecast, by Region 2019 & 2032
- Table 9: Global Nanosensors Industry Revenue Million Forecast, by Country 2019 & 2032
- Table 10: Global Nanosensors Industry Volume K Unit Forecast, by Country 2019 & 2032
- Table 11: United States Nanosensors Industry Revenue (Million) Forecast, by Application 2019 & 2032
- Table 12: United States Nanosensors Industry Volume (K Unit) Forecast, by Application 2019 & 2032
- Table 13: Canada Nanosensors Industry Revenue (Million) Forecast, by Application 2019 & 2032
- Table 14: Canada Nanosensors Industry Volume (K Unit) Forecast, by Application 2019 & 2032
- Table 15: Mexico Nanosensors Industry Revenue (Million) Forecast, by Application 2019 & 2032
- Table 16: Mexico Nanosensors Industry Volume (K Unit) Forecast, by Application 2019 & 2032
- Table 17: Global Nanosensors Industry Revenue Million Forecast, by Country 2019 & 2032
- Table 18: Global Nanosensors Industry Volume K Unit Forecast, by Country 2019 & 2032
- Table 19: Germany Nanosensors Industry Revenue (Million) Forecast, by Application 2019 & 2032
- Table 20: Germany Nanosensors Industry Volume (K Unit) Forecast, by Application 2019 & 2032
- Table 21: United Kingdom Nanosensors Industry Revenue (Million) Forecast, by Application 2019 & 2032
- Table 22: United Kingdom Nanosensors Industry Volume (K Unit) Forecast, by Application 2019 & 2032
- Table 23: France Nanosensors Industry Revenue (Million) Forecast, by Application 2019 & 2032
- Table 24: France Nanosensors Industry Volume (K Unit) Forecast, by Application 2019 & 2032
- Table 25: Spain Nanosensors Industry Revenue (Million) Forecast, by Application 2019 & 2032
- Table 26: Spain Nanosensors Industry Volume (K Unit) Forecast, by Application 2019 & 2032
- Table 27: Italy Nanosensors Industry Revenue (Million) Forecast, by Application 2019 & 2032
- Table 28: Italy Nanosensors Industry Volume (K Unit) Forecast, by Application 2019 & 2032
- Table 29: Spain Nanosensors Industry Revenue (Million) Forecast, by Application 2019 & 2032
- Table 30: Spain Nanosensors Industry Volume (K Unit) Forecast, by Application 2019 & 2032
- Table 31: Belgium Nanosensors Industry Revenue (Million) Forecast, by Application 2019 & 2032
- Table 32: Belgium Nanosensors Industry Volume (K Unit) Forecast, by Application 2019 & 2032
- Table 33: Netherland Nanosensors Industry Revenue (Million) Forecast, by Application 2019 & 2032
- Table 34: Netherland Nanosensors Industry Volume (K Unit) Forecast, by Application 2019 & 2032
- Table 35: Nordics Nanosensors Industry Revenue (Million) Forecast, by Application 2019 & 2032
- Table 36: Nordics Nanosensors Industry Volume (K Unit) Forecast, by Application 2019 & 2032
- Table 37: Rest of Europe Nanosensors Industry Revenue (Million) Forecast, by Application 2019 & 2032
- Table 38: Rest of Europe Nanosensors Industry Volume (K Unit) Forecast, by Application 2019 & 2032
- Table 39: Global Nanosensors Industry Revenue Million Forecast, by Country 2019 & 2032
- Table 40: Global Nanosensors Industry Volume K Unit Forecast, by Country 2019 & 2032
- Table 41: China Nanosensors Industry Revenue (Million) Forecast, by Application 2019 & 2032
- Table 42: China Nanosensors Industry Volume (K Unit) Forecast, by Application 2019 & 2032
- Table 43: Japan Nanosensors Industry Revenue (Million) Forecast, by Application 2019 & 2032
- Table 44: Japan Nanosensors Industry Volume (K Unit) Forecast, by Application 2019 & 2032
- Table 45: India Nanosensors Industry Revenue (Million) Forecast, by Application 2019 & 2032
- Table 46: India Nanosensors Industry Volume (K Unit) Forecast, by Application 2019 & 2032
- Table 47: South Korea Nanosensors Industry Revenue (Million) Forecast, by Application 2019 & 2032
- Table 48: South Korea Nanosensors Industry Volume (K Unit) Forecast, by Application 2019 & 2032
- Table 49: Southeast Asia Nanosensors Industry Revenue (Million) Forecast, by Application 2019 & 2032
- Table 50: Southeast Asia Nanosensors Industry Volume (K Unit) Forecast, by Application 2019 & 2032
- Table 51: Australia Nanosensors Industry Revenue (Million) Forecast, by Application 2019 & 2032
- Table 52: Australia Nanosensors Industry Volume (K Unit) Forecast, by Application 2019 & 2032
- Table 53: Indonesia Nanosensors Industry Revenue (Million) Forecast, by Application 2019 & 2032
- Table 54: Indonesia Nanosensors Industry Volume (K Unit) Forecast, by Application 2019 & 2032
- Table 55: Phillipes Nanosensors Industry Revenue (Million) Forecast, by Application 2019 & 2032
- Table 56: Phillipes Nanosensors Industry Volume (K Unit) Forecast, by Application 2019 & 2032
- Table 57: Singapore Nanosensors Industry Revenue (Million) Forecast, by Application 2019 & 2032
- Table 58: Singapore Nanosensors Industry Volume (K Unit) Forecast, by Application 2019 & 2032
- Table 59: Thailandc Nanosensors Industry Revenue (Million) Forecast, by Application 2019 & 2032
- Table 60: Thailandc Nanosensors Industry Volume (K Unit) Forecast, by Application 2019 & 2032
- Table 61: Rest of Asia Pacific Nanosensors Industry Revenue (Million) Forecast, by Application 2019 & 2032
- Table 62: Rest of Asia Pacific Nanosensors Industry Volume (K Unit) Forecast, by Application 2019 & 2032
- Table 63: Global Nanosensors Industry Revenue Million Forecast, by Country 2019 & 2032
- Table 64: Global Nanosensors Industry Volume K Unit Forecast, by Country 2019 & 2032
- Table 65: Brazil Nanosensors Industry Revenue (Million) Forecast, by Application 2019 & 2032
- Table 66: Brazil Nanosensors Industry Volume (K Unit) Forecast, by Application 2019 & 2032
- Table 67: Argentina Nanosensors Industry Revenue (Million) Forecast, by Application 2019 & 2032
- Table 68: Argentina Nanosensors Industry Volume (K Unit) Forecast, by Application 2019 & 2032
- Table 69: Peru Nanosensors Industry Revenue (Million) Forecast, by Application 2019 & 2032
- Table 70: Peru Nanosensors Industry Volume (K Unit) Forecast, by Application 2019 & 2032
- Table 71: Chile Nanosensors Industry Revenue (Million) Forecast, by Application 2019 & 2032
- Table 72: Chile Nanosensors Industry Volume (K Unit) Forecast, by Application 2019 & 2032
- Table 73: Colombia Nanosensors Industry Revenue (Million) Forecast, by Application 2019 & 2032
- Table 74: Colombia Nanosensors Industry Volume (K Unit) Forecast, by Application 2019 & 2032
- Table 75: Ecuador Nanosensors Industry Revenue (Million) Forecast, by Application 2019 & 2032
- Table 76: Ecuador Nanosensors Industry Volume (K Unit) Forecast, by Application 2019 & 2032
- Table 77: Venezuela Nanosensors Industry Revenue (Million) Forecast, by Application 2019 & 2032
- Table 78: Venezuela Nanosensors Industry Volume (K Unit) Forecast, by Application 2019 & 2032
- Table 79: Rest of South America Nanosensors Industry Revenue (Million) Forecast, by Application 2019 & 2032
- Table 80: Rest of South America Nanosensors Industry Volume (K Unit) Forecast, by Application 2019 & 2032
- Table 81: Global Nanosensors Industry Revenue Million Forecast, by Country 2019 & 2032
- Table 82: Global Nanosensors Industry Volume K Unit Forecast, by Country 2019 & 2032
- Table 83: United States Nanosensors Industry Revenue (Million) Forecast, by Application 2019 & 2032
- Table 84: United States Nanosensors Industry Volume (K Unit) Forecast, by Application 2019 & 2032
- Table 85: Canada Nanosensors Industry Revenue (Million) Forecast, by Application 2019 & 2032
- Table 86: Canada Nanosensors Industry Volume (K Unit) Forecast, by Application 2019 & 2032
- Table 87: Mexico Nanosensors Industry Revenue (Million) Forecast, by Application 2019 & 2032
- Table 88: Mexico Nanosensors Industry Volume (K Unit) Forecast, by Application 2019 & 2032
- Table 89: Global Nanosensors Industry Revenue Million Forecast, by Country 2019 & 2032
- Table 90: Global Nanosensors Industry Volume K Unit Forecast, by Country 2019 & 2032
- Table 91: United Arab Emirates Nanosensors Industry Revenue (Million) Forecast, by Application 2019 & 2032
- Table 92: United Arab Emirates Nanosensors Industry Volume (K Unit) Forecast, by Application 2019 & 2032
- Table 93: Saudi Arabia Nanosensors Industry Revenue (Million) Forecast, by Application 2019 & 2032
- Table 94: Saudi Arabia Nanosensors Industry Volume (K Unit) Forecast, by Application 2019 & 2032
- Table 95: South Africa Nanosensors Industry Revenue (Million) Forecast, by Application 2019 & 2032
- Table 96: South Africa Nanosensors Industry Volume (K Unit) Forecast, by Application 2019 & 2032
- Table 97: Rest of Middle East and Africa Nanosensors Industry Revenue (Million) Forecast, by Application 2019 & 2032
- Table 98: Rest of Middle East and Africa Nanosensors Industry Volume (K Unit) Forecast, by Application 2019 & 2032
- Table 99: Global Nanosensors Industry Revenue Million Forecast, by Type 2019 & 2032
- Table 100: Global Nanosensors Industry Volume K Unit Forecast, by Type 2019 & 2032
- Table 101: Global Nanosensors Industry Revenue Million Forecast, by End-use Verticals 2019 & 2032
- Table 102: Global Nanosensors Industry Volume K Unit Forecast, by End-use Verticals 2019 & 2032
- Table 103: Global Nanosensors Industry Revenue Million Forecast, by Country 2019 & 2032
- Table 104: Global Nanosensors Industry Volume K Unit Forecast, by Country 2019 & 2032
- Table 105: Global Nanosensors Industry Revenue Million Forecast, by Type 2019 & 2032
- Table 106: Global Nanosensors Industry Volume K Unit Forecast, by Type 2019 & 2032
- Table 107: Global Nanosensors Industry Revenue Million Forecast, by End-use Verticals 2019 & 2032
- Table 108: Global Nanosensors Industry Volume K Unit Forecast, by End-use Verticals 2019 & 2032
- Table 109: Global Nanosensors Industry Revenue Million Forecast, by Country 2019 & 2032
- Table 110: Global Nanosensors Industry Volume K Unit Forecast, by Country 2019 & 2032
- Table 111: Global Nanosensors Industry Revenue Million Forecast, by Type 2019 & 2032
- Table 112: Global Nanosensors Industry Volume K Unit Forecast, by Type 2019 & 2032
- Table 113: Global Nanosensors Industry Revenue Million Forecast, by End-use Verticals 2019 & 2032
- Table 114: Global Nanosensors Industry Volume K Unit Forecast, by End-use Verticals 2019 & 2032
- Table 115: Global Nanosensors Industry Revenue Million Forecast, by Country 2019 & 2032
- Table 116: Global Nanosensors Industry Volume K Unit Forecast, by Country 2019 & 2032
- Table 117: Global Nanosensors Industry Revenue Million Forecast, by Type 2019 & 2032
- Table 118: Global Nanosensors Industry Volume K Unit Forecast, by Type 2019 & 2032
- Table 119: Global Nanosensors Industry Revenue Million Forecast, by End-use Verticals 2019 & 2032
- Table 120: Global Nanosensors Industry Volume K Unit Forecast, by End-use Verticals 2019 & 2032
- Table 121: Global Nanosensors Industry Revenue Million Forecast, by Country 2019 & 2032
- Table 122: Global Nanosensors Industry Volume K Unit Forecast, by Country 2019 & 2032
- Table 123: Global Nanosensors Industry Revenue Million Forecast, by Type 2019 & 2032
- Table 124: Global Nanosensors Industry Volume K Unit Forecast, by Type 2019 & 2032
- Table 125: Global Nanosensors Industry Revenue Million Forecast, by End-use Verticals 2019 & 2032
- Table 126: Global Nanosensors Industry Volume K Unit Forecast, by End-use Verticals 2019 & 2032
- Table 127: Global Nanosensors Industry Revenue Million Forecast, by Country 2019 & 2032
- Table 128: Global Nanosensors Industry Volume K Unit Forecast, by Country 2019 & 2032
Frequently Asked Questions
1. What is the projected Compound Annual Growth Rate (CAGR) of the Nanosensors Industry?
The projected CAGR is approximately 11.35%.
2. Which companies are prominent players in the Nanosensors Industry?
Key companies in the market include Inanon Bio Inc, Applied Nanotech Inc (PEN Inc ), Beijing ALT Technology Ltd Co, Applied Nanodetectors Ltd, AerBetic, Nanowear Inc, Nanoworld AG, GBS Inc, Samsung Electronics co Limited, Agilent Technologies Inc, BreathDX Ltd, Oxonica Limited, Vista Therapeutics Inc, Bruker Corporation, LamdaGen Corporation.
3. What are the main segments of the Nanosensors Industry?
The market segments include Type, End-use Verticals.
4. Can you provide details about the market size?
The market size is estimated to be USD 0.88 Million as of 2022.
5. What are some drivers contributing to market growth?
Rising Miniaturization trend and Use of Miniaturized Products.
6. What are the notable trends driving market growth?
Healthcare Industry to Show Significant Growth.
7. Are there any restraints impacting market growth?
High Installation and Maintenance Costs.
8. Can you provide examples of recent developments in the market?
Feb 2024: The Fraunhofer Institute for Microelectronic Circuits and Systems IMS and Ruhr University Bochum, Germany, developed a process that enables a new form of signal amplification for diagnostic tests. Through the advanced use of luminescent single walled carbon nanotubes in bioanalytics, test procedures can be carried out more sensitively, quickly and cheaply.
9. What pricing options are available for accessing the report?
Pricing options include single-user, multi-user, and enterprise licenses priced at USD 4750, USD 5250, and USD 8750 respectively.
10. Is the market size provided in terms of value or volume?
The market size is provided in terms of value, measured in Million and volume, measured in K Unit.
11. Are there any specific market keywords associated with the report?
Yes, the market keyword associated with the report is "Nanosensors Industry," which aids in identifying and referencing the specific market segment covered.
12. How do I determine which pricing option suits my needs best?
The pricing options vary based on user requirements and access needs. Individual users may opt for single-user licenses, while businesses requiring broader access may choose multi-user or enterprise licenses for cost-effective access to the report.
13. Are there any additional resources or data provided in the Nanosensors Industry report?
While the report offers comprehensive insights, it's advisable to review the specific contents or supplementary materials provided to ascertain if additional resources or data are available.
14. How can I stay updated on further developments or reports in the Nanosensors Industry?
To stay informed about further developments, trends, and reports in the Nanosensors Industry, consider subscribing to industry newsletters, following relevant companies and organizations, or regularly checking reputable industry news sources and publications.
Methodology
Step 1 - Identification of Relevant Samples Size from Population Database


Step 2 - Approaches for Defining Global Market Size (Value, Volume* & Price*)

Note*: In applicable scenarios
Step 3 - Data Sources
Primary Research
- Web Analytics
- Survey Reports
- Research Institute
- Latest Research Reports
- Opinion Leaders
Secondary Research
- Annual Reports
- White Paper
- Latest Press Release
- Industry Association
- Paid Database
- Investor Presentations

Step 4 - Data Triangulation
Involves using different sources of information in order to increase the validity of a study
These sources are likely to be stakeholders in a program - participants, other researchers, program staff, other community members, and so on.
Then we put all data in single framework & apply various statistical tools to find out the dynamic on the market.
During the analysis stage, feedback from the stakeholder groups would be compared to determine areas of agreement as well as areas of divergence


