
Key Insights
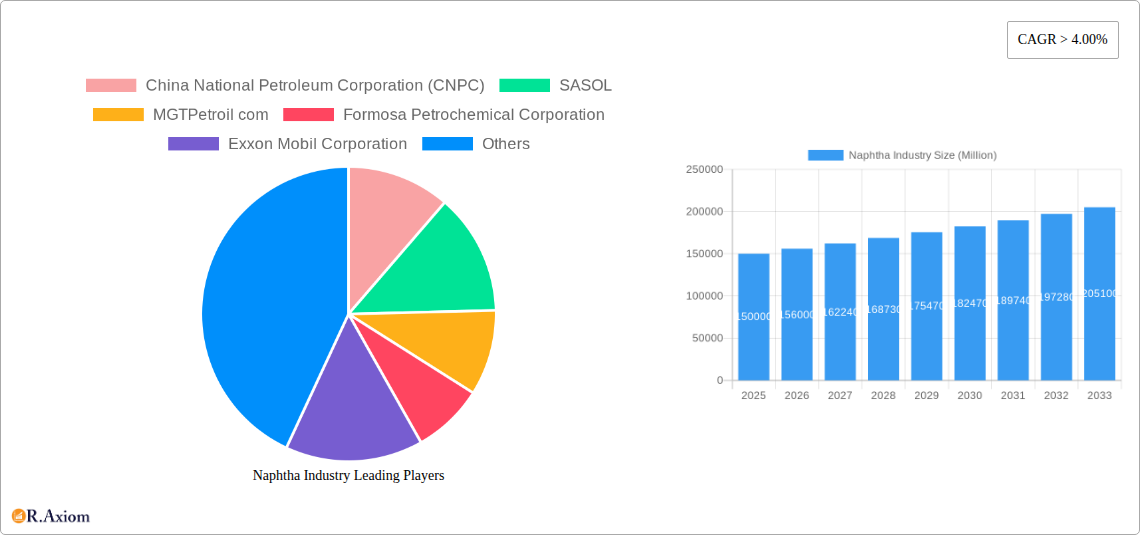
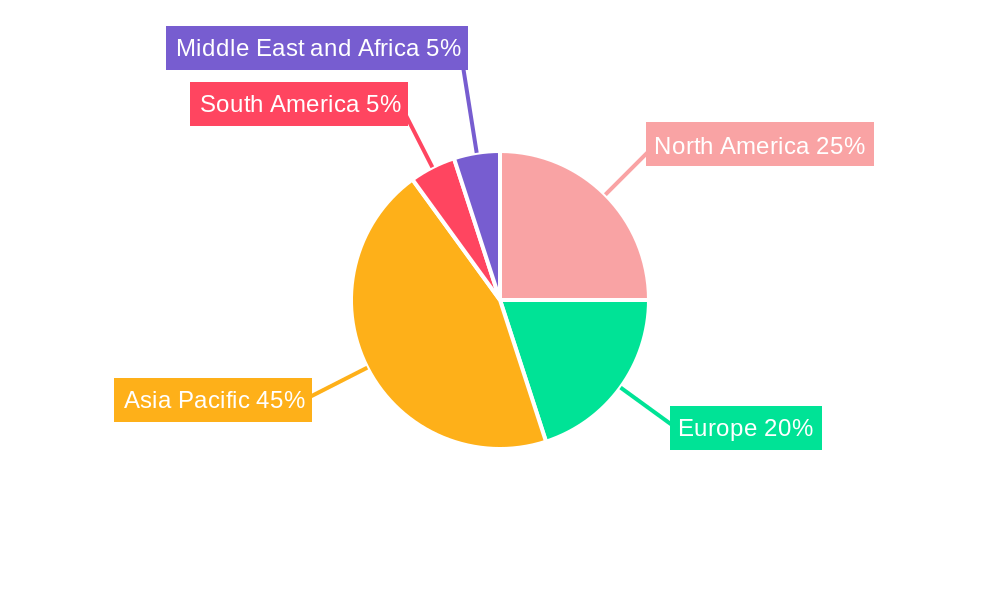
The global naphtha market is experiencing robust growth, projected to maintain a Compound Annual Growth Rate (CAGR) exceeding 4% from 2025 to 2033. This expansion is fueled by several key drivers. The burgeoning petrochemical industry's reliance on naphtha as a primary feedstock for producing ethylene, propylene, and other essential petrochemicals is a significant factor. Furthermore, increasing demand from the agricultural sector for fertilizers and the paints and coatings industry for solvents contributes significantly to market growth. The aerospace industry’s use of naphtha in certain applications also adds to the demand. However, market growth faces some restraints, including price volatility linked to crude oil prices and environmental concerns surrounding naphtha's carbon footprint. Efforts towards sustainable production and the development of alternative feedstocks are shaping the industry's trajectory. Competition among major players, including China National Petroleum Corporation (CNPC), SASOL, ExxonMobil, and Reliance Industries, is fierce, driving innovation and efficiency improvements. Geographic distribution of market share shows a concentration in Asia Pacific, particularly China and India, driven by their rapid industrialization and expanding petrochemical sectors. North America and Europe also represent substantial markets, though their growth rates may be somewhat slower than Asia Pacific's. Future growth will likely hinge on technological advancements, sustainable practices, and the evolving global energy landscape.
The segmentation of the naphtha market reveals interesting dynamics. Light naphtha, with its higher value applications in petrochemicals, commands a larger market share compared to heavy naphtha. Among end-use industries, the petrochemical sector dominates, accounting for a substantial portion of global naphtha consumption. However, the agriculture and paints and coatings sectors are also contributing significantly to overall demand. The market's regional disparity reflects the varying levels of industrial development and energy consumption across different regions. While Asia-Pacific leads in overall consumption, the North American and European markets continue to be substantial contributors, showcasing strong regional preferences and industry-specific demands. The forecast period highlights a continuing, although potentially moderating, growth trajectory, influenced by ongoing global economic conditions and environmental regulations. Strategic investments in refining capacity and the development of cleaner production methods will play a pivotal role in shaping the future of the naphtha market.
Naphtha Industry: A Comprehensive Market Report (2019-2033)
This comprehensive report provides an in-depth analysis of the global naphtha industry, covering market size, segmentation, key players, growth drivers, challenges, and future outlook from 2019 to 2033. The report leverages extensive primary and secondary research, offering actionable insights for industry stakeholders, investors, and businesses operating within the naphtha value chain. The study period spans 2019-2033, with 2025 as the base and estimated year. The forecast period is 2025-2033, and the historical period covers 2019-2024.
Naphtha Industry Market Concentration & Innovation
This section analyzes the competitive landscape of the naphtha industry, focusing on market concentration, innovation drivers, regulatory aspects, and mergers & acquisitions (M&A) activity. The global naphtha market exhibits a moderately concentrated structure, with a few major players holding significant market share. However, regional variations exist, with some markets displaying higher levels of fragmentation.
- Market Share: While precise figures require proprietary data, estimates suggest that the top 10 players account for approximately xx% of the global market share in 2025. China National Petroleum Corporation (CNPC), Saudi Aramco, and ExxonMobil are expected to be among the leading players.
- Innovation Drivers: The industry's innovation is driven by the increasing demand for high-value petrochemicals and the need for sustainable production processes. R&D investments focus on improving process efficiency, reducing emissions, and developing new naphtha-based products.
- Regulatory Frameworks: Government regulations concerning emissions, safety, and environmental protection significantly impact the industry. Variations in these regulations across different countries and regions create opportunities and challenges for companies.
- Product Substitutes: The availability of alternative feedstocks for petrochemical production, such as natural gas liquids (NGLs), presents a competitive challenge to naphtha. However, naphtha's established position and versatility continue to maintain its importance.
- End-User Trends: The growth of the petrochemical industry, particularly in Asia, is a key driver for naphtha demand. Shifting consumer preferences towards lightweight and durable materials also fuel demand.
- M&A Activity: The naphtha industry has witnessed significant M&A activity in recent years, with deal values totaling in the billions of dollars. These transactions reflect consolidation efforts and strategic expansions within the industry. For example, xx M&A deals were recorded between 2019 and 2024, with an estimated total value of xx Million.
Naphtha Industry Industry Trends & Insights
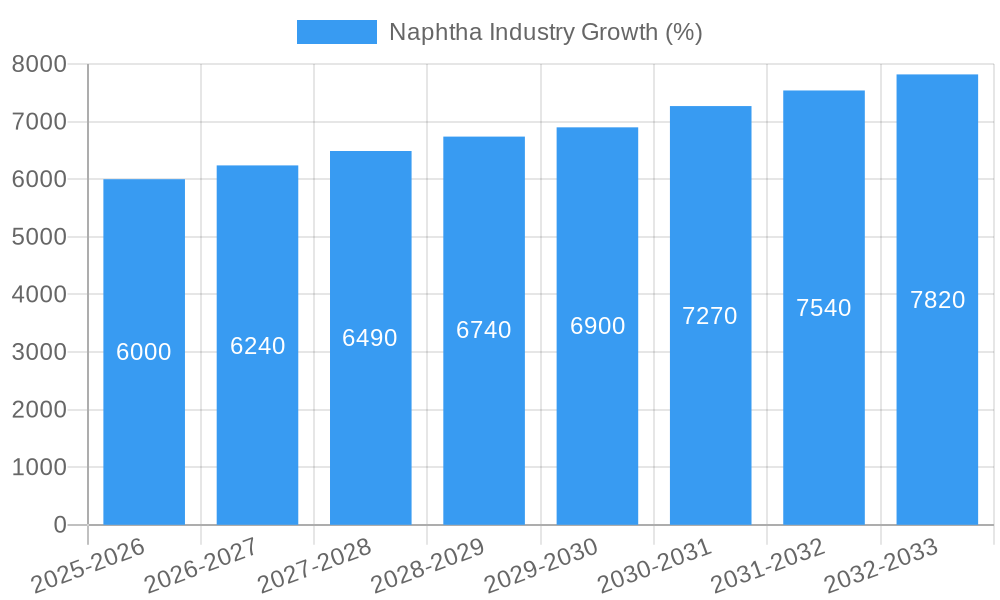
The global naphtha market is projected to experience substantial growth during the forecast period (2025-2033), driven by increasing demand from various end-use sectors. The compound annual growth rate (CAGR) is estimated to be xx% during this period. Several factors contribute to this growth trajectory:
- Rising demand for petrochemicals, particularly plastics and synthetic fibers, in developing economies, especially in Asia.
- Technological advancements leading to improved efficiency in naphtha cracking and processing.
- Growing adoption of naphtha in specialty chemical applications.
- Increasing investment in new naphtha-based production facilities.
- Fluctuations in crude oil prices directly impacting naphtha prices and, consequently, market dynamics.
- The introduction of new, more efficient refining technologies, enabling better utilization of crude oil feedstocks and optimizing naphtha yields.
- Government policies that promote industrial development and the adoption of advanced materials in various sectors.
- Shifts in consumer preferences toward convenience and durability, which influences demand for products made using naphtha-derived chemicals.
- Increased competition from alternative feedstocks, requiring the naphtha industry to continuously adapt and innovate.
Dominant Markets & Segments in Naphtha Industry
The Asia-Pacific region, particularly China and India, dominates the global naphtha market, driven by strong economic growth and rapid industrialization.
By Type:
- Light Naphtha: This segment holds a larger market share due to its wider application in petrochemicals. Growth is driven by the expanding petrochemical industry and rising demand for plastics and synthetic fibers.
- Heavy Naphtha: This segment finds applications in solvents, fuel blending and other specialized industries. The growth rate is comparatively slower than light naphtha.
By End-user Industry:
- Petrochemical: This segment accounts for the largest share of naphtha consumption due to its essential role in producing various petrochemical intermediates. Growth is strongly correlated with the overall growth of the petrochemical industry.
- Agriculture: Naphtha is used in the production of fertilizers and pesticides. Growth is influenced by agricultural output and policies supporting agricultural enhancement.
- Paints and Coatings: Naphtha is a solvent in the production of paints and coatings. Market growth is related to construction and infrastructure development.
- Aerospace: Naphtha has niche applications in the aerospace sector, though its contribution to overall naphtha consumption is relatively minor.
- Other End-user Industries: This segment comprises various smaller applications of naphtha, such as in the rubber and pharmaceutical industries.
Key Drivers for Dominant Regions:
- Asia-Pacific: Rapid industrialization, growing population, rising disposable incomes, and favorable government policies promoting industrial growth are key drivers.
- North America: Strong petrochemical infrastructure and existing production capacity contribute to its significant role, though growth rates are relatively more moderate compared to Asia.
- Middle East: Abundant crude oil resources create a cost advantage, underpinning its position within the global naphtha market.
Naphtha Industry Product Developments
Recent product innovations have focused on improving the efficiency of naphtha processing and expanding its applications in specialty chemicals. New catalysts and processes are being developed to enhance the yield of valuable petrochemicals from naphtha, while research into sustainable and environmentally friendly naphtha-based products is gaining momentum. The development of bio-based naphtha alternatives is an emerging area of research with significant long-term implications for industry sustainability.
Report Scope & Segmentation Analysis
This report segments the naphtha market by type (Light Naphtha, Heavy Naphtha) and by end-user industry (Petrochemical, Agriculture, Paints and Coatings, Aerospace, Other End-user Industries). Each segment is analyzed in detail, including market size, growth projections, and competitive dynamics. Growth projections vary across segments and regions reflecting the diverse demands of end-user industries and technological advancements in production methods. The competitive landscape is also dynamic, characterized by both established and emerging players vying for market share within each niche.
Key Drivers of Naphtha Industry Growth
The growth of the naphtha industry is primarily driven by:
- Growing Demand for Petrochemicals: The burgeoning global demand for plastics, synthetic fibers, and other petrochemicals fuels naphtha consumption.
- Economic Growth in Developing Countries: Rapid industrialization and economic growth in developing nations increase the demand for naphtha-derived products.
- Technological Advancements: Innovations in naphtha cracking and processing technologies improve efficiency and yield.
Challenges in the Naphtha Industry Sector
The naphtha industry faces several challenges, including:
- Fluctuations in Crude Oil Prices: Crude oil price volatility significantly impacts naphtha prices and profitability.
- Environmental Regulations: Stricter environmental regulations require companies to invest in cleaner production technologies.
- Competition from Alternative Feedstocks: The availability of alternative feedstocks for petrochemical production poses a competitive threat. This leads to companies seeking improved efficiency and cost reductions to remain competitive.
Emerging Opportunities in Naphtha Industry
Emerging opportunities for the naphtha industry include:
- Growth in Specialty Chemicals: Increasing demand for specialty chemicals and high-value products opens up new market avenues for naphtha.
- Development of Bio-based Naphtha Alternatives: Research into sustainable and renewable naphtha substitutes presents a significant long-term growth opportunity.
- Expansion into New Markets: Untapped markets in developing economies present considerable potential for naphtha producers.
Leading Players in the Naphtha Industry Market
- China National Petroleum Corporation (CNPC)
- SASOL
- MGTPetroil com
- Formosa Petrochemical Corporation
- Exxon Mobil Corporation
- Chevron Phillips Chemical Company LLC
- Reliance Industries Limited
- PetroChina Company Limited
- AMOC (Alexandria Mineral Oils Co )
- SABIC
- Petroleos Mexicanos
- Saudi Arabian Oil Co (Saudi Aramco)
- LG Chem
- Royal Dutch Shell PLC
- BP PLC
- China Petroleum & Chemical Corporation (SINOPEC)
Key Developments in Naphtha Industry Industry
- November 2021: Exxon Mobil announced an investment in a multi-billion-dollar chemical complex in Guangdong province in southern China, enhancing its production capacity by 1.6 Million tonnes/year. This expansion signifies a commitment to the growing Asian market and strengthens ExxonMobil's position within the region.
- October 2022: LG Chem shut down its naphtha crackers in South Korea for maintenance for seven weeks, impacting the regional supply of petrochemicals. This highlights the potential for supply disruptions due to planned and unplanned maintenance activities within the industry.
Strategic Outlook for Naphtha Industry Market
The naphtha industry is poised for continued growth, driven by the persistent demand for petrochemicals and the ongoing expansion of the global economy. Emerging technologies and a focus on sustainable practices will shape the future of the industry. Companies that successfully adapt to changing market dynamics, invest in R&D, and implement efficient production processes will capture significant market share in the years to come. The focus on sustainability will be key to long-term success, demanding innovation in production processes and product development to reduce the environmental impact.
Naphtha Industry Segmentation
-
1. Type
- 1.1. Light Naphtha
- 1.2. Heavy Naptha
-
2. End-user Industry
- 2.1. Petrochemical
- 2.2. Agriculture
- 2.3. Paints and Coatings
- 2.4. Aerospace
- 2.5. Other End-user Industries
Naphtha Industry Segmentation By Geography
-
1. Asia Pacific
- 1.1. China
- 1.2. India
- 1.3. Japan
- 1.4. South Korea
- 1.5. Rest of Asia Pacific
-
2. North America
- 2.1. United States
- 2.2. Canada
- 2.3. Mexico
-
3. Europe
- 3.1. Germany
- 3.2. United Kingdom
- 3.3. Italy
- 3.4. France
- 3.5. Rest of Europe
-
4. South America
- 4.1. Brazil
- 4.2. Argentina
- 4.3. Rest of South America
-
5. Middle East and Africa
- 5.1. Saudi Arabia
- 5.2. South Africa
- 5.3. Rest of Middle East and Africa
Naphtha Industry REPORT HIGHLIGHTS
| Aspects | Details |
|---|---|
| Study Period | 2019-2033 |
| Base Year | 2024 |
| Estimated Year | 2025 |
| Forecast Period | 2025-2033 |
| Historical Period | 2019-2024 |
| Growth Rate | CAGR of > 4.00% from 2019-2033 |
| Segmentation |
|
Table of Contents
- 1. Introduction
- 1.1. Research Scope
- 1.2. Market Segmentation
- 1.3. Research Methodology
- 1.4. Definitions and Assumptions
- 2. Executive Summary
- 2.1. Introduction
- 3. Market Dynamics
- 3.1. Introduction
- 3.2. Market Drivers
- 3.2.1. Increasing Demand for Petrochemicals in Asia Pacific; Rising Demand for Fertilizers in India
- 3.3. Market Restrains
- 3.3.1. Natural Gas Liquid Demand in the United States
- 3.4. Market Trends
- 3.4.1. Rising Demand from Petrochemical Industry
- 4. Market Factor Analysis
- 4.1. Porters Five Forces
- 4.2. Supply/Value Chain
- 4.3. PESTEL analysis
- 4.4. Market Entropy
- 4.5. Patent/Trademark Analysis
- 5. Global Naphtha Industry Analysis, Insights and Forecast, 2019-2031
- 5.1. Market Analysis, Insights and Forecast - by Type
- 5.1.1. Light Naphtha
- 5.1.2. Heavy Naptha
- 5.2. Market Analysis, Insights and Forecast - by End-user Industry
- 5.2.1. Petrochemical
- 5.2.2. Agriculture
- 5.2.3. Paints and Coatings
- 5.2.4. Aerospace
- 5.2.5. Other End-user Industries
- 5.3. Market Analysis, Insights and Forecast - by Region
- 5.3.1. Asia Pacific
- 5.3.2. North America
- 5.3.3. Europe
- 5.3.4. South America
- 5.3.5. Middle East and Africa
- 5.1. Market Analysis, Insights and Forecast - by Type
- 6. Asia Pacific Naphtha Industry Analysis, Insights and Forecast, 2019-2031
- 6.1. Market Analysis, Insights and Forecast - by Type
- 6.1.1. Light Naphtha
- 6.1.2. Heavy Naptha
- 6.2. Market Analysis, Insights and Forecast - by End-user Industry
- 6.2.1. Petrochemical
- 6.2.2. Agriculture
- 6.2.3. Paints and Coatings
- 6.2.4. Aerospace
- 6.2.5. Other End-user Industries
- 6.1. Market Analysis, Insights and Forecast - by Type
- 7. North America Naphtha Industry Analysis, Insights and Forecast, 2019-2031
- 7.1. Market Analysis, Insights and Forecast - by Type
- 7.1.1. Light Naphtha
- 7.1.2. Heavy Naptha
- 7.2. Market Analysis, Insights and Forecast - by End-user Industry
- 7.2.1. Petrochemical
- 7.2.2. Agriculture
- 7.2.3. Paints and Coatings
- 7.2.4. Aerospace
- 7.2.5. Other End-user Industries
- 7.1. Market Analysis, Insights and Forecast - by Type
- 8. Europe Naphtha Industry Analysis, Insights and Forecast, 2019-2031
- 8.1. Market Analysis, Insights and Forecast - by Type
- 8.1.1. Light Naphtha
- 8.1.2. Heavy Naptha
- 8.2. Market Analysis, Insights and Forecast - by End-user Industry
- 8.2.1. Petrochemical
- 8.2.2. Agriculture
- 8.2.3. Paints and Coatings
- 8.2.4. Aerospace
- 8.2.5. Other End-user Industries
- 8.1. Market Analysis, Insights and Forecast - by Type
- 9. South America Naphtha Industry Analysis, Insights and Forecast, 2019-2031
- 9.1. Market Analysis, Insights and Forecast - by Type
- 9.1.1. Light Naphtha
- 9.1.2. Heavy Naptha
- 9.2. Market Analysis, Insights and Forecast - by End-user Industry
- 9.2.1. Petrochemical
- 9.2.2. Agriculture
- 9.2.3. Paints and Coatings
- 9.2.4. Aerospace
- 9.2.5. Other End-user Industries
- 9.1. Market Analysis, Insights and Forecast - by Type
- 10. Middle East and Africa Naphtha Industry Analysis, Insights and Forecast, 2019-2031
- 10.1. Market Analysis, Insights and Forecast - by Type
- 10.1.1. Light Naphtha
- 10.1.2. Heavy Naptha
- 10.2. Market Analysis, Insights and Forecast - by End-user Industry
- 10.2.1. Petrochemical
- 10.2.2. Agriculture
- 10.2.3. Paints and Coatings
- 10.2.4. Aerospace
- 10.2.5. Other End-user Industries
- 10.1. Market Analysis, Insights and Forecast - by Type
- 11. Asia Pacific Naphtha Industry Analysis, Insights and Forecast, 2019-2031
- 11.1. Market Analysis, Insights and Forecast - By Country/Sub-region
- 11.1.1 China
- 11.1.2 India
- 11.1.3 Japan
- 11.1.4 South Korea
- 11.1.5 Rest of Asia Pacific
- 12. North America Naphtha Industry Analysis, Insights and Forecast, 2019-2031
- 12.1. Market Analysis, Insights and Forecast - By Country/Sub-region
- 12.1.1 United States
- 12.1.2 Canada
- 12.1.3 Mexico
- 13. Europe Naphtha Industry Analysis, Insights and Forecast, 2019-2031
- 13.1. Market Analysis, Insights and Forecast - By Country/Sub-region
- 13.1.1 Germany
- 13.1.2 United Kingdom
- 13.1.3 Italy
- 13.1.4 France
- 13.1.5 Rest of Europe
- 14. South America Naphtha Industry Analysis, Insights and Forecast, 2019-2031
- 14.1. Market Analysis, Insights and Forecast - By Country/Sub-region
- 14.1.1 Brazil
- 14.1.2 Argentina
- 14.1.3 Rest of South America
- 15. Middle East and Africa Naphtha Industry Analysis, Insights and Forecast, 2019-2031
- 15.1. Market Analysis, Insights and Forecast - By Country/Sub-region
- 15.1.1 Saudi Arabia
- 15.1.2 South Africa
- 15.1.3 Rest of Middle East and Africa
- 16. Competitive Analysis
- 16.1. Global Market Share Analysis 2024
- 16.2. Company Profiles
- 16.2.1 China National Petroleum Corporation (CNPC)
- 16.2.1.1. Overview
- 16.2.1.2. Products
- 16.2.1.3. SWOT Analysis
- 16.2.1.4. Recent Developments
- 16.2.1.5. Financials (Based on Availability)
- 16.2.2 SASOL
- 16.2.2.1. Overview
- 16.2.2.2. Products
- 16.2.2.3. SWOT Analysis
- 16.2.2.4. Recent Developments
- 16.2.2.5. Financials (Based on Availability)
- 16.2.3 MGTPetroil com
- 16.2.3.1. Overview
- 16.2.3.2. Products
- 16.2.3.3. SWOT Analysis
- 16.2.3.4. Recent Developments
- 16.2.3.5. Financials (Based on Availability)
- 16.2.4 Formosa Petrochemical Corporation
- 16.2.4.1. Overview
- 16.2.4.2. Products
- 16.2.4.3. SWOT Analysis
- 16.2.4.4. Recent Developments
- 16.2.4.5. Financials (Based on Availability)
- 16.2.5 Exxon Mobil Corporation
- 16.2.5.1. Overview
- 16.2.5.2. Products
- 16.2.5.3. SWOT Analysis
- 16.2.5.4. Recent Developments
- 16.2.5.5. Financials (Based on Availability)
- 16.2.6 Chevron Phillips Chemical Company LLC
- 16.2.6.1. Overview
- 16.2.6.2. Products
- 16.2.6.3. SWOT Analysis
- 16.2.6.4. Recent Developments
- 16.2.6.5. Financials (Based on Availability)
- 16.2.7 Reliance Industries Limited
- 16.2.7.1. Overview
- 16.2.7.2. Products
- 16.2.7.3. SWOT Analysis
- 16.2.7.4. Recent Developments
- 16.2.7.5. Financials (Based on Availability)
- 16.2.8 PetroChina Company Limited
- 16.2.8.1. Overview
- 16.2.8.2. Products
- 16.2.8.3. SWOT Analysis
- 16.2.8.4. Recent Developments
- 16.2.8.5. Financials (Based on Availability)
- 16.2.9 AMOC (Alexandria Mineral Oils Co )
- 16.2.9.1. Overview
- 16.2.9.2. Products
- 16.2.9.3. SWOT Analysis
- 16.2.9.4. Recent Developments
- 16.2.9.5. Financials (Based on Availability)
- 16.2.10 SABIC
- 16.2.10.1. Overview
- 16.2.10.2. Products
- 16.2.10.3. SWOT Analysis
- 16.2.10.4. Recent Developments
- 16.2.10.5. Financials (Based on Availability)
- 16.2.11 Petroleos Mexicanos
- 16.2.11.1. Overview
- 16.2.11.2. Products
- 16.2.11.3. SWOT Analysis
- 16.2.11.4. Recent Developments
- 16.2.11.5. Financials (Based on Availability)
- 16.2.12 Saudi Arabian Oil Co (Saudi Aramco)*List Not Exhaustive
- 16.2.12.1. Overview
- 16.2.12.2. Products
- 16.2.12.3. SWOT Analysis
- 16.2.12.4. Recent Developments
- 16.2.12.5. Financials (Based on Availability)
- 16.2.13 LG Chem
- 16.2.13.1. Overview
- 16.2.13.2. Products
- 16.2.13.3. SWOT Analysis
- 16.2.13.4. Recent Developments
- 16.2.13.5. Financials (Based on Availability)
- 16.2.14 Royal Dutch Shell PLC
- 16.2.14.1. Overview
- 16.2.14.2. Products
- 16.2.14.3. SWOT Analysis
- 16.2.14.4. Recent Developments
- 16.2.14.5. Financials (Based on Availability)
- 16.2.15 BP PLC
- 16.2.15.1. Overview
- 16.2.15.2. Products
- 16.2.15.3. SWOT Analysis
- 16.2.15.4. Recent Developments
- 16.2.15.5. Financials (Based on Availability)
- 16.2.16 China Petroleum & Chemical Corporation (SINOPEC)
- 16.2.16.1. Overview
- 16.2.16.2. Products
- 16.2.16.3. SWOT Analysis
- 16.2.16.4. Recent Developments
- 16.2.16.5. Financials (Based on Availability)
- 16.2.1 China National Petroleum Corporation (CNPC)
List of Figures
- Figure 1: Global Naphtha Industry Revenue Breakdown (Million, %) by Region 2024 & 2032
- Figure 2: Asia Pacific Naphtha Industry Revenue (Million), by Country 2024 & 2032
- Figure 3: Asia Pacific Naphtha Industry Revenue Share (%), by Country 2024 & 2032
- Figure 4: North America Naphtha Industry Revenue (Million), by Country 2024 & 2032
- Figure 5: North America Naphtha Industry Revenue Share (%), by Country 2024 & 2032
- Figure 6: Europe Naphtha Industry Revenue (Million), by Country 2024 & 2032
- Figure 7: Europe Naphtha Industry Revenue Share (%), by Country 2024 & 2032
- Figure 8: South America Naphtha Industry Revenue (Million), by Country 2024 & 2032
- Figure 9: South America Naphtha Industry Revenue Share (%), by Country 2024 & 2032
- Figure 10: Middle East and Africa Naphtha Industry Revenue (Million), by Country 2024 & 2032
- Figure 11: Middle East and Africa Naphtha Industry Revenue Share (%), by Country 2024 & 2032
- Figure 12: Asia Pacific Naphtha Industry Revenue (Million), by Type 2024 & 2032
- Figure 13: Asia Pacific Naphtha Industry Revenue Share (%), by Type 2024 & 2032
- Figure 14: Asia Pacific Naphtha Industry Revenue (Million), by End-user Industry 2024 & 2032
- Figure 15: Asia Pacific Naphtha Industry Revenue Share (%), by End-user Industry 2024 & 2032
- Figure 16: Asia Pacific Naphtha Industry Revenue (Million), by Country 2024 & 2032
- Figure 17: Asia Pacific Naphtha Industry Revenue Share (%), by Country 2024 & 2032
- Figure 18: North America Naphtha Industry Revenue (Million), by Type 2024 & 2032
- Figure 19: North America Naphtha Industry Revenue Share (%), by Type 2024 & 2032
- Figure 20: North America Naphtha Industry Revenue (Million), by End-user Industry 2024 & 2032
- Figure 21: North America Naphtha Industry Revenue Share (%), by End-user Industry 2024 & 2032
- Figure 22: North America Naphtha Industry Revenue (Million), by Country 2024 & 2032
- Figure 23: North America Naphtha Industry Revenue Share (%), by Country 2024 & 2032
- Figure 24: Europe Naphtha Industry Revenue (Million), by Type 2024 & 2032
- Figure 25: Europe Naphtha Industry Revenue Share (%), by Type 2024 & 2032
- Figure 26: Europe Naphtha Industry Revenue (Million), by End-user Industry 2024 & 2032
- Figure 27: Europe Naphtha Industry Revenue Share (%), by End-user Industry 2024 & 2032
- Figure 28: Europe Naphtha Industry Revenue (Million), by Country 2024 & 2032
- Figure 29: Europe Naphtha Industry Revenue Share (%), by Country 2024 & 2032
- Figure 30: South America Naphtha Industry Revenue (Million), by Type 2024 & 2032
- Figure 31: South America Naphtha Industry Revenue Share (%), by Type 2024 & 2032
- Figure 32: South America Naphtha Industry Revenue (Million), by End-user Industry 2024 & 2032
- Figure 33: South America Naphtha Industry Revenue Share (%), by End-user Industry 2024 & 2032
- Figure 34: South America Naphtha Industry Revenue (Million), by Country 2024 & 2032
- Figure 35: South America Naphtha Industry Revenue Share (%), by Country 2024 & 2032
- Figure 36: Middle East and Africa Naphtha Industry Revenue (Million), by Type 2024 & 2032
- Figure 37: Middle East and Africa Naphtha Industry Revenue Share (%), by Type 2024 & 2032
- Figure 38: Middle East and Africa Naphtha Industry Revenue (Million), by End-user Industry 2024 & 2032
- Figure 39: Middle East and Africa Naphtha Industry Revenue Share (%), by End-user Industry 2024 & 2032
- Figure 40: Middle East and Africa Naphtha Industry Revenue (Million), by Country 2024 & 2032
- Figure 41: Middle East and Africa Naphtha Industry Revenue Share (%), by Country 2024 & 2032
List of Tables
- Table 1: Global Naphtha Industry Revenue Million Forecast, by Region 2019 & 2032
- Table 2: Global Naphtha Industry Revenue Million Forecast, by Type 2019 & 2032
- Table 3: Global Naphtha Industry Revenue Million Forecast, by End-user Industry 2019 & 2032
- Table 4: Global Naphtha Industry Revenue Million Forecast, by Region 2019 & 2032
- Table 5: Global Naphtha Industry Revenue Million Forecast, by Country 2019 & 2032
- Table 6: China Naphtha Industry Revenue (Million) Forecast, by Application 2019 & 2032
- Table 7: India Naphtha Industry Revenue (Million) Forecast, by Application 2019 & 2032
- Table 8: Japan Naphtha Industry Revenue (Million) Forecast, by Application 2019 & 2032
- Table 9: South Korea Naphtha Industry Revenue (Million) Forecast, by Application 2019 & 2032
- Table 10: Rest of Asia Pacific Naphtha Industry Revenue (Million) Forecast, by Application 2019 & 2032
- Table 11: Global Naphtha Industry Revenue Million Forecast, by Country 2019 & 2032
- Table 12: United States Naphtha Industry Revenue (Million) Forecast, by Application 2019 & 2032
- Table 13: Canada Naphtha Industry Revenue (Million) Forecast, by Application 2019 & 2032
- Table 14: Mexico Naphtha Industry Revenue (Million) Forecast, by Application 2019 & 2032
- Table 15: Global Naphtha Industry Revenue Million Forecast, by Country 2019 & 2032
- Table 16: Germany Naphtha Industry Revenue (Million) Forecast, by Application 2019 & 2032
- Table 17: United Kingdom Naphtha Industry Revenue (Million) Forecast, by Application 2019 & 2032
- Table 18: Italy Naphtha Industry Revenue (Million) Forecast, by Application 2019 & 2032
- Table 19: France Naphtha Industry Revenue (Million) Forecast, by Application 2019 & 2032
- Table 20: Rest of Europe Naphtha Industry Revenue (Million) Forecast, by Application 2019 & 2032
- Table 21: Global Naphtha Industry Revenue Million Forecast, by Country 2019 & 2032
- Table 22: Brazil Naphtha Industry Revenue (Million) Forecast, by Application 2019 & 2032
- Table 23: Argentina Naphtha Industry Revenue (Million) Forecast, by Application 2019 & 2032
- Table 24: Rest of South America Naphtha Industry Revenue (Million) Forecast, by Application 2019 & 2032
- Table 25: Global Naphtha Industry Revenue Million Forecast, by Country 2019 & 2032
- Table 26: Saudi Arabia Naphtha Industry Revenue (Million) Forecast, by Application 2019 & 2032
- Table 27: South Africa Naphtha Industry Revenue (Million) Forecast, by Application 2019 & 2032
- Table 28: Rest of Middle East and Africa Naphtha Industry Revenue (Million) Forecast, by Application 2019 & 2032
- Table 29: Global Naphtha Industry Revenue Million Forecast, by Type 2019 & 2032
- Table 30: Global Naphtha Industry Revenue Million Forecast, by End-user Industry 2019 & 2032
- Table 31: Global Naphtha Industry Revenue Million Forecast, by Country 2019 & 2032
- Table 32: China Naphtha Industry Revenue (Million) Forecast, by Application 2019 & 2032
- Table 33: India Naphtha Industry Revenue (Million) Forecast, by Application 2019 & 2032
- Table 34: Japan Naphtha Industry Revenue (Million) Forecast, by Application 2019 & 2032
- Table 35: South Korea Naphtha Industry Revenue (Million) Forecast, by Application 2019 & 2032
- Table 36: Rest of Asia Pacific Naphtha Industry Revenue (Million) Forecast, by Application 2019 & 2032
- Table 37: Global Naphtha Industry Revenue Million Forecast, by Type 2019 & 2032
- Table 38: Global Naphtha Industry Revenue Million Forecast, by End-user Industry 2019 & 2032
- Table 39: Global Naphtha Industry Revenue Million Forecast, by Country 2019 & 2032
- Table 40: United States Naphtha Industry Revenue (Million) Forecast, by Application 2019 & 2032
- Table 41: Canada Naphtha Industry Revenue (Million) Forecast, by Application 2019 & 2032
- Table 42: Mexico Naphtha Industry Revenue (Million) Forecast, by Application 2019 & 2032
- Table 43: Global Naphtha Industry Revenue Million Forecast, by Type 2019 & 2032
- Table 44: Global Naphtha Industry Revenue Million Forecast, by End-user Industry 2019 & 2032
- Table 45: Global Naphtha Industry Revenue Million Forecast, by Country 2019 & 2032
- Table 46: Germany Naphtha Industry Revenue (Million) Forecast, by Application 2019 & 2032
- Table 47: United Kingdom Naphtha Industry Revenue (Million) Forecast, by Application 2019 & 2032
- Table 48: Italy Naphtha Industry Revenue (Million) Forecast, by Application 2019 & 2032
- Table 49: France Naphtha Industry Revenue (Million) Forecast, by Application 2019 & 2032
- Table 50: Rest of Europe Naphtha Industry Revenue (Million) Forecast, by Application 2019 & 2032
- Table 51: Global Naphtha Industry Revenue Million Forecast, by Type 2019 & 2032
- Table 52: Global Naphtha Industry Revenue Million Forecast, by End-user Industry 2019 & 2032
- Table 53: Global Naphtha Industry Revenue Million Forecast, by Country 2019 & 2032
- Table 54: Brazil Naphtha Industry Revenue (Million) Forecast, by Application 2019 & 2032
- Table 55: Argentina Naphtha Industry Revenue (Million) Forecast, by Application 2019 & 2032
- Table 56: Rest of South America Naphtha Industry Revenue (Million) Forecast, by Application 2019 & 2032
- Table 57: Global Naphtha Industry Revenue Million Forecast, by Type 2019 & 2032
- Table 58: Global Naphtha Industry Revenue Million Forecast, by End-user Industry 2019 & 2032
- Table 59: Global Naphtha Industry Revenue Million Forecast, by Country 2019 & 2032
- Table 60: Saudi Arabia Naphtha Industry Revenue (Million) Forecast, by Application 2019 & 2032
- Table 61: South Africa Naphtha Industry Revenue (Million) Forecast, by Application 2019 & 2032
- Table 62: Rest of Middle East and Africa Naphtha Industry Revenue (Million) Forecast, by Application 2019 & 2032
Frequently Asked Questions
1. What is the projected Compound Annual Growth Rate (CAGR) of the Naphtha Industry?
The projected CAGR is approximately > 4.00%.
2. Which companies are prominent players in the Naphtha Industry?
Key companies in the market include China National Petroleum Corporation (CNPC), SASOL, MGTPetroil com, Formosa Petrochemical Corporation, Exxon Mobil Corporation, Chevron Phillips Chemical Company LLC, Reliance Industries Limited, PetroChina Company Limited, AMOC (Alexandria Mineral Oils Co ), SABIC, Petroleos Mexicanos, Saudi Arabian Oil Co (Saudi Aramco)*List Not Exhaustive, LG Chem, Royal Dutch Shell PLC, BP PLC, China Petroleum & Chemical Corporation (SINOPEC).
3. What are the main segments of the Naphtha Industry?
The market segments include Type, End-user Industry.
4. Can you provide details about the market size?
The market size is estimated to be USD XX Million as of 2022.
5. What are some drivers contributing to market growth?
Increasing Demand for Petrochemicals in Asia Pacific; Rising Demand for Fertilizers in India.
6. What are the notable trends driving market growth?
Rising Demand from Petrochemical Industry.
7. Are there any restraints impacting market growth?
Natural Gas Liquid Demand in the United States.
8. Can you provide examples of recent developments in the market?
October 2022: LG Chem shuts down its naphtha crackers in South Korea for maintenance for seven weeks. It will affect the supply of petrochemicals in the region during maintenance.
9. What pricing options are available for accessing the report?
Pricing options include single-user, multi-user, and enterprise licenses priced at USD 4750, USD 5250, and USD 8750 respectively.
10. Is the market size provided in terms of value or volume?
The market size is provided in terms of value, measured in Million.
11. Are there any specific market keywords associated with the report?
Yes, the market keyword associated with the report is "Naphtha Industry," which aids in identifying and referencing the specific market segment covered.
12. How do I determine which pricing option suits my needs best?
The pricing options vary based on user requirements and access needs. Individual users may opt for single-user licenses, while businesses requiring broader access may choose multi-user or enterprise licenses for cost-effective access to the report.
13. Are there any additional resources or data provided in the Naphtha Industry report?
While the report offers comprehensive insights, it's advisable to review the specific contents or supplementary materials provided to ascertain if additional resources or data are available.
14. How can I stay updated on further developments or reports in the Naphtha Industry?
To stay informed about further developments, trends, and reports in the Naphtha Industry, consider subscribing to industry newsletters, following relevant companies and organizations, or regularly checking reputable industry news sources and publications.
Methodology
Step 1 - Identification of Relevant Samples Size from Population Database


Step 2 - Approaches for Defining Global Market Size (Value, Volume* & Price*)

Note*: In applicable scenarios
Step 3 - Data Sources
Primary Research
- Web Analytics
- Survey Reports
- Research Institute
- Latest Research Reports
- Opinion Leaders
Secondary Research
- Annual Reports
- White Paper
- Latest Press Release
- Industry Association
- Paid Database
- Investor Presentations

Step 4 - Data Triangulation
Involves using different sources of information in order to increase the validity of a study
These sources are likely to be stakeholders in a program - participants, other researchers, program staff, other community members, and so on.
Then we put all data in single framework & apply various statistical tools to find out the dynamic on the market.
During the analysis stage, feedback from the stakeholder groups would be compared to determine areas of agreement as well as areas of divergence


