
Key Insights
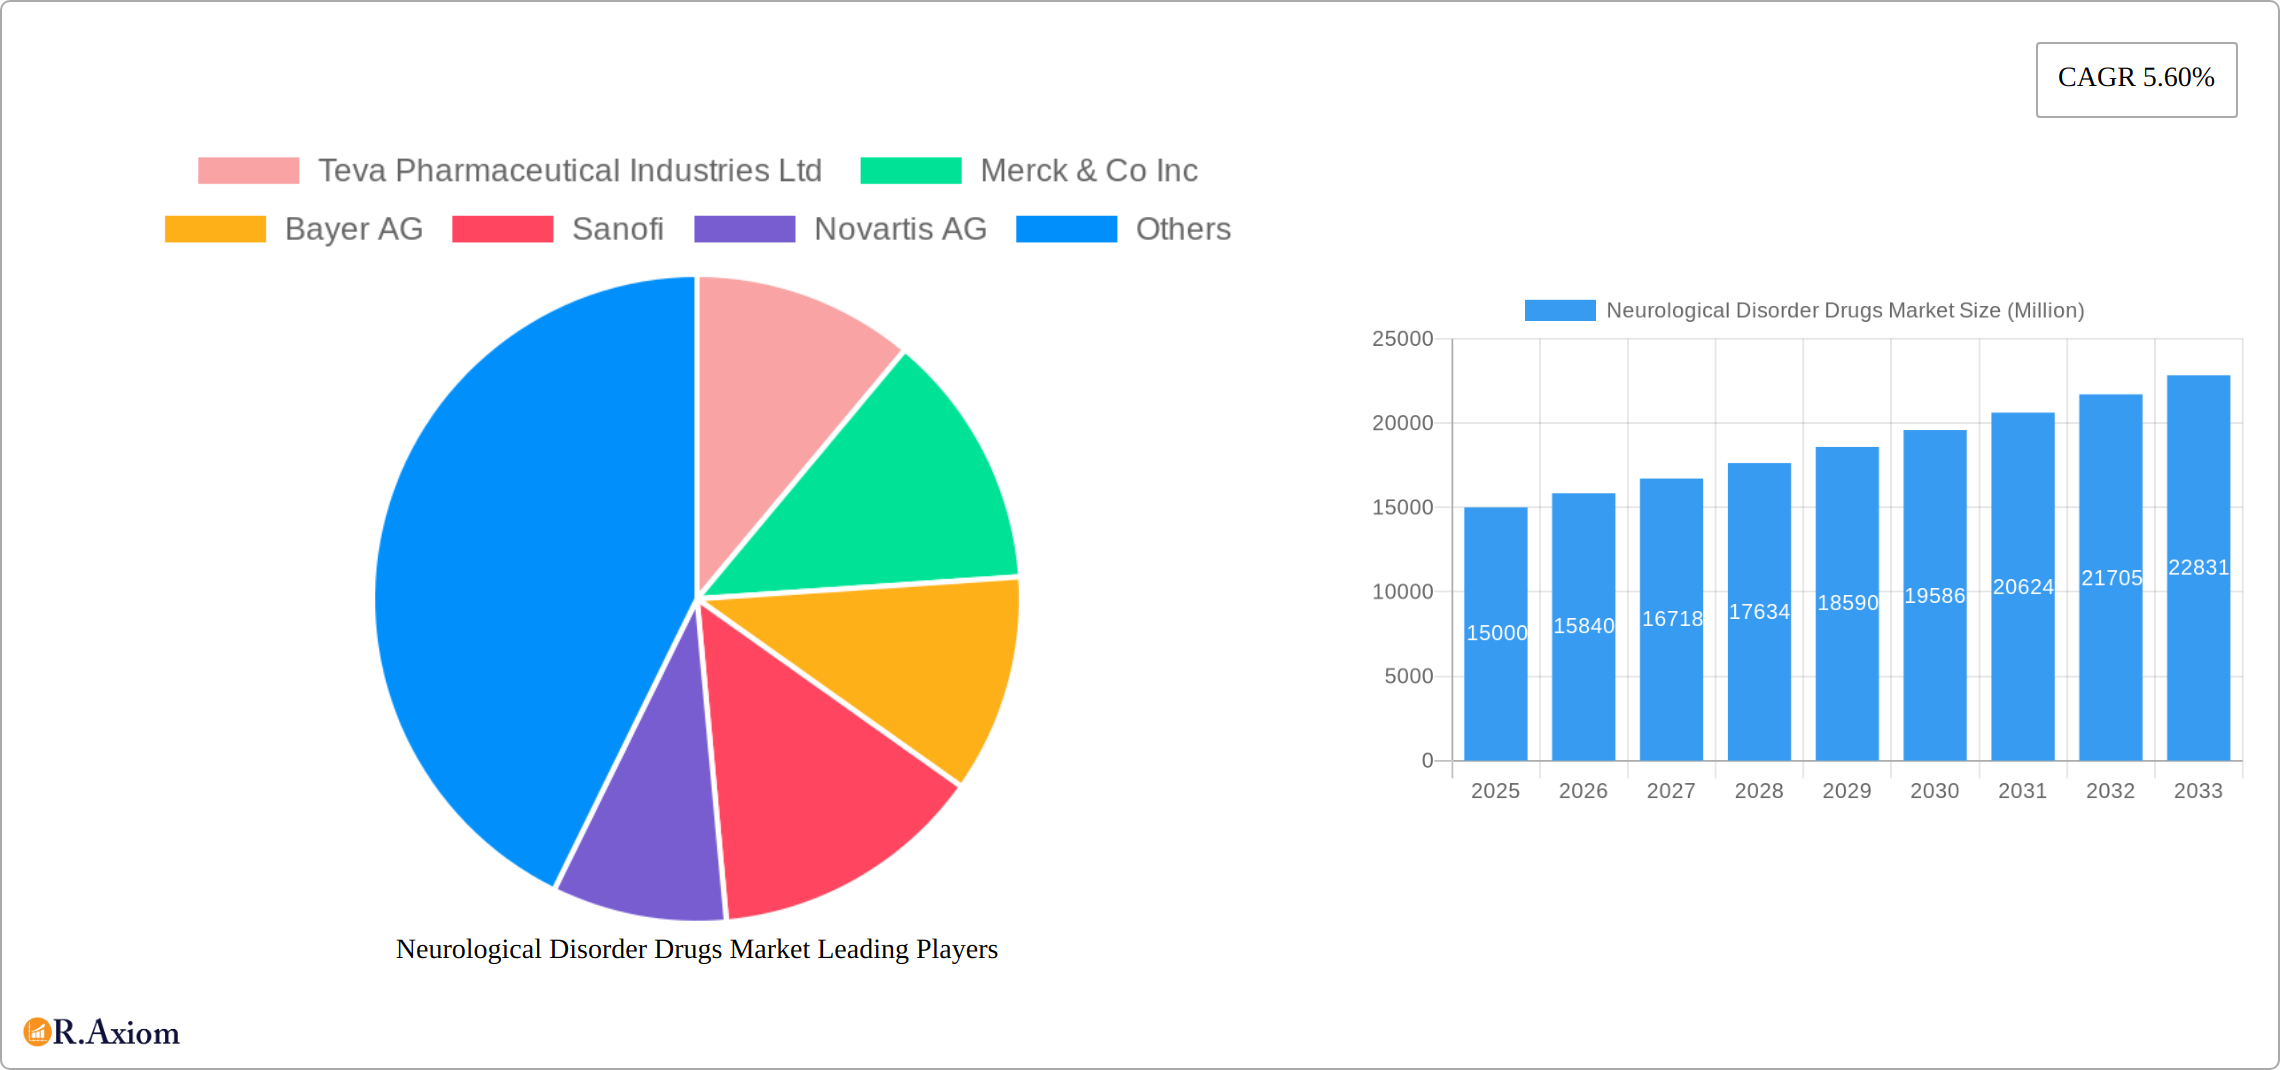
The Neurological Disorder Drugs Market is a significant and rapidly growing sector, projected to reach a substantial value by 2033. A 5.60% CAGR from 2019-2024 suggests strong and consistent market expansion, driven primarily by the increasing prevalence of neurological disorders like Alzheimer's disease, Parkinson's disease, epilepsy, and multiple sclerosis across the globe. Aging populations in developed nations and improved diagnostic capabilities are key factors contributing to market growth. Furthermore, ongoing research and development efforts are continuously yielding new and more effective treatment options, further fueling market expansion. The market is segmented by disorder type, with Alzheimer's and Parkinson's diseases likely representing the largest segments due to their high prevalence and significant unmet medical needs. The drug type segment is diversified, with cholinesterase inhibitors, NMDA receptor antagonists, and antiepileptic drugs dominating, reflecting the diverse pharmacological approaches used to manage various neurological conditions. Distribution channels encompass hospital pharmacies, online pharmacies, and retail pharmacies, with online pharmacies experiencing potential growth due to increasing digital adoption and convenience. Major pharmaceutical companies like Teva, Merck, Bayer, Sanofi, and Novartis are key players, driving innovation and competition within the market.
Geographic segmentation reveals significant regional variations. North America and Europe are currently expected to dominate the market, given their advanced healthcare infrastructure and higher prevalence rates of neurological disorders. However, rapidly developing economies in Asia-Pacific, particularly China and India, present significant growth opportunities as healthcare access improves and awareness of neurological conditions increases. The Middle East and Africa, and South America, while currently smaller markets, exhibit considerable growth potential driven by rising healthcare spending and increasing incidence of neurological diseases. While market restraints might include high drug costs and side effects associated with certain treatments, the overall market outlook remains positive, fueled by continuous innovation and the urgent need for effective neurological disorder treatments.
Neurological Disorder Drugs Market: A Comprehensive Report (2019-2033)
This detailed report provides a comprehensive analysis of the Neurological Disorder Drugs Market, covering the period from 2019 to 2033. It delves into market dynamics, competitive landscapes, and future growth prospects, offering invaluable insights for industry stakeholders, investors, and researchers. The report utilizes rigorous data analysis and forecasting methodologies to present a clear and actionable understanding of this vital sector. The base year for this analysis is 2025, with estimations for 2025 and a forecast extending to 2033. The historical period analyzed is 2019-2024.
Neurological Disorder Drugs Market Concentration & Innovation
The Neurological Disorder Drugs Market is characterized by a moderately concentrated landscape, with a few major players holding significant market share. Companies like Teva Pharmaceutical Industries Ltd, Merck & Co Inc, Bayer AG, Sanofi, Novartis AG, F Hoffmann-La Roche Ltd, AstraZeneca, Abbott, Johnson & Johnson Private Limited, and Pfizer Inc dominate the market, although the exact market share for each company in 2025 is currently estimated at xx%. The high cost of research and development, coupled with stringent regulatory approvals, acts as a barrier to entry for new players. Innovation is a crucial driver in this market, with companies continually investing in research to develop novel therapies targeting a wide range of neurological disorders. The market is witnessing a rise in biosimilars and generic drugs, intensifying competition and driving down prices in certain segments. The regulatory environment plays a significant role, impacting the speed of drug approvals and market entry.
- Market Concentration: The Herfindahl-Hirschman Index (HHI) for the market in 2025 is estimated at xx, indicating a moderately concentrated market.
- Innovation Drivers: High prevalence of neurological disorders, advancements in drug discovery technologies, and significant R&D investments.
- Regulatory Frameworks: Stringent regulatory approvals and pricing policies impact market dynamics and innovation.
- Product Substitutes: Generic drugs and biosimilars pose a competitive threat to originator drugs.
- M&A Activities: The market has witnessed several mergers and acquisitions in recent years, with deal values estimated at xx Million in the period 2019-2024. These acquisitions are driven by strategic expansion and consolidation within the industry.
Neurological Disorder Drugs Market Industry Trends & Insights
The Neurological Disorder Drugs Market exhibits a robust growth trajectory, driven by factors such as the increasing prevalence of neurological disorders globally, an aging population, and rising healthcare expenditure. The market is expected to witness a Compound Annual Growth Rate (CAGR) of xx% during the forecast period (2025-2033). Technological advancements, including the development of novel drug delivery systems and targeted therapies, are further enhancing market growth. Consumer preference is shifting towards more convenient and effective treatments, driving innovation in drug formulations and administration methods. Competitive dynamics are shaped by the presence of both large multinational pharmaceutical companies and smaller specialized biotech firms, resulting in a dynamic and innovative market. Market penetration of new drugs is expected to increase significantly due to various unmet needs in the neurological disorders market. The growing awareness about neurological disorders among the general population is also driving demand for effective treatments.

Dominant Markets & Segments in Neurological Disorder Drugs Market
Regional Dominance: North America is currently the dominant market for neurological disorder drugs, driven by high healthcare expenditure, advanced healthcare infrastructure, and a significant aging population. However, the Asia-Pacific region is expected to exhibit the fastest growth during the forecast period, fuelled by rising prevalence of neurological disorders and increasing healthcare investments.
Segment Dominance (By Disorders):
- Alzheimer's Disease: This segment holds a substantial market share due to the high prevalence of the disease and significant unmet medical needs.
- Parkinson's Disease: This segment is experiencing strong growth driven by the aging population and increasing diagnosis rates.
- Multiple Sclerosis: This segment displays moderate growth, largely driven by the development of new treatments.
Segment Dominance (By Drug Type):
- Antiepileptic Drugs: This segment is one of the largest segments within the market.
- Cholinesterase Inhibitors: This segment is dominated by a few key players and is a major segment for Alzheimer's Disease treatment.
Segment Dominance (By Distribution Channels):
- Hospital Pharmacies: This segment continues to hold a significant share, particularly for specialized and expensive neurological drugs.
- Retail Pharmacies: This segment is growing steadily, driven by increasing accessibility and affordability of drugs.
Key Drivers:
- Economic Policies: Government initiatives to increase healthcare accessibility.
- Infrastructure: Investments in healthcare infrastructure and access to healthcare in several growing economies.
Neurological Disorder Drugs Market Product Developments
The market is witnessing significant product innovation, with a focus on developing more effective and targeted therapies. Advancements in drug delivery systems, such as targeted drug delivery, are improving treatment outcomes and reducing side effects. The emergence of novel drug targets and mechanisms of action is expanding therapeutic options. These innovations are enhancing the efficacy, safety, and convenience of treatments, further driving market growth. Competition among companies to develop innovative treatments that meet patient needs is intense.
Report Scope & Segmentation Analysis
This report provides a comprehensive analysis of the Neurological Disorder Drugs Market, segmented by disorders (Epilepsy, Alzheimer's Disease, Parkinson's Disease, Multiple Sclerosis, Cerebrovascular Disease, Other Disorders), drug type (Cholinesterase Inhibitors, NMDA Receptor Antagonists, Antiepileptic, Antipsychotic and Antidepressant, Other Drugs Type), and distribution channels (Hospital Pharmacies, Online Pharmacies, Retail Pharmacies). Each segment is analyzed in terms of market size, growth projections, and competitive dynamics. Detailed market sizing and forecasting are provided for each segment, taking into account historical trends, current market conditions, and future projections.
Key Drivers of Neurological Disorder Drugs Market Growth
The key drivers for the market's growth include the rising prevalence of neurological disorders due to an aging global population, substantial investments in research and development leading to innovative therapies, and increasing healthcare spending. Government initiatives aimed at improving healthcare access and affordability also significantly contribute to market expansion. Furthermore, advancements in diagnostic technologies enable early detection and intervention, boosting treatment rates.
Challenges in the Neurological Disorder Drugs Market Sector
The market faces several challenges, including the high cost of drug development and lengthy regulatory approval processes, which limit the availability of new treatments. The complexities associated with neurological disorders and the need for personalized medicine pose further obstacles. Supply chain disruptions and price controls can impact profitability, and intense competition among established players and emerging biotech firms create a dynamic and challenging environment. The high cost of treatment also restricts accessibility for many patients.
Emerging Opportunities in Neurological Disorder Drugs Market
The market presents various emerging opportunities, including the development of novel therapies targeting unmet medical needs, such as personalized medicine approaches tailored to specific patient profiles. The growth of telehealth and remote patient monitoring offers opportunities to improve patient care and adherence. The expansion into emerging markets, particularly in developing economies, presents significant potential for growth. Furthermore, there are opportunities for collaboration between pharmaceutical companies and technology companies to develop innovative digital health solutions that enhance treatment outcomes.
Leading Players in the Neurological Disorder Drugs Market Market
- Teva Pharmaceutical Industries Ltd
- Merck & Co Inc
- Bayer AG
- Sanofi
- Novartis AG
- F Hoffmann-La Roche Ltd
- AstraZeneca
- Abbott
- Johnson & Johnson Private Limited
- Pfizer Inc
Key Developments in Neurological Disorder Drugs Market Industry
- March 2023: Biohaven Ltd. announced the development of an oral, brain-penetrant, dual inhibitor of TYK2 and JAK1 for treating neurological illnesses (excluding China).
- March 2023: Acadia Pharmaceuticals Inc. announced FDA approval of DAYBUE (trofinetide) for treating Rett syndrome in patients aged two and older.
Strategic Outlook for Neurological Disorder Drugs Market Market
The Neurological Disorder Drugs Market is poised for continued growth, driven by the persistent rise in the prevalence of neurological disorders, ongoing research and development efforts, and increased healthcare spending globally. The focus on personalized medicine and the adoption of advanced technologies, such as artificial intelligence in drug discovery, offer significant opportunities for market expansion. Strategic partnerships and collaborations between pharmaceutical companies and technology firms will play a crucial role in shaping future market dynamics. The market is expected to witness further consolidation through mergers and acquisitions as companies strive to strengthen their portfolios and market presence.
Neurological Disorder Drugs Market Segmentation
-
1. Disorders
- 1.1. Epilepsy
- 1.2. Alzheimer's Disease
- 1.3. Parkinson's Disease
- 1.4. Multiple Sclerosis
- 1.5. Cerebrovascular Disease
- 1.6. Other Disorders
-
2. Drug Type
- 2.1. Cholinesterase Inhibitors
- 2.2. NMDA Receptor Antagonists
- 2.3. Antiepileptic
- 2.4. Antipsychotic and Antidepressant
- 2.5. Other Drugs Type
-
3. Distribution Channels
- 3.1. Hospital Pharmacies
- 3.2. Online Pharmacies
- 3.3. Retail Pharmacies
Neurological Disorder Drugs Market Segmentation By Geography
-
1. North America
- 1.1. United States
- 1.2. Canada
- 1.3. Mexico
-
2. Europe
- 2.1. Germany
- 2.2. United Kingdom
- 2.3. France
- 2.4. Italy
- 2.5. Spain
- 2.6. Rest of Europe
-
3. Asia Pacific
- 3.1. China
- 3.2. Japan
- 3.3. India
- 3.4. Australia
- 3.5. South Korea
- 3.6. Rest of Asia Pacific
-
4. Middle East and Africa
- 4.1. GCC
- 4.2. South Africa
- 4.3. Rest of Middle East and Africa
-
5. South America
- 5.1. Brazil
- 5.2. Argentina
- 5.3. Rest of South America

Neurological Disorder Drugs Market REPORT HIGHLIGHTS
| Aspects | Details |
|---|---|
| Study Period | 2019-2033 |
| Base Year | 2024 |
| Estimated Year | 2025 |
| Forecast Period | 2025-2033 |
| Historical Period | 2019-2024 |
| Growth Rate | CAGR of 5.60% from 2019-2033 |
| Segmentation |
|
Table of Contents
- 1. Introduction
- 1.1. Research Scope
- 1.2. Market Segmentation
- 1.3. Research Methodology
- 1.4. Definitions and Assumptions
- 2. Executive Summary
- 2.1. Introduction
- 3. Market Dynamics
- 3.1. Introduction
- 3.2. Market Drivers
- 3.2.1. High Prevalence of Neurological Diseases; Rising Awareness for Early Disease Diagnosis; Increasing Number of Research and Development for Neurological Diseases
- 3.3. Market Restrains
- 3.3.1. High Cost for Diagnosis and Treatment; Stringent Regulations Associated with the Neurological Drugs
- 3.4. Market Trends
- 3.4.1. The Alzheimer's Disease Segment is Expected to Hold a Significant Share in the Neurological Disorders Drugs Market Over the Forecast Period
- 4. Market Factor Analysis
- 4.1. Porters Five Forces
- 4.2. Supply/Value Chain
- 4.3. PESTEL analysis
- 4.4. Market Entropy
- 4.5. Patent/Trademark Analysis
- 5. Global Neurological Disorder Drugs Market Analysis, Insights and Forecast, 2019-2031
- 5.1. Market Analysis, Insights and Forecast - by Disorders
- 5.1.1. Epilepsy
- 5.1.2. Alzheimer's Disease
- 5.1.3. Parkinson's Disease
- 5.1.4. Multiple Sclerosis
- 5.1.5. Cerebrovascular Disease
- 5.1.6. Other Disorders
- 5.2. Market Analysis, Insights and Forecast - by Drug Type
- 5.2.1. Cholinesterase Inhibitors
- 5.2.2. NMDA Receptor Antagonists
- 5.2.3. Antiepileptic
- 5.2.4. Antipsychotic and Antidepressant
- 5.2.5. Other Drugs Type
- 5.3. Market Analysis, Insights and Forecast - by Distribution Channels
- 5.3.1. Hospital Pharmacies
- 5.3.2. Online Pharmacies
- 5.3.3. Retail Pharmacies
- 5.4. Market Analysis, Insights and Forecast - by Region
- 5.4.1. North America
- 5.4.2. Europe
- 5.4.3. Asia Pacific
- 5.4.4. Middle East and Africa
- 5.4.5. South America
- 5.1. Market Analysis, Insights and Forecast - by Disorders
- 6. North America Neurological Disorder Drugs Market Analysis, Insights and Forecast, 2019-2031
- 6.1. Market Analysis, Insights and Forecast - by Disorders
- 6.1.1. Epilepsy
- 6.1.2. Alzheimer's Disease
- 6.1.3. Parkinson's Disease
- 6.1.4. Multiple Sclerosis
- 6.1.5. Cerebrovascular Disease
- 6.1.6. Other Disorders
- 6.2. Market Analysis, Insights and Forecast - by Drug Type
- 6.2.1. Cholinesterase Inhibitors
- 6.2.2. NMDA Receptor Antagonists
- 6.2.3. Antiepileptic
- 6.2.4. Antipsychotic and Antidepressant
- 6.2.5. Other Drugs Type
- 6.3. Market Analysis, Insights and Forecast - by Distribution Channels
- 6.3.1. Hospital Pharmacies
- 6.3.2. Online Pharmacies
- 6.3.3. Retail Pharmacies
- 6.1. Market Analysis, Insights and Forecast - by Disorders
- 7. Europe Neurological Disorder Drugs Market Analysis, Insights and Forecast, 2019-2031
- 7.1. Market Analysis, Insights and Forecast - by Disorders
- 7.1.1. Epilepsy
- 7.1.2. Alzheimer's Disease
- 7.1.3. Parkinson's Disease
- 7.1.4. Multiple Sclerosis
- 7.1.5. Cerebrovascular Disease
- 7.1.6. Other Disorders
- 7.2. Market Analysis, Insights and Forecast - by Drug Type
- 7.2.1. Cholinesterase Inhibitors
- 7.2.2. NMDA Receptor Antagonists
- 7.2.3. Antiepileptic
- 7.2.4. Antipsychotic and Antidepressant
- 7.2.5. Other Drugs Type
- 7.3. Market Analysis, Insights and Forecast - by Distribution Channels
- 7.3.1. Hospital Pharmacies
- 7.3.2. Online Pharmacies
- 7.3.3. Retail Pharmacies
- 7.1. Market Analysis, Insights and Forecast - by Disorders
- 8. Asia Pacific Neurological Disorder Drugs Market Analysis, Insights and Forecast, 2019-2031
- 8.1. Market Analysis, Insights and Forecast - by Disorders
- 8.1.1. Epilepsy
- 8.1.2. Alzheimer's Disease
- 8.1.3. Parkinson's Disease
- 8.1.4. Multiple Sclerosis
- 8.1.5. Cerebrovascular Disease
- 8.1.6. Other Disorders
- 8.2. Market Analysis, Insights and Forecast - by Drug Type
- 8.2.1. Cholinesterase Inhibitors
- 8.2.2. NMDA Receptor Antagonists
- 8.2.3. Antiepileptic
- 8.2.4. Antipsychotic and Antidepressant
- 8.2.5. Other Drugs Type
- 8.3. Market Analysis, Insights and Forecast - by Distribution Channels
- 8.3.1. Hospital Pharmacies
- 8.3.2. Online Pharmacies
- 8.3.3. Retail Pharmacies
- 8.1. Market Analysis, Insights and Forecast - by Disorders
- 9. Middle East and Africa Neurological Disorder Drugs Market Analysis, Insights and Forecast, 2019-2031
- 9.1. Market Analysis, Insights and Forecast - by Disorders
- 9.1.1. Epilepsy
- 9.1.2. Alzheimer's Disease
- 9.1.3. Parkinson's Disease
- 9.1.4. Multiple Sclerosis
- 9.1.5. Cerebrovascular Disease
- 9.1.6. Other Disorders
- 9.2. Market Analysis, Insights and Forecast - by Drug Type
- 9.2.1. Cholinesterase Inhibitors
- 9.2.2. NMDA Receptor Antagonists
- 9.2.3. Antiepileptic
- 9.2.4. Antipsychotic and Antidepressant
- 9.2.5. Other Drugs Type
- 9.3. Market Analysis, Insights and Forecast - by Distribution Channels
- 9.3.1. Hospital Pharmacies
- 9.3.2. Online Pharmacies
- 9.3.3. Retail Pharmacies
- 9.1. Market Analysis, Insights and Forecast - by Disorders
- 10. South America Neurological Disorder Drugs Market Analysis, Insights and Forecast, 2019-2031
- 10.1. Market Analysis, Insights and Forecast - by Disorders
- 10.1.1. Epilepsy
- 10.1.2. Alzheimer's Disease
- 10.1.3. Parkinson's Disease
- 10.1.4. Multiple Sclerosis
- 10.1.5. Cerebrovascular Disease
- 10.1.6. Other Disorders
- 10.2. Market Analysis, Insights and Forecast - by Drug Type
- 10.2.1. Cholinesterase Inhibitors
- 10.2.2. NMDA Receptor Antagonists
- 10.2.3. Antiepileptic
- 10.2.4. Antipsychotic and Antidepressant
- 10.2.5. Other Drugs Type
- 10.3. Market Analysis, Insights and Forecast - by Distribution Channels
- 10.3.1. Hospital Pharmacies
- 10.3.2. Online Pharmacies
- 10.3.3. Retail Pharmacies
- 10.1. Market Analysis, Insights and Forecast - by Disorders
- 11. North America Neurological Disorder Drugs Market Analysis, Insights and Forecast, 2019-2031
- 11.1. Market Analysis, Insights and Forecast - By Country/Sub-region
- 11.1.1 United States
- 11.1.2 Canada
- 11.1.3 Mexico
- 12. Europe Neurological Disorder Drugs Market Analysis, Insights and Forecast, 2019-2031
- 12.1. Market Analysis, Insights and Forecast - By Country/Sub-region
- 12.1.1 Germany
- 12.1.2 United Kingdom
- 12.1.3 France
- 12.1.4 Italy
- 12.1.5 Spain
- 12.1.6 Rest of Europe
- 13. Asia Pacific Neurological Disorder Drugs Market Analysis, Insights and Forecast, 2019-2031
- 13.1. Market Analysis, Insights and Forecast - By Country/Sub-region
- 13.1.1 China
- 13.1.2 Japan
- 13.1.3 India
- 13.1.4 Australia
- 13.1.5 South Korea
- 13.1.6 Rest of Asia Pacific
- 14. Middle East and Africa Neurological Disorder Drugs Market Analysis, Insights and Forecast, 2019-2031
- 14.1. Market Analysis, Insights and Forecast - By Country/Sub-region
- 14.1.1 GCC
- 14.1.2 South Africa
- 14.1.3 Rest of Middle East and Africa
- 15. South America Neurological Disorder Drugs Market Analysis, Insights and Forecast, 2019-2031
- 15.1. Market Analysis, Insights and Forecast - By Country/Sub-region
- 15.1.1 Brazil
- 15.1.2 Argentina
- 15.1.3 Rest of South America
- 16. Competitive Analysis
- 16.1. Global Market Share Analysis 2024
- 16.2. Company Profiles
- 16.2.1 Teva Pharmaceutical Industries Ltd
- 16.2.1.1. Overview
- 16.2.1.2. Products
- 16.2.1.3. SWOT Analysis
- 16.2.1.4. Recent Developments
- 16.2.1.5. Financials (Based on Availability)
- 16.2.2 Merck & Co Inc
- 16.2.2.1. Overview
- 16.2.2.2. Products
- 16.2.2.3. SWOT Analysis
- 16.2.2.4. Recent Developments
- 16.2.2.5. Financials (Based on Availability)
- 16.2.3 Bayer AG
- 16.2.3.1. Overview
- 16.2.3.2. Products
- 16.2.3.3. SWOT Analysis
- 16.2.3.4. Recent Developments
- 16.2.3.5. Financials (Based on Availability)
- 16.2.4 Sanofi
- 16.2.4.1. Overview
- 16.2.4.2. Products
- 16.2.4.3. SWOT Analysis
- 16.2.4.4. Recent Developments
- 16.2.4.5. Financials (Based on Availability)
- 16.2.5 Novartis AG
- 16.2.5.1. Overview
- 16.2.5.2. Products
- 16.2.5.3. SWOT Analysis
- 16.2.5.4. Recent Developments
- 16.2.5.5. Financials (Based on Availability)
- 16.2.6 F Hoffmann-La Roche Ltd
- 16.2.6.1. Overview
- 16.2.6.2. Products
- 16.2.6.3. SWOT Analysis
- 16.2.6.4. Recent Developments
- 16.2.6.5. Financials (Based on Availability)
- 16.2.7 AstraZeneca
- 16.2.7.1. Overview
- 16.2.7.2. Products
- 16.2.7.3. SWOT Analysis
- 16.2.7.4. Recent Developments
- 16.2.7.5. Financials (Based on Availability)
- 16.2.8 Abbott
- 16.2.8.1. Overview
- 16.2.8.2. Products
- 16.2.8.3. SWOT Analysis
- 16.2.8.4. Recent Developments
- 16.2.8.5. Financials (Based on Availability)
- 16.2.9 Johnson & Johnson Private Limited
- 16.2.9.1. Overview
- 16.2.9.2. Products
- 16.2.9.3. SWOT Analysis
- 16.2.9.4. Recent Developments
- 16.2.9.5. Financials (Based on Availability)
- 16.2.10 Pfizer Inc
- 16.2.10.1. Overview
- 16.2.10.2. Products
- 16.2.10.3. SWOT Analysis
- 16.2.10.4. Recent Developments
- 16.2.10.5. Financials (Based on Availability)
- 16.2.1 Teva Pharmaceutical Industries Ltd
List of Figures
- Figure 1: Global Neurological Disorder Drugs Market Revenue Breakdown (Million, %) by Region 2024 & 2032
- Figure 2: Global Neurological Disorder Drugs Market Volume Breakdown (K Unit, %) by Region 2024 & 2032
- Figure 3: North America Neurological Disorder Drugs Market Revenue (Million), by Country 2024 & 2032
- Figure 4: North America Neurological Disorder Drugs Market Volume (K Unit), by Country 2024 & 2032
- Figure 5: North America Neurological Disorder Drugs Market Revenue Share (%), by Country 2024 & 2032
- Figure 6: North America Neurological Disorder Drugs Market Volume Share (%), by Country 2024 & 2032
- Figure 7: Europe Neurological Disorder Drugs Market Revenue (Million), by Country 2024 & 2032
- Figure 8: Europe Neurological Disorder Drugs Market Volume (K Unit), by Country 2024 & 2032
- Figure 9: Europe Neurological Disorder Drugs Market Revenue Share (%), by Country 2024 & 2032
- Figure 10: Europe Neurological Disorder Drugs Market Volume Share (%), by Country 2024 & 2032
- Figure 11: Asia Pacific Neurological Disorder Drugs Market Revenue (Million), by Country 2024 & 2032
- Figure 12: Asia Pacific Neurological Disorder Drugs Market Volume (K Unit), by Country 2024 & 2032
- Figure 13: Asia Pacific Neurological Disorder Drugs Market Revenue Share (%), by Country 2024 & 2032
- Figure 14: Asia Pacific Neurological Disorder Drugs Market Volume Share (%), by Country 2024 & 2032
- Figure 15: Middle East and Africa Neurological Disorder Drugs Market Revenue (Million), by Country 2024 & 2032
- Figure 16: Middle East and Africa Neurological Disorder Drugs Market Volume (K Unit), by Country 2024 & 2032
- Figure 17: Middle East and Africa Neurological Disorder Drugs Market Revenue Share (%), by Country 2024 & 2032
- Figure 18: Middle East and Africa Neurological Disorder Drugs Market Volume Share (%), by Country 2024 & 2032
- Figure 19: South America Neurological Disorder Drugs Market Revenue (Million), by Country 2024 & 2032
- Figure 20: South America Neurological Disorder Drugs Market Volume (K Unit), by Country 2024 & 2032
- Figure 21: South America Neurological Disorder Drugs Market Revenue Share (%), by Country 2024 & 2032
- Figure 22: South America Neurological Disorder Drugs Market Volume Share (%), by Country 2024 & 2032
- Figure 23: North America Neurological Disorder Drugs Market Revenue (Million), by Disorders 2024 & 2032
- Figure 24: North America Neurological Disorder Drugs Market Volume (K Unit), by Disorders 2024 & 2032
- Figure 25: North America Neurological Disorder Drugs Market Revenue Share (%), by Disorders 2024 & 2032
- Figure 26: North America Neurological Disorder Drugs Market Volume Share (%), by Disorders 2024 & 2032
- Figure 27: North America Neurological Disorder Drugs Market Revenue (Million), by Drug Type 2024 & 2032
- Figure 28: North America Neurological Disorder Drugs Market Volume (K Unit), by Drug Type 2024 & 2032
- Figure 29: North America Neurological Disorder Drugs Market Revenue Share (%), by Drug Type 2024 & 2032
- Figure 30: North America Neurological Disorder Drugs Market Volume Share (%), by Drug Type 2024 & 2032
- Figure 31: North America Neurological Disorder Drugs Market Revenue (Million), by Distribution Channels 2024 & 2032
- Figure 32: North America Neurological Disorder Drugs Market Volume (K Unit), by Distribution Channels 2024 & 2032
- Figure 33: North America Neurological Disorder Drugs Market Revenue Share (%), by Distribution Channels 2024 & 2032
- Figure 34: North America Neurological Disorder Drugs Market Volume Share (%), by Distribution Channels 2024 & 2032
- Figure 35: North America Neurological Disorder Drugs Market Revenue (Million), by Country 2024 & 2032
- Figure 36: North America Neurological Disorder Drugs Market Volume (K Unit), by Country 2024 & 2032
- Figure 37: North America Neurological Disorder Drugs Market Revenue Share (%), by Country 2024 & 2032
- Figure 38: North America Neurological Disorder Drugs Market Volume Share (%), by Country 2024 & 2032
- Figure 39: Europe Neurological Disorder Drugs Market Revenue (Million), by Disorders 2024 & 2032
- Figure 40: Europe Neurological Disorder Drugs Market Volume (K Unit), by Disorders 2024 & 2032
- Figure 41: Europe Neurological Disorder Drugs Market Revenue Share (%), by Disorders 2024 & 2032
- Figure 42: Europe Neurological Disorder Drugs Market Volume Share (%), by Disorders 2024 & 2032
- Figure 43: Europe Neurological Disorder Drugs Market Revenue (Million), by Drug Type 2024 & 2032
- Figure 44: Europe Neurological Disorder Drugs Market Volume (K Unit), by Drug Type 2024 & 2032
- Figure 45: Europe Neurological Disorder Drugs Market Revenue Share (%), by Drug Type 2024 & 2032
- Figure 46: Europe Neurological Disorder Drugs Market Volume Share (%), by Drug Type 2024 & 2032
- Figure 47: Europe Neurological Disorder Drugs Market Revenue (Million), by Distribution Channels 2024 & 2032
- Figure 48: Europe Neurological Disorder Drugs Market Volume (K Unit), by Distribution Channels 2024 & 2032
- Figure 49: Europe Neurological Disorder Drugs Market Revenue Share (%), by Distribution Channels 2024 & 2032
- Figure 50: Europe Neurological Disorder Drugs Market Volume Share (%), by Distribution Channels 2024 & 2032
- Figure 51: Europe Neurological Disorder Drugs Market Revenue (Million), by Country 2024 & 2032
- Figure 52: Europe Neurological Disorder Drugs Market Volume (K Unit), by Country 2024 & 2032
- Figure 53: Europe Neurological Disorder Drugs Market Revenue Share (%), by Country 2024 & 2032
- Figure 54: Europe Neurological Disorder Drugs Market Volume Share (%), by Country 2024 & 2032
- Figure 55: Asia Pacific Neurological Disorder Drugs Market Revenue (Million), by Disorders 2024 & 2032
- Figure 56: Asia Pacific Neurological Disorder Drugs Market Volume (K Unit), by Disorders 2024 & 2032
- Figure 57: Asia Pacific Neurological Disorder Drugs Market Revenue Share (%), by Disorders 2024 & 2032
- Figure 58: Asia Pacific Neurological Disorder Drugs Market Volume Share (%), by Disorders 2024 & 2032
- Figure 59: Asia Pacific Neurological Disorder Drugs Market Revenue (Million), by Drug Type 2024 & 2032
- Figure 60: Asia Pacific Neurological Disorder Drugs Market Volume (K Unit), by Drug Type 2024 & 2032
- Figure 61: Asia Pacific Neurological Disorder Drugs Market Revenue Share (%), by Drug Type 2024 & 2032
- Figure 62: Asia Pacific Neurological Disorder Drugs Market Volume Share (%), by Drug Type 2024 & 2032
- Figure 63: Asia Pacific Neurological Disorder Drugs Market Revenue (Million), by Distribution Channels 2024 & 2032
- Figure 64: Asia Pacific Neurological Disorder Drugs Market Volume (K Unit), by Distribution Channels 2024 & 2032
- Figure 65: Asia Pacific Neurological Disorder Drugs Market Revenue Share (%), by Distribution Channels 2024 & 2032
- Figure 66: Asia Pacific Neurological Disorder Drugs Market Volume Share (%), by Distribution Channels 2024 & 2032
- Figure 67: Asia Pacific Neurological Disorder Drugs Market Revenue (Million), by Country 2024 & 2032
- Figure 68: Asia Pacific Neurological Disorder Drugs Market Volume (K Unit), by Country 2024 & 2032
- Figure 69: Asia Pacific Neurological Disorder Drugs Market Revenue Share (%), by Country 2024 & 2032
- Figure 70: Asia Pacific Neurological Disorder Drugs Market Volume Share (%), by Country 2024 & 2032
- Figure 71: Middle East and Africa Neurological Disorder Drugs Market Revenue (Million), by Disorders 2024 & 2032
- Figure 72: Middle East and Africa Neurological Disorder Drugs Market Volume (K Unit), by Disorders 2024 & 2032
- Figure 73: Middle East and Africa Neurological Disorder Drugs Market Revenue Share (%), by Disorders 2024 & 2032
- Figure 74: Middle East and Africa Neurological Disorder Drugs Market Volume Share (%), by Disorders 2024 & 2032
- Figure 75: Middle East and Africa Neurological Disorder Drugs Market Revenue (Million), by Drug Type 2024 & 2032
- Figure 76: Middle East and Africa Neurological Disorder Drugs Market Volume (K Unit), by Drug Type 2024 & 2032
- Figure 77: Middle East and Africa Neurological Disorder Drugs Market Revenue Share (%), by Drug Type 2024 & 2032
- Figure 78: Middle East and Africa Neurological Disorder Drugs Market Volume Share (%), by Drug Type 2024 & 2032
- Figure 79: Middle East and Africa Neurological Disorder Drugs Market Revenue (Million), by Distribution Channels 2024 & 2032
- Figure 80: Middle East and Africa Neurological Disorder Drugs Market Volume (K Unit), by Distribution Channels 2024 & 2032
- Figure 81: Middle East and Africa Neurological Disorder Drugs Market Revenue Share (%), by Distribution Channels 2024 & 2032
- Figure 82: Middle East and Africa Neurological Disorder Drugs Market Volume Share (%), by Distribution Channels 2024 & 2032
- Figure 83: Middle East and Africa Neurological Disorder Drugs Market Revenue (Million), by Country 2024 & 2032
- Figure 84: Middle East and Africa Neurological Disorder Drugs Market Volume (K Unit), by Country 2024 & 2032
- Figure 85: Middle East and Africa Neurological Disorder Drugs Market Revenue Share (%), by Country 2024 & 2032
- Figure 86: Middle East and Africa Neurological Disorder Drugs Market Volume Share (%), by Country 2024 & 2032
- Figure 87: South America Neurological Disorder Drugs Market Revenue (Million), by Disorders 2024 & 2032
- Figure 88: South America Neurological Disorder Drugs Market Volume (K Unit), by Disorders 2024 & 2032
- Figure 89: South America Neurological Disorder Drugs Market Revenue Share (%), by Disorders 2024 & 2032
- Figure 90: South America Neurological Disorder Drugs Market Volume Share (%), by Disorders 2024 & 2032
- Figure 91: South America Neurological Disorder Drugs Market Revenue (Million), by Drug Type 2024 & 2032
- Figure 92: South America Neurological Disorder Drugs Market Volume (K Unit), by Drug Type 2024 & 2032
- Figure 93: South America Neurological Disorder Drugs Market Revenue Share (%), by Drug Type 2024 & 2032
- Figure 94: South America Neurological Disorder Drugs Market Volume Share (%), by Drug Type 2024 & 2032
- Figure 95: South America Neurological Disorder Drugs Market Revenue (Million), by Distribution Channels 2024 & 2032
- Figure 96: South America Neurological Disorder Drugs Market Volume (K Unit), by Distribution Channels 2024 & 2032
- Figure 97: South America Neurological Disorder Drugs Market Revenue Share (%), by Distribution Channels 2024 & 2032
- Figure 98: South America Neurological Disorder Drugs Market Volume Share (%), by Distribution Channels 2024 & 2032
- Figure 99: South America Neurological Disorder Drugs Market Revenue (Million), by Country 2024 & 2032
- Figure 100: South America Neurological Disorder Drugs Market Volume (K Unit), by Country 2024 & 2032
- Figure 101: South America Neurological Disorder Drugs Market Revenue Share (%), by Country 2024 & 2032
- Figure 102: South America Neurological Disorder Drugs Market Volume Share (%), by Country 2024 & 2032
List of Tables
- Table 1: Global Neurological Disorder Drugs Market Revenue Million Forecast, by Region 2019 & 2032
- Table 2: Global Neurological Disorder Drugs Market Volume K Unit Forecast, by Region 2019 & 2032
- Table 3: Global Neurological Disorder Drugs Market Revenue Million Forecast, by Disorders 2019 & 2032
- Table 4: Global Neurological Disorder Drugs Market Volume K Unit Forecast, by Disorders 2019 & 2032
- Table 5: Global Neurological Disorder Drugs Market Revenue Million Forecast, by Drug Type 2019 & 2032
- Table 6: Global Neurological Disorder Drugs Market Volume K Unit Forecast, by Drug Type 2019 & 2032
- Table 7: Global Neurological Disorder Drugs Market Revenue Million Forecast, by Distribution Channels 2019 & 2032
- Table 8: Global Neurological Disorder Drugs Market Volume K Unit Forecast, by Distribution Channels 2019 & 2032
- Table 9: Global Neurological Disorder Drugs Market Revenue Million Forecast, by Region 2019 & 2032
- Table 10: Global Neurological Disorder Drugs Market Volume K Unit Forecast, by Region 2019 & 2032
- Table 11: Global Neurological Disorder Drugs Market Revenue Million Forecast, by Country 2019 & 2032
- Table 12: Global Neurological Disorder Drugs Market Volume K Unit Forecast, by Country 2019 & 2032
- Table 13: United States Neurological Disorder Drugs Market Revenue (Million) Forecast, by Application 2019 & 2032
- Table 14: United States Neurological Disorder Drugs Market Volume (K Unit) Forecast, by Application 2019 & 2032
- Table 15: Canada Neurological Disorder Drugs Market Revenue (Million) Forecast, by Application 2019 & 2032
- Table 16: Canada Neurological Disorder Drugs Market Volume (K Unit) Forecast, by Application 2019 & 2032
- Table 17: Mexico Neurological Disorder Drugs Market Revenue (Million) Forecast, by Application 2019 & 2032
- Table 18: Mexico Neurological Disorder Drugs Market Volume (K Unit) Forecast, by Application 2019 & 2032
- Table 19: Global Neurological Disorder Drugs Market Revenue Million Forecast, by Country 2019 & 2032
- Table 20: Global Neurological Disorder Drugs Market Volume K Unit Forecast, by Country 2019 & 2032
- Table 21: Germany Neurological Disorder Drugs Market Revenue (Million) Forecast, by Application 2019 & 2032
- Table 22: Germany Neurological Disorder Drugs Market Volume (K Unit) Forecast, by Application 2019 & 2032
- Table 23: United Kingdom Neurological Disorder Drugs Market Revenue (Million) Forecast, by Application 2019 & 2032
- Table 24: United Kingdom Neurological Disorder Drugs Market Volume (K Unit) Forecast, by Application 2019 & 2032
- Table 25: France Neurological Disorder Drugs Market Revenue (Million) Forecast, by Application 2019 & 2032
- Table 26: France Neurological Disorder Drugs Market Volume (K Unit) Forecast, by Application 2019 & 2032
- Table 27: Italy Neurological Disorder Drugs Market Revenue (Million) Forecast, by Application 2019 & 2032
- Table 28: Italy Neurological Disorder Drugs Market Volume (K Unit) Forecast, by Application 2019 & 2032
- Table 29: Spain Neurological Disorder Drugs Market Revenue (Million) Forecast, by Application 2019 & 2032
- Table 30: Spain Neurological Disorder Drugs Market Volume (K Unit) Forecast, by Application 2019 & 2032
- Table 31: Rest of Europe Neurological Disorder Drugs Market Revenue (Million) Forecast, by Application 2019 & 2032
- Table 32: Rest of Europe Neurological Disorder Drugs Market Volume (K Unit) Forecast, by Application 2019 & 2032
- Table 33: Global Neurological Disorder Drugs Market Revenue Million Forecast, by Country 2019 & 2032
- Table 34: Global Neurological Disorder Drugs Market Volume K Unit Forecast, by Country 2019 & 2032
- Table 35: China Neurological Disorder Drugs Market Revenue (Million) Forecast, by Application 2019 & 2032
- Table 36: China Neurological Disorder Drugs Market Volume (K Unit) Forecast, by Application 2019 & 2032
- Table 37: Japan Neurological Disorder Drugs Market Revenue (Million) Forecast, by Application 2019 & 2032
- Table 38: Japan Neurological Disorder Drugs Market Volume (K Unit) Forecast, by Application 2019 & 2032
- Table 39: India Neurological Disorder Drugs Market Revenue (Million) Forecast, by Application 2019 & 2032
- Table 40: India Neurological Disorder Drugs Market Volume (K Unit) Forecast, by Application 2019 & 2032
- Table 41: Australia Neurological Disorder Drugs Market Revenue (Million) Forecast, by Application 2019 & 2032
- Table 42: Australia Neurological Disorder Drugs Market Volume (K Unit) Forecast, by Application 2019 & 2032
- Table 43: South Korea Neurological Disorder Drugs Market Revenue (Million) Forecast, by Application 2019 & 2032
- Table 44: South Korea Neurological Disorder Drugs Market Volume (K Unit) Forecast, by Application 2019 & 2032
- Table 45: Rest of Asia Pacific Neurological Disorder Drugs Market Revenue (Million) Forecast, by Application 2019 & 2032
- Table 46: Rest of Asia Pacific Neurological Disorder Drugs Market Volume (K Unit) Forecast, by Application 2019 & 2032
- Table 47: Global Neurological Disorder Drugs Market Revenue Million Forecast, by Country 2019 & 2032
- Table 48: Global Neurological Disorder Drugs Market Volume K Unit Forecast, by Country 2019 & 2032
- Table 49: GCC Neurological Disorder Drugs Market Revenue (Million) Forecast, by Application 2019 & 2032
- Table 50: GCC Neurological Disorder Drugs Market Volume (K Unit) Forecast, by Application 2019 & 2032
- Table 51: South Africa Neurological Disorder Drugs Market Revenue (Million) Forecast, by Application 2019 & 2032
- Table 52: South Africa Neurological Disorder Drugs Market Volume (K Unit) Forecast, by Application 2019 & 2032
- Table 53: Rest of Middle East and Africa Neurological Disorder Drugs Market Revenue (Million) Forecast, by Application 2019 & 2032
- Table 54: Rest of Middle East and Africa Neurological Disorder Drugs Market Volume (K Unit) Forecast, by Application 2019 & 2032
- Table 55: Global Neurological Disorder Drugs Market Revenue Million Forecast, by Country 2019 & 2032
- Table 56: Global Neurological Disorder Drugs Market Volume K Unit Forecast, by Country 2019 & 2032
- Table 57: Brazil Neurological Disorder Drugs Market Revenue (Million) Forecast, by Application 2019 & 2032
- Table 58: Brazil Neurological Disorder Drugs Market Volume (K Unit) Forecast, by Application 2019 & 2032
- Table 59: Argentina Neurological Disorder Drugs Market Revenue (Million) Forecast, by Application 2019 & 2032
- Table 60: Argentina Neurological Disorder Drugs Market Volume (K Unit) Forecast, by Application 2019 & 2032
- Table 61: Rest of South America Neurological Disorder Drugs Market Revenue (Million) Forecast, by Application 2019 & 2032
- Table 62: Rest of South America Neurological Disorder Drugs Market Volume (K Unit) Forecast, by Application 2019 & 2032
- Table 63: Global Neurological Disorder Drugs Market Revenue Million Forecast, by Disorders 2019 & 2032
- Table 64: Global Neurological Disorder Drugs Market Volume K Unit Forecast, by Disorders 2019 & 2032
- Table 65: Global Neurological Disorder Drugs Market Revenue Million Forecast, by Drug Type 2019 & 2032
- Table 66: Global Neurological Disorder Drugs Market Volume K Unit Forecast, by Drug Type 2019 & 2032
- Table 67: Global Neurological Disorder Drugs Market Revenue Million Forecast, by Distribution Channels 2019 & 2032
- Table 68: Global Neurological Disorder Drugs Market Volume K Unit Forecast, by Distribution Channels 2019 & 2032
- Table 69: Global Neurological Disorder Drugs Market Revenue Million Forecast, by Country 2019 & 2032
- Table 70: Global Neurological Disorder Drugs Market Volume K Unit Forecast, by Country 2019 & 2032
- Table 71: United States Neurological Disorder Drugs Market Revenue (Million) Forecast, by Application 2019 & 2032
- Table 72: United States Neurological Disorder Drugs Market Volume (K Unit) Forecast, by Application 2019 & 2032
- Table 73: Canada Neurological Disorder Drugs Market Revenue (Million) Forecast, by Application 2019 & 2032
- Table 74: Canada Neurological Disorder Drugs Market Volume (K Unit) Forecast, by Application 2019 & 2032
- Table 75: Mexico Neurological Disorder Drugs Market Revenue (Million) Forecast, by Application 2019 & 2032
- Table 76: Mexico Neurological Disorder Drugs Market Volume (K Unit) Forecast, by Application 2019 & 2032
- Table 77: Global Neurological Disorder Drugs Market Revenue Million Forecast, by Disorders 2019 & 2032
- Table 78: Global Neurological Disorder Drugs Market Volume K Unit Forecast, by Disorders 2019 & 2032
- Table 79: Global Neurological Disorder Drugs Market Revenue Million Forecast, by Drug Type 2019 & 2032
- Table 80: Global Neurological Disorder Drugs Market Volume K Unit Forecast, by Drug Type 2019 & 2032
- Table 81: Global Neurological Disorder Drugs Market Revenue Million Forecast, by Distribution Channels 2019 & 2032
- Table 82: Global Neurological Disorder Drugs Market Volume K Unit Forecast, by Distribution Channels 2019 & 2032
- Table 83: Global Neurological Disorder Drugs Market Revenue Million Forecast, by Country 2019 & 2032
- Table 84: Global Neurological Disorder Drugs Market Volume K Unit Forecast, by Country 2019 & 2032
- Table 85: Germany Neurological Disorder Drugs Market Revenue (Million) Forecast, by Application 2019 & 2032
- Table 86: Germany Neurological Disorder Drugs Market Volume (K Unit) Forecast, by Application 2019 & 2032
- Table 87: United Kingdom Neurological Disorder Drugs Market Revenue (Million) Forecast, by Application 2019 & 2032
- Table 88: United Kingdom Neurological Disorder Drugs Market Volume (K Unit) Forecast, by Application 2019 & 2032
- Table 89: France Neurological Disorder Drugs Market Revenue (Million) Forecast, by Application 2019 & 2032
- Table 90: France Neurological Disorder Drugs Market Volume (K Unit) Forecast, by Application 2019 & 2032
- Table 91: Italy Neurological Disorder Drugs Market Revenue (Million) Forecast, by Application 2019 & 2032
- Table 92: Italy Neurological Disorder Drugs Market Volume (K Unit) Forecast, by Application 2019 & 2032
- Table 93: Spain Neurological Disorder Drugs Market Revenue (Million) Forecast, by Application 2019 & 2032
- Table 94: Spain Neurological Disorder Drugs Market Volume (K Unit) Forecast, by Application 2019 & 2032
- Table 95: Rest of Europe Neurological Disorder Drugs Market Revenue (Million) Forecast, by Application 2019 & 2032
- Table 96: Rest of Europe Neurological Disorder Drugs Market Volume (K Unit) Forecast, by Application 2019 & 2032
- Table 97: Global Neurological Disorder Drugs Market Revenue Million Forecast, by Disorders 2019 & 2032
- Table 98: Global Neurological Disorder Drugs Market Volume K Unit Forecast, by Disorders 2019 & 2032
- Table 99: Global Neurological Disorder Drugs Market Revenue Million Forecast, by Drug Type 2019 & 2032
- Table 100: Global Neurological Disorder Drugs Market Volume K Unit Forecast, by Drug Type 2019 & 2032
- Table 101: Global Neurological Disorder Drugs Market Revenue Million Forecast, by Distribution Channels 2019 & 2032
- Table 102: Global Neurological Disorder Drugs Market Volume K Unit Forecast, by Distribution Channels 2019 & 2032
- Table 103: Global Neurological Disorder Drugs Market Revenue Million Forecast, by Country 2019 & 2032
- Table 104: Global Neurological Disorder Drugs Market Volume K Unit Forecast, by Country 2019 & 2032
- Table 105: China Neurological Disorder Drugs Market Revenue (Million) Forecast, by Application 2019 & 2032
- Table 106: China Neurological Disorder Drugs Market Volume (K Unit) Forecast, by Application 2019 & 2032
- Table 107: Japan Neurological Disorder Drugs Market Revenue (Million) Forecast, by Application 2019 & 2032
- Table 108: Japan Neurological Disorder Drugs Market Volume (K Unit) Forecast, by Application 2019 & 2032
- Table 109: India Neurological Disorder Drugs Market Revenue (Million) Forecast, by Application 2019 & 2032
- Table 110: India Neurological Disorder Drugs Market Volume (K Unit) Forecast, by Application 2019 & 2032
- Table 111: Australia Neurological Disorder Drugs Market Revenue (Million) Forecast, by Application 2019 & 2032
- Table 112: Australia Neurological Disorder Drugs Market Volume (K Unit) Forecast, by Application 2019 & 2032
- Table 113: South Korea Neurological Disorder Drugs Market Revenue (Million) Forecast, by Application 2019 & 2032
- Table 114: South Korea Neurological Disorder Drugs Market Volume (K Unit) Forecast, by Application 2019 & 2032
- Table 115: Rest of Asia Pacific Neurological Disorder Drugs Market Revenue (Million) Forecast, by Application 2019 & 2032
- Table 116: Rest of Asia Pacific Neurological Disorder Drugs Market Volume (K Unit) Forecast, by Application 2019 & 2032
- Table 117: Global Neurological Disorder Drugs Market Revenue Million Forecast, by Disorders 2019 & 2032
- Table 118: Global Neurological Disorder Drugs Market Volume K Unit Forecast, by Disorders 2019 & 2032
- Table 119: Global Neurological Disorder Drugs Market Revenue Million Forecast, by Drug Type 2019 & 2032
- Table 120: Global Neurological Disorder Drugs Market Volume K Unit Forecast, by Drug Type 2019 & 2032
- Table 121: Global Neurological Disorder Drugs Market Revenue Million Forecast, by Distribution Channels 2019 & 2032
- Table 122: Global Neurological Disorder Drugs Market Volume K Unit Forecast, by Distribution Channels 2019 & 2032
- Table 123: Global Neurological Disorder Drugs Market Revenue Million Forecast, by Country 2019 & 2032
- Table 124: Global Neurological Disorder Drugs Market Volume K Unit Forecast, by Country 2019 & 2032
- Table 125: GCC Neurological Disorder Drugs Market Revenue (Million) Forecast, by Application 2019 & 2032
- Table 126: GCC Neurological Disorder Drugs Market Volume (K Unit) Forecast, by Application 2019 & 2032
- Table 127: South Africa Neurological Disorder Drugs Market Revenue (Million) Forecast, by Application 2019 & 2032
- Table 128: South Africa Neurological Disorder Drugs Market Volume (K Unit) Forecast, by Application 2019 & 2032
- Table 129: Rest of Middle East and Africa Neurological Disorder Drugs Market Revenue (Million) Forecast, by Application 2019 & 2032
- Table 130: Rest of Middle East and Africa Neurological Disorder Drugs Market Volume (K Unit) Forecast, by Application 2019 & 2032
- Table 131: Global Neurological Disorder Drugs Market Revenue Million Forecast, by Disorders 2019 & 2032
- Table 132: Global Neurological Disorder Drugs Market Volume K Unit Forecast, by Disorders 2019 & 2032
- Table 133: Global Neurological Disorder Drugs Market Revenue Million Forecast, by Drug Type 2019 & 2032
- Table 134: Global Neurological Disorder Drugs Market Volume K Unit Forecast, by Drug Type 2019 & 2032
- Table 135: Global Neurological Disorder Drugs Market Revenue Million Forecast, by Distribution Channels 2019 & 2032
- Table 136: Global Neurological Disorder Drugs Market Volume K Unit Forecast, by Distribution Channels 2019 & 2032
- Table 137: Global Neurological Disorder Drugs Market Revenue Million Forecast, by Country 2019 & 2032
- Table 138: Global Neurological Disorder Drugs Market Volume K Unit Forecast, by Country 2019 & 2032
- Table 139: Brazil Neurological Disorder Drugs Market Revenue (Million) Forecast, by Application 2019 & 2032
- Table 140: Brazil Neurological Disorder Drugs Market Volume (K Unit) Forecast, by Application 2019 & 2032
- Table 141: Argentina Neurological Disorder Drugs Market Revenue (Million) Forecast, by Application 2019 & 2032
- Table 142: Argentina Neurological Disorder Drugs Market Volume (K Unit) Forecast, by Application 2019 & 2032
- Table 143: Rest of South America Neurological Disorder Drugs Market Revenue (Million) Forecast, by Application 2019 & 2032
- Table 144: Rest of South America Neurological Disorder Drugs Market Volume (K Unit) Forecast, by Application 2019 & 2032
Frequently Asked Questions
1. What is the projected Compound Annual Growth Rate (CAGR) of the Neurological Disorder Drugs Market?
The projected CAGR is approximately 5.60%.
2. Which companies are prominent players in the Neurological Disorder Drugs Market?
Key companies in the market include Teva Pharmaceutical Industries Ltd , Merck & Co Inc, Bayer AG, Sanofi, Novartis AG, F Hoffmann-La Roche Ltd, AstraZeneca, Abbott, Johnson & Johnson Private Limited, Pfizer Inc.
3. What are the main segments of the Neurological Disorder Drugs Market?
The market segments include Disorders, Drug Type, Distribution Channels.
4. Can you provide details about the market size?
The market size is estimated to be USD XX Million as of 2022.
5. What are some drivers contributing to market growth?
High Prevalence of Neurological Diseases; Rising Awareness for Early Disease Diagnosis; Increasing Number of Research and Development for Neurological Diseases.
6. What are the notable trends driving market growth?
The Alzheimer's Disease Segment is Expected to Hold a Significant Share in the Neurological Disorders Drugs Market Over the Forecast Period.
7. Are there any restraints impacting market growth?
High Cost for Diagnosis and Treatment; Stringent Regulations Associated with the Neurological Drugs.
8. Can you provide examples of recent developments in the market?
In March 2023, the development of an oral, brain-penetrant, dual inhibitor of TYK2 and JAK1 for treating neurological illnesses was announced by Biohaven Ltd., except for the China region.
9. What pricing options are available for accessing the report?
Pricing options include single-user, multi-user, and enterprise licenses priced at USD 4750, USD 5250, and USD 8750 respectively.
10. Is the market size provided in terms of value or volume?
The market size is provided in terms of value, measured in Million and volume, measured in K Unit.
11. Are there any specific market keywords associated with the report?
Yes, the market keyword associated with the report is "Neurological Disorder Drugs Market," which aids in identifying and referencing the specific market segment covered.
12. How do I determine which pricing option suits my needs best?
The pricing options vary based on user requirements and access needs. Individual users may opt for single-user licenses, while businesses requiring broader access may choose multi-user or enterprise licenses for cost-effective access to the report.
13. Are there any additional resources or data provided in the Neurological Disorder Drugs Market report?
While the report offers comprehensive insights, it's advisable to review the specific contents or supplementary materials provided to ascertain if additional resources or data are available.
14. How can I stay updated on further developments or reports in the Neurological Disorder Drugs Market?
To stay informed about further developments, trends, and reports in the Neurological Disorder Drugs Market, consider subscribing to industry newsletters, following relevant companies and organizations, or regularly checking reputable industry news sources and publications.
Methodology
Step 1 - Identification of Relevant Samples Size from Population Database


Step 2 - Approaches for Defining Global Market Size (Value, Volume* & Price*)

Note*: In applicable scenarios
Step 3 - Data Sources
Primary Research
- Web Analytics
- Survey Reports
- Research Institute
- Latest Research Reports
- Opinion Leaders
Secondary Research
- Annual Reports
- White Paper
- Latest Press Release
- Industry Association
- Paid Database
- Investor Presentations

Step 4 - Data Triangulation
Involves using different sources of information in order to increase the validity of a study
These sources are likely to be stakeholders in a program - participants, other researchers, program staff, other community members, and so on.
Then we put all data in single framework & apply various statistical tools to find out the dynamic on the market.
During the analysis stage, feedback from the stakeholder groups would be compared to determine areas of agreement as well as areas of divergence


