
Key Insights
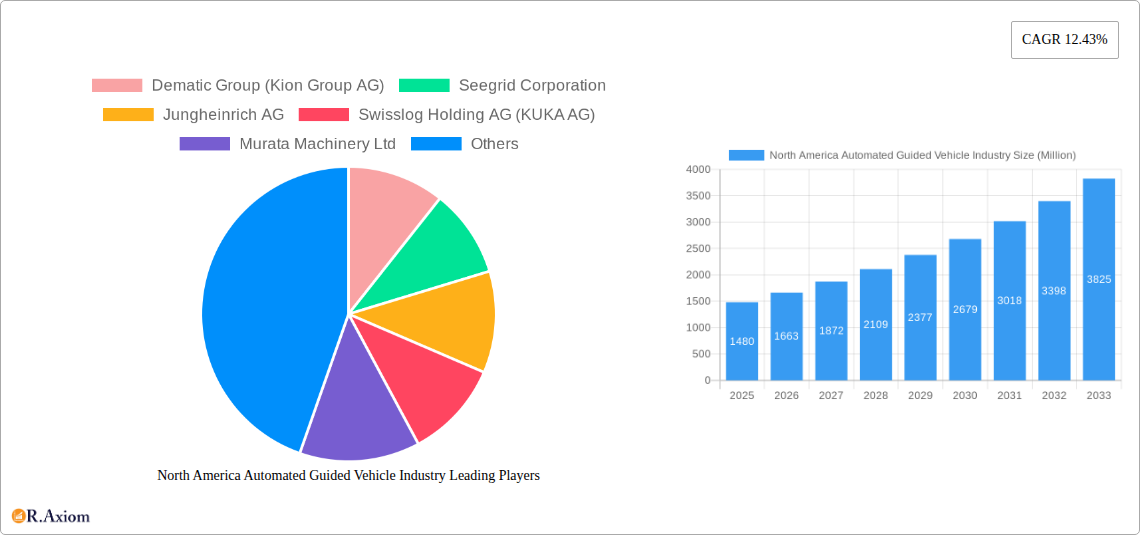
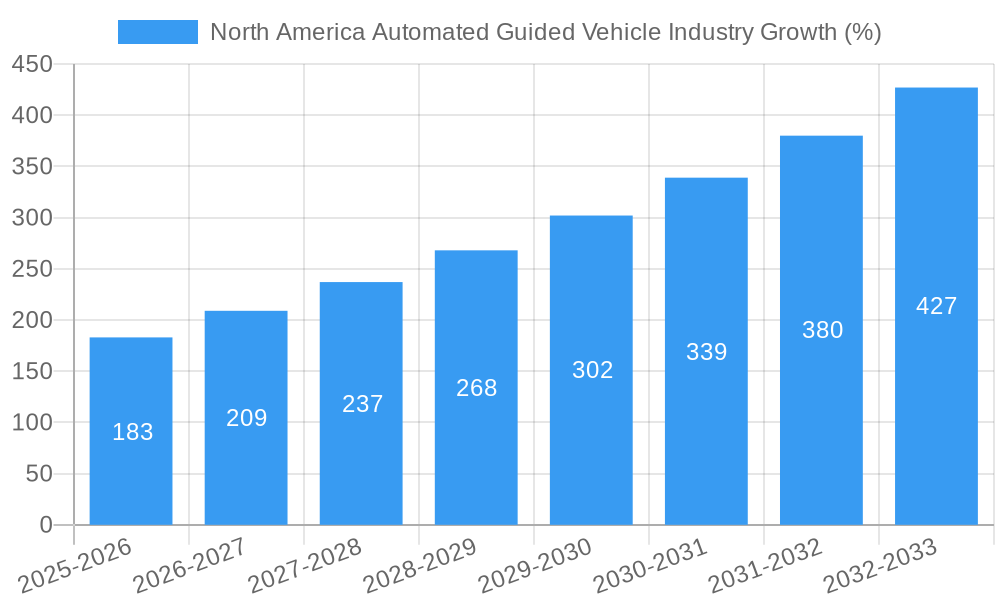
The North American Automated Guided Vehicle (AGV) industry is experiencing robust growth, projected to reach a market size of $1.48 billion in 2025 and maintain a Compound Annual Growth Rate (CAGR) of 12.43% from 2025 to 2033. This expansion is fueled by several key drivers. The increasing demand for automation in warehousing and logistics to improve efficiency and reduce labor costs is a primary factor. E-commerce boom and the subsequent need for faster order fulfillment are further stimulating adoption. Furthermore, advancements in AGV technology, including improved navigation systems, increased payload capacity, and enhanced safety features, are expanding their applicability across diverse industries. The automotive, food and beverage, and electronics sectors are major adopters, leveraging AGVs for material handling, assembly line operations, and inventory management. However, high initial investment costs and the need for skilled personnel to implement and maintain AGV systems represent significant restraints. Despite these challenges, the long-term benefits of increased productivity and reduced operational expenses are driving sustained market growth.
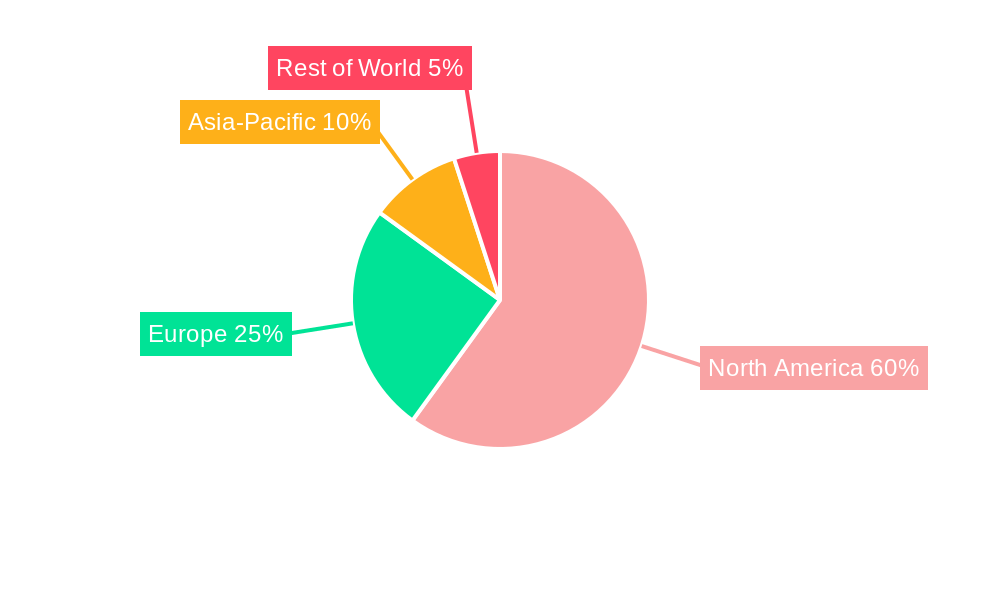
Focusing on the North American market specifically, the United States and Canada are leading the charge, driven by strong manufacturing sectors and a focus on supply chain optimization. While Mexico's market share is smaller, its proximity to the US and growing manufacturing base suggest significant future growth potential within the region. The segmentation by product type reveals a diverse market, with automated forklifts, tow tractors, and unit load AGVs currently dominating. However, specialized AGVs for assembly lines and other specific applications are witnessing increasing demand, reflecting the industry's adaptability to diverse operational requirements. Leading players in the North American AGV market include Dematic, Seegrid, Jungheinrich, Swisslog, and others, continuously innovating and competing to capture market share in this dynamic and expanding sector. The forecast period (2025-2033) anticipates continued strong growth, driven by industry trends, technological advancements, and the ongoing need for efficient material handling solutions across various sectors.
North America Automated Guided Vehicle (AGV) Industry Market Report: 2019-2033
This comprehensive report provides an in-depth analysis of the North America Automated Guided Vehicle (AGV) industry, offering valuable insights for industry stakeholders, investors, and strategic decision-makers. Covering the period from 2019 to 2033, with a focus on 2025, this report unveils market dynamics, growth drivers, challenges, and future opportunities within this rapidly evolving sector.
North America Automated Guided Vehicle Industry Market Concentration & Innovation
The North American AGV market exhibits a moderately concentrated landscape, with several key players holding significant market share. While precise market share data for each company is proprietary, Dematic Group (Kion Group AG), Seegrid Corporation, Jungheinrich AG, Swisslog Holding AG (KUKA AG), and Daifuku Co Ltd are among the leading companies, commanding a combined xx% of the market in 2025. The industry is characterized by ongoing innovation, driven by the increasing demand for automation across various sectors. Regulatory frameworks, particularly those related to safety and data privacy, play a significant role in shaping market dynamics. Product substitutes, such as manual handling systems and robotic systems, pose competitive challenges. However, the advantages of AGVs in terms of efficiency and cost-effectiveness continue to drive market growth. End-user trends, particularly the adoption of Industry 4.0 principles and the growing preference for flexible automation solutions, are influencing product development and deployment strategies. Mergers and acquisitions (M&A) activity within the industry is moderate, with deal values averaging around xx Million USD per transaction in the last five years, reflecting strategic moves to expand market reach and technological capabilities.
North America Automated Guided Vehicle Industry Industry Trends & Insights
The North American AGV market is experiencing robust growth, driven by the increasing adoption of automation across various industries. The compound annual growth rate (CAGR) is projected to be xx% during the forecast period (2025-2033). This growth is fueled by several key factors: the rising demand for enhanced efficiency and productivity in warehousing and manufacturing, the increasing need for improved safety standards in material handling, and the growing adoption of advanced technologies such as AI and machine learning to enhance AGV capabilities. The market penetration of AGVs in various end-user industries is continuously increasing, with notable growth in the automotive, e-commerce, and food & beverage sectors. Technological disruptions, including the development of autonomous mobile robots (AMRs) and the integration of AGVs with other Industry 4.0 technologies, are reshaping the competitive landscape and creating new market opportunities. Consumer preferences are shifting towards advanced features such as increased payload capacity, improved navigation systems, and enhanced safety features. Competitive dynamics are intense, with companies focusing on product innovation, strategic partnerships, and expansion into new geographical markets.
Dominant Markets & Segments in North America Automated Guided Vehicle Industry
Dominant Region: The United States holds the largest market share in North America, driven by a robust manufacturing sector, a large e-commerce market, and substantial government investments in automation technologies. Canada represents a significant, albeit smaller, market segment.
Dominant Product Type: Automated Forklifts and Automated Tow/Tractor/Tugs currently dominate the market due to their versatility and wide applicability across various industries. However, there is significant growth potential in Special Purpose AGVs as industries increasingly customize solutions for unique applications.
Dominant End-user Industry: The automotive industry currently leads in AGV adoption due to its high volume of material handling operations and the need for efficient logistics. However, rapid growth is seen in e-commerce and the food and beverage industries.
Key Drivers:
- Economic Policies: Government incentives and grants supporting automation and manufacturing are crucial drivers in the US.
- Infrastructure: Well-developed infrastructure and logistics networks in both the US and Canada facilitate AGV deployment.
- Labor Costs: Rising labor costs in North America are incentivizing businesses to automate.
The United States’ dominance is largely due to its mature industrial base, and high demand for efficient supply chain solutions, and favorable regulatory environment promoting automation. Canada's market is growing steadily, though at a slightly slower pace compared to the US, driven by a similar set of factors but on a smaller scale.
North America Automated Guided Vehicle Industry Product Developments
Recent product innovations focus on enhancing AGV autonomy, navigation precision, and payload capacity. The integration of advanced sensors, AI-powered path planning, and improved safety features are key technological trends. New AGVs are tailored for specific industrial settings, offering competitive advantages through increased efficiency, reduced operational costs, and improved safety protocols. The market fit for these advancements is strong, particularly within demanding environments like warehousing, manufacturing, and distribution centers.
Report Scope & Segmentation Analysis
This report segments the North American AGV market across three key dimensions:
By Product Type: Automated Forklift, Automated Tow/Tractor/Tugs, Unit Load AGVs, Assembly Line AGVs, and Special Purpose AGVs. Each segment is analyzed considering market size, growth projections, and competitive landscape. The Automated Forklift and Tow Tractor segments currently hold the largest market share.
By End-user Industry: Food and Beverage, Automotive, Retail, Electronics and Electricals, General Manufacturing, Pharmaceuticals, and Other End-user Industries. The automotive industry is currently the largest consumer of AGVs, but other industries are rapidly adopting automation.
By Country: United States and Canada. The United States holds a significantly larger market share than Canada, driven by factors such as greater industrial output and a larger e-commerce market.
Key Drivers of North America Automated Guided Vehicle Industry Growth
The growth of the North American AGV industry is propelled by several key factors: the increasing demand for improved efficiency and productivity in logistics and manufacturing; the need to reduce labor costs; the growing adoption of Industry 4.0 technologies, including AI and machine learning; and government initiatives promoting automation and technological advancement. The expanding e-commerce sector, necessitating advanced warehousing solutions, is another significant driver.
Challenges in the North America Automated Guided Vehicle Industry Sector
Significant challenges include the high initial investment costs associated with AGV implementation; the need for skilled labor for installation and maintenance; potential supply chain disruptions affecting component availability; and ongoing concerns about workplace safety and data security. These factors can hinder market penetration, particularly among smaller businesses.
Emerging Opportunities in North America Automated Guided Vehicle Industry
Emerging opportunities lie in the development of more sophisticated autonomous mobile robots (AMRs) with improved navigation and obstacle avoidance capabilities; the integration of AGVs with warehouse management systems (WMS) and enterprise resource planning (ERP) systems; and the expansion into new application areas such as healthcare and agriculture. The rise of collaborative robots (cobots) working alongside AGVs presents an exciting future direction.
Leading Players in the North America Automated Guided Vehicle Industry Market
- Dematic Group (Kion Group AG)
- Seegrid Corporation
- Jungheinrich AG
- Swisslog Holding AG (KUKA AG)
- Murata Machinery Ltd
- System Logistics SPA
- Toyota Material Handling
- SSI Schaefer AG
- Amerden Inc
- Transbotics Corporation
- Daifuku Co Ltd
- John Bean Technologies (JBT) Corporation
Key Developments in North America Automated Guided Vehicle Industry Industry
- June 2023: Kivnon's partnership with TAP expands AGV/AMR market reach.
- May 2023: ResGreen Group launches the BigBuddy heavy-duty AGV.
- October 2022: Daifuku opens a new manufacturing facility in Michigan, boosting AGV production capacity.
- September 2022: Yanmar America Corporation implements an advanced AGV solution, significantly increasing production capacity.
Strategic Outlook for North America Automated Guided Vehicle Industry Market
The North American AGV market is poised for continued growth, fueled by ongoing technological advancements, rising demand for automation across various sectors, and supportive government policies. The integration of artificial intelligence, machine learning, and advanced sensor technologies will play a crucial role in shaping the future of AGVs, creating opportunities for improved efficiency, safety, and flexibility in material handling operations. New market applications and the development of collaborative robots will further drive industry expansion.
North America Automated Guided Vehicle Industry Segmentation
-
1. Product Type
- 1.1. Automated Forklift
- 1.2. Automated Tow/Tractor/Tugs
- 1.3. Unit Load
- 1.4. Assembly Line
- 1.5. Special Purpose
-
2. End-user Industry
- 2.1. Food and Beverage
- 2.2. Automotive
- 2.3. Retail
- 2.4. Electronics and Electricals
- 2.5. General Manufacturing
- 2.6. Pharmaceuticals
- 2.7. Other End-user Industries
North America Automated Guided Vehicle Industry Segmentation By Geography
-
1. North America
- 1.1. United States
- 1.2. Canada
- 1.3. Mexico
North America Automated Guided Vehicle Industry REPORT HIGHLIGHTS
| Aspects | Details |
|---|---|
| Study Period | 2019-2033 |
| Base Year | 2024 |
| Estimated Year | 2025 |
| Forecast Period | 2025-2033 |
| Historical Period | 2019-2024 |
| Growth Rate | CAGR of 12.43% from 2019-2033 |
| Segmentation |
|
Table of Contents
- 1. Introduction
- 1.1. Research Scope
- 1.2. Market Segmentation
- 1.3. Research Methodology
- 1.4. Definitions and Assumptions
- 2. Executive Summary
- 2.1. Introduction
- 3. Market Dynamics
- 3.1. Introduction
- 3.2. Market Drivers
- 3.2.1. Rapid Growth of E-commerce in Automation for Efficiency; Need for Automation in Maritime Applications for Improvement in Terminal Efficiency
- 3.3. Market Restrains
- 3.3.1. Limitation of Real-time Wireless Control Due to Communication Delays
- 3.4. Market Trends
- 3.4.1. Retail to Hold Major Market Share
- 4. Market Factor Analysis
- 4.1. Porters Five Forces
- 4.2. Supply/Value Chain
- 4.3. PESTEL analysis
- 4.4. Market Entropy
- 4.5. Patent/Trademark Analysis
- 5. North America Automated Guided Vehicle Industry Analysis, Insights and Forecast, 2019-2031
- 5.1. Market Analysis, Insights and Forecast - by Product Type
- 5.1.1. Automated Forklift
- 5.1.2. Automated Tow/Tractor/Tugs
- 5.1.3. Unit Load
- 5.1.4. Assembly Line
- 5.1.5. Special Purpose
- 5.2. Market Analysis, Insights and Forecast - by End-user Industry
- 5.2.1. Food and Beverage
- 5.2.2. Automotive
- 5.2.3. Retail
- 5.2.4. Electronics and Electricals
- 5.2.5. General Manufacturing
- 5.2.6. Pharmaceuticals
- 5.2.7. Other End-user Industries
- 5.3. Market Analysis, Insights and Forecast - by Region
- 5.3.1. North America
- 5.1. Market Analysis, Insights and Forecast - by Product Type
- 6. United States North America Automated Guided Vehicle Industry Analysis, Insights and Forecast, 2019-2031
- 7. Canada North America Automated Guided Vehicle Industry Analysis, Insights and Forecast, 2019-2031
- 8. Mexico North America Automated Guided Vehicle Industry Analysis, Insights and Forecast, 2019-2031
- 9. Rest of North America North America Automated Guided Vehicle Industry Analysis, Insights and Forecast, 2019-2031
- 10. Competitive Analysis
- 10.1. Market Share Analysis 2024
- 10.2. Company Profiles
- 10.2.1 Dematic Group (Kion Group AG)
- 10.2.1.1. Overview
- 10.2.1.2. Products
- 10.2.1.3. SWOT Analysis
- 10.2.1.4. Recent Developments
- 10.2.1.5. Financials (Based on Availability)
- 10.2.2 Seegrid Corporation
- 10.2.2.1. Overview
- 10.2.2.2. Products
- 10.2.2.3. SWOT Analysis
- 10.2.2.4. Recent Developments
- 10.2.2.5. Financials (Based on Availability)
- 10.2.3 Jungheinrich AG
- 10.2.3.1. Overview
- 10.2.3.2. Products
- 10.2.3.3. SWOT Analysis
- 10.2.3.4. Recent Developments
- 10.2.3.5. Financials (Based on Availability)
- 10.2.4 Swisslog Holding AG (KUKA AG)
- 10.2.4.1. Overview
- 10.2.4.2. Products
- 10.2.4.3. SWOT Analysis
- 10.2.4.4. Recent Developments
- 10.2.4.5. Financials (Based on Availability)
- 10.2.5 Murata Machinery Ltd
- 10.2.5.1. Overview
- 10.2.5.2. Products
- 10.2.5.3. SWOT Analysis
- 10.2.5.4. Recent Developments
- 10.2.5.5. Financials (Based on Availability)
- 10.2.6 System Logistics SPA
- 10.2.6.1. Overview
- 10.2.6.2. Products
- 10.2.6.3. SWOT Analysis
- 10.2.6.4. Recent Developments
- 10.2.6.5. Financials (Based on Availability)
- 10.2.7 Toyota Material Handling
- 10.2.7.1. Overview
- 10.2.7.2. Products
- 10.2.7.3. SWOT Analysis
- 10.2.7.4. Recent Developments
- 10.2.7.5. Financials (Based on Availability)
- 10.2.8 SSI Schaefer AG
- 10.2.8.1. Overview
- 10.2.8.2. Products
- 10.2.8.3. SWOT Analysis
- 10.2.8.4. Recent Developments
- 10.2.8.5. Financials (Based on Availability)
- 10.2.9 Amerden Inc
- 10.2.9.1. Overview
- 10.2.9.2. Products
- 10.2.9.3. SWOT Analysis
- 10.2.9.4. Recent Developments
- 10.2.9.5. Financials (Based on Availability)
- 10.2.10 Transbotics Corporation
- 10.2.10.1. Overview
- 10.2.10.2. Products
- 10.2.10.3. SWOT Analysis
- 10.2.10.4. Recent Developments
- 10.2.10.5. Financials (Based on Availability)
- 10.2.11 Daifuku Co Ltd
- 10.2.11.1. Overview
- 10.2.11.2. Products
- 10.2.11.3. SWOT Analysis
- 10.2.11.4. Recent Developments
- 10.2.11.5. Financials (Based on Availability)
- 10.2.12 John Bean Technologies (JBT) Corporation
- 10.2.12.1. Overview
- 10.2.12.2. Products
- 10.2.12.3. SWOT Analysis
- 10.2.12.4. Recent Developments
- 10.2.12.5. Financials (Based on Availability)
- 10.2.1 Dematic Group (Kion Group AG)
List of Figures
- Figure 1: North America Automated Guided Vehicle Industry Revenue Breakdown (Million, %) by Product 2024 & 2032
- Figure 2: North America Automated Guided Vehicle Industry Share (%) by Company 2024
List of Tables
- Table 1: North America Automated Guided Vehicle Industry Revenue Million Forecast, by Region 2019 & 2032
- Table 2: North America Automated Guided Vehicle Industry Volume K Unit Forecast, by Region 2019 & 2032
- Table 3: North America Automated Guided Vehicle Industry Revenue Million Forecast, by Product Type 2019 & 2032
- Table 4: North America Automated Guided Vehicle Industry Volume K Unit Forecast, by Product Type 2019 & 2032
- Table 5: North America Automated Guided Vehicle Industry Revenue Million Forecast, by End-user Industry 2019 & 2032
- Table 6: North America Automated Guided Vehicle Industry Volume K Unit Forecast, by End-user Industry 2019 & 2032
- Table 7: North America Automated Guided Vehicle Industry Revenue Million Forecast, by Region 2019 & 2032
- Table 8: North America Automated Guided Vehicle Industry Volume K Unit Forecast, by Region 2019 & 2032
- Table 9: North America Automated Guided Vehicle Industry Revenue Million Forecast, by Country 2019 & 2032
- Table 10: North America Automated Guided Vehicle Industry Volume K Unit Forecast, by Country 2019 & 2032
- Table 11: United States North America Automated Guided Vehicle Industry Revenue (Million) Forecast, by Application 2019 & 2032
- Table 12: United States North America Automated Guided Vehicle Industry Volume (K Unit) Forecast, by Application 2019 & 2032
- Table 13: Canada North America Automated Guided Vehicle Industry Revenue (Million) Forecast, by Application 2019 & 2032
- Table 14: Canada North America Automated Guided Vehicle Industry Volume (K Unit) Forecast, by Application 2019 & 2032
- Table 15: Mexico North America Automated Guided Vehicle Industry Revenue (Million) Forecast, by Application 2019 & 2032
- Table 16: Mexico North America Automated Guided Vehicle Industry Volume (K Unit) Forecast, by Application 2019 & 2032
- Table 17: Rest of North America North America Automated Guided Vehicle Industry Revenue (Million) Forecast, by Application 2019 & 2032
- Table 18: Rest of North America North America Automated Guided Vehicle Industry Volume (K Unit) Forecast, by Application 2019 & 2032
- Table 19: North America Automated Guided Vehicle Industry Revenue Million Forecast, by Product Type 2019 & 2032
- Table 20: North America Automated Guided Vehicle Industry Volume K Unit Forecast, by Product Type 2019 & 2032
- Table 21: North America Automated Guided Vehicle Industry Revenue Million Forecast, by End-user Industry 2019 & 2032
- Table 22: North America Automated Guided Vehicle Industry Volume K Unit Forecast, by End-user Industry 2019 & 2032
- Table 23: North America Automated Guided Vehicle Industry Revenue Million Forecast, by Country 2019 & 2032
- Table 24: North America Automated Guided Vehicle Industry Volume K Unit Forecast, by Country 2019 & 2032
- Table 25: United States North America Automated Guided Vehicle Industry Revenue (Million) Forecast, by Application 2019 & 2032
- Table 26: United States North America Automated Guided Vehicle Industry Volume (K Unit) Forecast, by Application 2019 & 2032
- Table 27: Canada North America Automated Guided Vehicle Industry Revenue (Million) Forecast, by Application 2019 & 2032
- Table 28: Canada North America Automated Guided Vehicle Industry Volume (K Unit) Forecast, by Application 2019 & 2032
- Table 29: Mexico North America Automated Guided Vehicle Industry Revenue (Million) Forecast, by Application 2019 & 2032
- Table 30: Mexico North America Automated Guided Vehicle Industry Volume (K Unit) Forecast, by Application 2019 & 2032
Frequently Asked Questions
1. What is the projected Compound Annual Growth Rate (CAGR) of the North America Automated Guided Vehicle Industry?
The projected CAGR is approximately 12.43%.
2. Which companies are prominent players in the North America Automated Guided Vehicle Industry?
Key companies in the market include Dematic Group (Kion Group AG), Seegrid Corporation, Jungheinrich AG, Swisslog Holding AG (KUKA AG), Murata Machinery Ltd, System Logistics SPA, Toyota Material Handling, SSI Schaefer AG, Amerden Inc, Transbotics Corporation, Daifuku Co Ltd, John Bean Technologies (JBT) Corporation.
3. What are the main segments of the North America Automated Guided Vehicle Industry?
The market segments include Product Type, End-user Industry.
4. Can you provide details about the market size?
The market size is estimated to be USD 1.48 Million as of 2022.
5. What are some drivers contributing to market growth?
Rapid Growth of E-commerce in Automation for Efficiency; Need for Automation in Maritime Applications for Improvement in Terminal Efficiency.
6. What are the notable trends driving market growth?
Retail to Hold Major Market Share.
7. Are there any restraints impacting market growth?
Limitation of Real-time Wireless Control Due to Communication Delays.
8. Can you provide examples of recent developments in the market?
June 2023: Kivnon partnered with TAP to distribute its automated guided vehicles (AGVs and AMRs). This move helps Kivnon tap into the growing interest in AGVs/AMRs driven by Industry 4.0's digital transformation. With TAP's broad reach and automation know-how, Kivnon can now offer autonomous vehicles to more customers and maximize their automation potential.
9. What pricing options are available for accessing the report?
Pricing options include single-user, multi-user, and enterprise licenses priced at USD 4750, USD 4950, and USD 6800 respectively.
10. Is the market size provided in terms of value or volume?
The market size is provided in terms of value, measured in Million and volume, measured in K Unit.
11. Are there any specific market keywords associated with the report?
Yes, the market keyword associated with the report is "North America Automated Guided Vehicle Industry," which aids in identifying and referencing the specific market segment covered.
12. How do I determine which pricing option suits my needs best?
The pricing options vary based on user requirements and access needs. Individual users may opt for single-user licenses, while businesses requiring broader access may choose multi-user or enterprise licenses for cost-effective access to the report.
13. Are there any additional resources or data provided in the North America Automated Guided Vehicle Industry report?
While the report offers comprehensive insights, it's advisable to review the specific contents or supplementary materials provided to ascertain if additional resources or data are available.
14. How can I stay updated on further developments or reports in the North America Automated Guided Vehicle Industry?
To stay informed about further developments, trends, and reports in the North America Automated Guided Vehicle Industry, consider subscribing to industry newsletters, following relevant companies and organizations, or regularly checking reputable industry news sources and publications.
Methodology
Step 1 - Identification of Relevant Samples Size from Population Database


Step 2 - Approaches for Defining Global Market Size (Value, Volume* & Price*)

Note*: In applicable scenarios
Step 3 - Data Sources
Primary Research
- Web Analytics
- Survey Reports
- Research Institute
- Latest Research Reports
- Opinion Leaders
Secondary Research
- Annual Reports
- White Paper
- Latest Press Release
- Industry Association
- Paid Database
- Investor Presentations

Step 4 - Data Triangulation
Involves using different sources of information in order to increase the validity of a study
These sources are likely to be stakeholders in a program - participants, other researchers, program staff, other community members, and so on.
Then we put all data in single framework & apply various statistical tools to find out the dynamic on the market.
During the analysis stage, feedback from the stakeholder groups would be compared to determine areas of agreement as well as areas of divergence


