

Key Insights
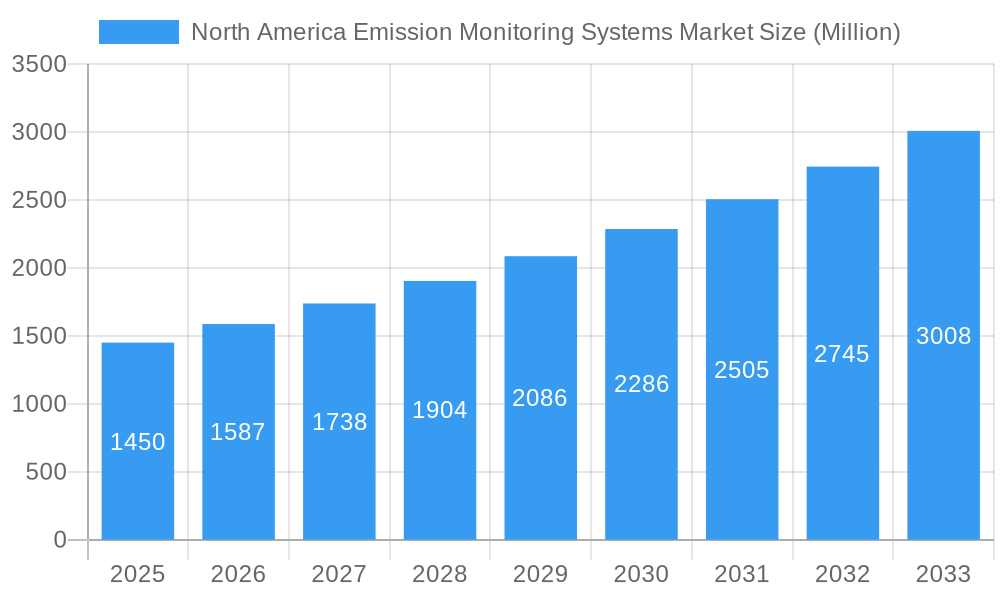
The North America emission monitoring systems market, valued at approximately $1.45 billion in 2025, is projected to experience robust growth, driven by stringent environmental regulations, increasing industrialization, and a growing focus on reducing greenhouse gas emissions. The 9.04% CAGR (Compound Annual Growth Rate) indicates a significant expansion through 2033. Key drivers include the implementation of stricter emission standards across various industries, particularly in power generation, oil and gas, and manufacturing. The increasing adoption of advanced monitoring technologies, such as continuous emission monitoring systems (CEMS) and remote sensing technologies, further fuels market growth. Furthermore, the rising awareness among businesses about the environmental and economic benefits of emission reduction is encouraging proactive adoption of these systems. Growth is further propelled by the increasing demand for real-time data analysis and improved process optimization capabilities offered by these systems.
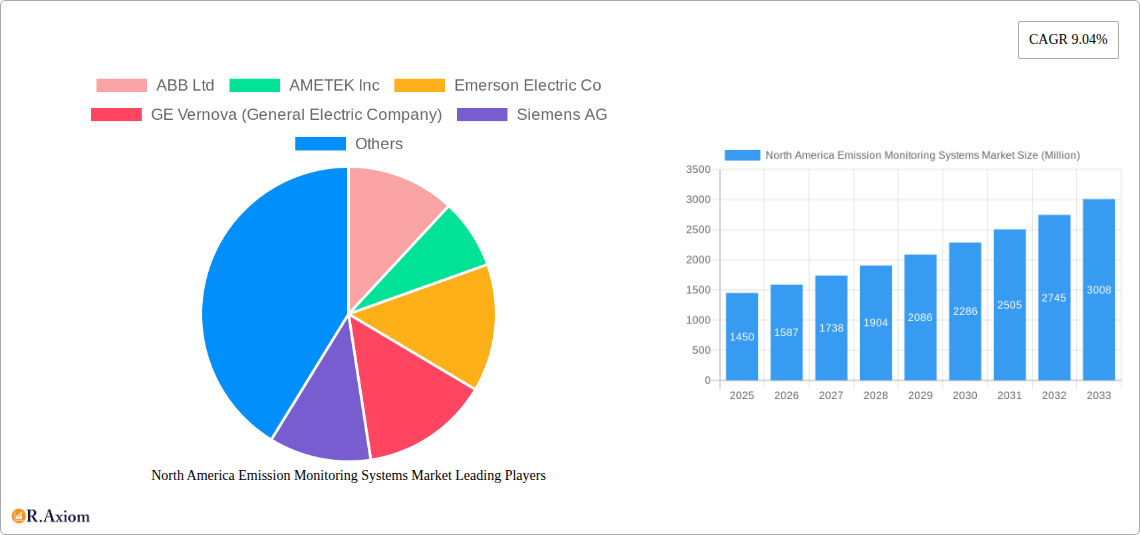
North America Emission Monitoring Systems Market Market Size (In Billion)
However, market growth may face some restraints. High initial investment costs associated with the installation and maintenance of emission monitoring systems can be a barrier for smaller businesses. Additionally, the complexity of integrating these systems into existing infrastructure can pose challenges. Despite these challenges, the long-term benefits of reduced penalties, improved operational efficiency, and enhanced environmental compliance outweigh the initial costs, ensuring continued market expansion. The competitive landscape is marked by the presence of several established players, including ABB Ltd, AMETEK Inc, Emerson Electric Co, and Siemens AG, along with several specialized technology providers. These companies are continuously innovating to offer more efficient and cost-effective solutions, further driving market penetration. The market segmentation is likely to encompass different technologies (e.g., CEMS, extractive, non-extractive), industries served, and geographic regions within North America, each experiencing varying growth rates based on regulatory pressures and industrial activity.
North America Emission Monitoring Systems Market Company Market Share
This comprehensive report provides an in-depth analysis of the North America Emission Monitoring Systems market, offering valuable insights for stakeholders across the industry. The study period covers 2019-2033, with 2025 as the base and estimated year, and a forecast period of 2025-2033. The historical period analyzed is 2019-2024. This report is crucial for understanding market trends, competitive dynamics, and future growth opportunities in this rapidly evolving sector.
North America Emission Monitoring Systems Market Concentration & Innovation
The North American Emission Monitoring Systems market exhibits a moderately concentrated landscape, with several major players holding significant market share. However, the presence of numerous smaller, specialized companies fosters innovation and competition. Market share data reveals that the top 5 players collectively hold approximately xx% of the market in 2025, with ABB Ltd, AMETEK Inc, Emerson Electric Co, and Siemens AG among the leading contenders. The market is driven by stringent environmental regulations, increasing industrial emissions, and the growing adoption of advanced monitoring technologies. Regulatory frameworks such as the Clean Air Act and other state-level environmental regulations significantly impact market growth. Product substitutes, while limited, include manual sampling and analysis methods, but these are increasingly being replaced by automated and more accurate emission monitoring systems. End-user trends favor real-time monitoring and data analytics capabilities for improved efficiency and regulatory compliance. M&A activity is a key driver of market consolidation and technological advancement. Recent significant deals, including ABB's acquisition of Fodisch Group (August 2024), highlight the strategic importance of consolidation and expansion within the sector. The estimated value of M&A deals within the past 5 years totals approximately $xx Million.
- Market Concentration: Top 5 players hold approximately xx% of the market share (2025).
- Innovation Drivers: Stringent environmental regulations, technological advancements, and demand for real-time data analysis.
- Regulatory Frameworks: Clean Air Act and other state-level regulations play a pivotal role.
- M&A Activity: Significant deals like ABB's acquisition of Fodisch Group demonstrate industry consolidation.
North America Emission Monitoring Systems Market Industry Trends & Insights
The North America Emission Monitoring Systems market is experiencing robust growth, driven by several key factors. The market is projected to register a CAGR of xx% during the forecast period (2025-2033). This growth is fueled by the increasing stringency of environmental regulations, particularly concerning greenhouse gas emissions. The rising industrialization and urbanization across North America also contribute significantly to market expansion. Technological disruptions, such as the development of advanced sensors, AI-powered analytics, and the Internet of Things (IoT) integration, are revolutionizing emission monitoring capabilities. Consumer preferences are shifting towards solutions that provide real-time data, enhanced accuracy, and remote monitoring capabilities. Competitive dynamics are characterized by both intense competition among established players and the emergence of new entrants with innovative technologies. Market penetration of advanced monitoring systems is steadily increasing, with a projected xx% market penetration by 2033, compared to xx% in 2025.
Dominant Markets & Segments in North America Emission Monitoring Systems Market
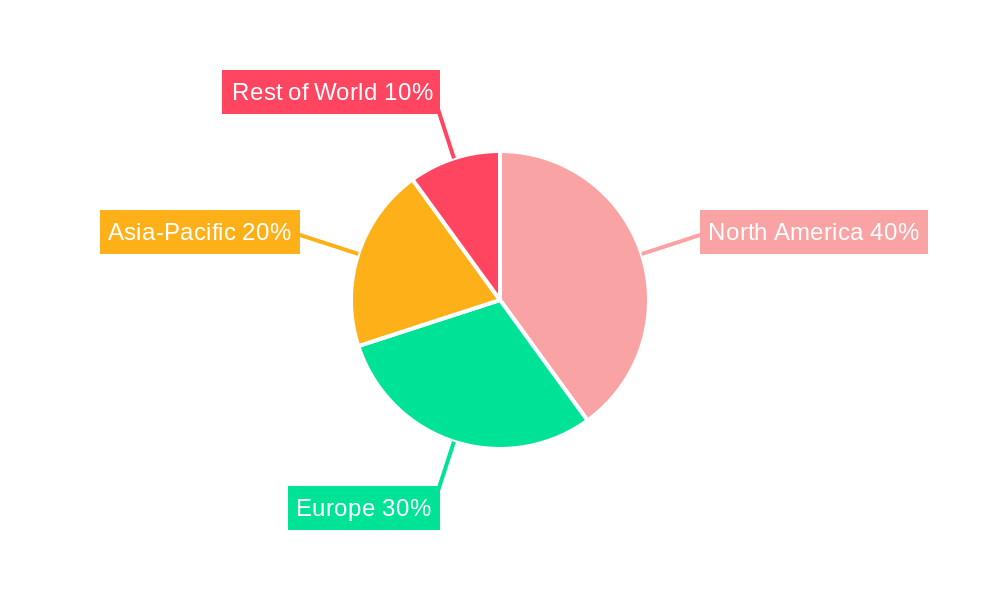
The power generation sector is the dominant segment in the North America Emission Monitoring Systems market, driven by stringent emission regulations and the need for continuous monitoring of power plants. The oil and gas sector is another key segment, owing to the substantial environmental footprint of operations and the requirements for stringent emission control. Geographically, the United States constitutes the largest market, followed by Canada and Mexico.
Key Drivers for US Dominance:
- Stringent environmental regulations at the federal and state levels.
- Large industrial base and extensive power generation infrastructure.
- Significant investments in emission control technologies.
Key Drivers for Power Generation Segment Dominance:
- Stringent emission standards for power plants.
- Growing need for continuous emission monitoring.
- Adoption of advanced monitoring technologies to improve efficiency.
Key Drivers for Oil and Gas Segment Dominance:
- Strict regulations governing emissions from oil and gas operations.
- Growing awareness of the environmental impact of the industry.
- Increasing demand for reliable and accurate emission monitoring solutions.
North America Emission Monitoring Systems Market Product Developments
The North America Emission Monitoring Systems (EMS) market is witnessing a surge in innovative product developments aimed at bolstering accuracy, minimizing operational downtime through reduced maintenance, and seamlessly integrating sophisticated data analytics. Key advancements include the proliferation of highly precise portable and mobile EMS solutions for flexible deployment, alongside robust cloud-based data management platforms that facilitate real-time access and analysis. Furthermore, the integration of Artificial Intelligence (AI) is revolutionizing predictive maintenance, enabling proactive identification and mitigation of potential system failures. Emerging applications are expanding the market's reach into critical areas such as maritime emissions monitoring, crucial for international shipping regulations, and industrial process optimization, where precise emissions data can lead to significant efficiency gains and cost reductions. These cutting-edge developments are not only instrumental in achieving stringent environmental compliance but also in driving down operational expenditures and elevating overall environmental performance, thereby equipping companies with a decisive competitive advantage in this dynamic market.
Report Scope & Segmentation Analysis
This comprehensive report meticulously analyzes the North America Emission Monitoring Systems market, offering a detailed segmentation across several key dimensions. The market is bifurcated by technology, encompassing prominent categories such as extractive, in-situ, and other specialized monitoring techniques. Further segmentation is provided by application, with in-depth analysis of sectors including power generation, oil & gas, manufacturing, transportation, and a broad spectrum of other industries. Geographically, the report segments the market into the United States, Canada, and Mexico. For each identified segment, the report provides a thorough examination of market size, projected growth trajectories, and prevailing competitive landscapes. Additionally, the market is further categorized by distinct end-user industries to offer a granular understanding of adoption patterns and specific market demands.
Key Drivers of North America Emission Monitoring Systems Market Growth
The expansion of the North America Emission Monitoring Systems market is propelled by a confluence of significant factors:
- Stringent Environmental Regulations: An ever-tightening regulatory framework across North America, mandating lower emission thresholds and more rigorous monitoring protocols, is a primary catalyst for the adoption of advanced EMS solutions.
- Technological Advancements: Continuous innovation in sensor technologies, coupled with the integration of sophisticated data analytics, the Internet of Things (IoT), and AI, are significantly enhancing the accuracy, efficiency, and scope of emission monitoring capabilities.
- Rising Industrialization and Urbanization: The sustained growth in industrial activities and the increasing concentration of populations in urban centers directly correlate with higher emission levels, thus necessitating robust emission control and monitoring systems.
- Growing Awareness of Environmental Concerns: A heightened public and corporate consciousness regarding the detrimental impacts of pollution and climate change is fostering a greater commitment to environmental stewardship and driving demand for transparent and effective emission management.
Challenges in the North America Emission Monitoring Systems Market Sector
The market faces certain challenges:
- High Initial Investment Costs: Advanced systems can be expensive, limiting adoption for smaller businesses.
- Complexity of Regulations: Navigating diverse and evolving regulatory landscapes can be complex.
- Maintenance and Calibration Requirements: Ongoing maintenance and calibration are necessary for accuracy.
- Data Security Concerns: Safeguarding sensitive emission data requires robust security measures.
Emerging Opportunities in North America Emission Monitoring Systems Market
The North America Emission Monitoring Systems market is ripe with emerging opportunities, including:
- Expansion into New Markets: Significant growth potential lies in the increasing adoption of EMS in nascent sectors such as maritime shipping, which faces growing international pressure to monitor and reduce emissions, and the renewable energy sector, where monitoring is crucial for operational efficiency and regulatory compliance.
- Development of Next-Generation Technologies: The ongoing evolution of Artificial Intelligence (AI) and machine learning algorithms, alongside breakthroughs in miniaturized and highly sensitive sensor technology, presents an opportunity for the development of more intelligent, cost-effective, and high-performance monitoring systems.
- Integration with Data Analytics Platforms: The burgeoning trend of integrating EMS with advanced data analytics and visualization platforms offers substantial opportunities for providing deeper insights into emission patterns, enabling more informed decision-making, predictive capabilities, and streamlined regulatory reporting.
Leading Players in the North America Emission Monitoring Systems Market Market
- ABB Ltd
- AMETEK Inc
- Emerson Electric Co
- GE Vernova (General Electric Company)
- Siemens AG
- Horiba Ltd
- Rockwell Automation Inc
- Sick AG
- Teledyne Monitor Labs Inc (Teledyne Technologies Inc)
- Thermo Fisher Scientific Inc
- Fuji Electric Co Ltd
- Durag Group
- Intertek Group PLC
- MKS Instruments Inc
- Gasmet Technologies oy (Nederman Group)
- *List Not Exhaustive
Key Developments in North America Emission Monitoring Systems Market Industry
- August 2024: ABB acquires Fodisch Group, strengthening its CEMS offerings and technological leadership. This significantly enhances ABB's market position and product portfolio within the CEMS sector.
- July 2024: SICK AG leads a consortium launching DIVMALDA, a project focused on automated, verified real-time measurement of ship emissions. This initiative has the potential to reshape maritime emission monitoring and reporting.
Strategic Outlook for North America Emission Monitoring Systems Market Market
The North America Emission Monitoring Systems market is poised for continued growth, driven by sustained technological advancements, tightening environmental regulations, and increasing awareness of environmental issues. The integration of AI and IoT will further enhance the capabilities of emission monitoring systems, creating new opportunities for market expansion and innovation. Focus on developing cost-effective and user-friendly solutions will be crucial for wider market adoption. The market's future potential rests on the ability of companies to leverage these trends and deliver solutions that address the evolving needs of various industries and regulatory environments.
North America Emission Monitoring Systems Market Segmentation
-
1. Component
- 1.1. Hardware
- 1.2. Software
- 1.3. Services
-
2. End-user Industry
- 2.1. Oil and Gas
- 2.2. Metals and Mining
- 2.3. Pharmaceutical
- 2.4. Power Generation
- 2.5. Chemicals
- 2.6. Pulp & Paper
- 2.7. Cement
- 2.8. Other End-users
North America Emission Monitoring Systems Market Segmentation By Geography
-
1. North America
- 1.1. United States
- 1.2. Canada
- 1.3. Mexico
North America Emission Monitoring Systems Market Regional Market Share
Geographic Coverage of North America Emission Monitoring Systems Market
North America Emission Monitoring Systems Market REPORT HIGHLIGHTS
| Aspects | Details |
|---|---|
| Study Period | 2020-2034 |
| Base Year | 2025 |
| Estimated Year | 2026 |
| Forecast Period | 2026-2034 |
| Historical Period | 2020-2025 |
| Growth Rate | CAGR of 9.04% from 2020-2034 |
| Segmentation |
|
Table of Contents
- 1. Introduction
- 1.1. Research Scope
- 1.2. Market Segmentation
- 1.3. Research Objective
- 1.4. Definitions and Assumptions
- 2. Executive Summary
- 2.1. Market Snapshot
- 3. Market Dynamics
- 3.1. Market Drivers
- 3.2. Market Restrains
- 3.3. Market Trends
- 3.4. Market Opportunities
- 4. Market Factor Analysis
- 4.1. Porters Five Forces
- 4.1.1. Bargaining Power of Suppliers
- 4.1.2. Bargaining Power of Buyers
- 4.1.3. Threat of New Entrants
- 4.1.4. Threat of Substitutes
- 4.1.5. Competitive Rivalry
- 4.2. PESTEL analysis
- 4.3. BCG Analysis
- 4.3.1. Stars (High Growth, High Market Share)
- 4.3.2. Cash Cows (Low Growth, High Market Share)
- 4.3.3. Question Mark (High Growth, Low Market Share)
- 4.3.4. Dogs (Low Growth, Low Market Share)
- 4.4. Ansoff Matrix Analysis
- 4.5. Supply Chain Analysis
- 4.6. Regulatory Landscape
- 4.7. Current Market Potential and Opportunity Assessment (TAM–SAM–SOM Framework)
- 4.8. RAX Analyst Note
- 4.1. Porters Five Forces
- 5. Market Analysis, Insights and Forecast 2021-2033
- 5.1. Market Analysis, Insights and Forecast - by Component
- 5.1.1. Hardware
- 5.1.2. Software
- 5.1.3. Services
- 5.2. Market Analysis, Insights and Forecast - by End-user Industry
- 5.2.1. Oil and Gas
- 5.2.2. Metals and Mining
- 5.2.3. Pharmaceutical
- 5.2.4. Power Generation
- 5.2.5. Chemicals
- 5.2.6. Pulp & Paper
- 5.2.7. Cement
- 5.2.8. Other End-users
- 5.3. Market Analysis, Insights and Forecast - by Region
- 5.3.1. North America
- 5.1. Market Analysis, Insights and Forecast - by Component
- 6. North America Emission Monitoring Systems Market Analysis, Insights and Forecast, 2021-2033
- 6.1. Market Analysis, Insights and Forecast - by Component
- 6.1.1. Hardware
- 6.1.2. Software
- 6.1.3. Services
- 6.2. Market Analysis, Insights and Forecast - by End-user Industry
- 6.2.1. Oil and Gas
- 6.2.2. Metals and Mining
- 6.2.3. Pharmaceutical
- 6.2.4. Power Generation
- 6.2.5. Chemicals
- 6.2.6. Pulp & Paper
- 6.2.7. Cement
- 6.2.8. Other End-users
- 6.1. Market Analysis, Insights and Forecast - by Component
- 7. Competitive Analysis
- 7.1. Company Profiles
- 7.1.1 ABB Ltd
- 7.1.1.1. Company Overview
- 7.1.1.2. Products
- 7.1.1.3. Company Financials
- 7.1.1.4. SWOT Analysis
- 7.1.2 AMETEK Inc
- 7.1.2.1. Company Overview
- 7.1.2.2. Products
- 7.1.2.3. Company Financials
- 7.1.2.4. SWOT Analysis
- 7.1.3 Emerson Electric Co
- 7.1.3.1. Company Overview
- 7.1.3.2. Products
- 7.1.3.3. Company Financials
- 7.1.3.4. SWOT Analysis
- 7.1.4 GE Vernova (General Electric Company)
- 7.1.4.1. Company Overview
- 7.1.4.2. Products
- 7.1.4.3. Company Financials
- 7.1.4.4. SWOT Analysis
- 7.1.5 Siemens AG
- 7.1.5.1. Company Overview
- 7.1.5.2. Products
- 7.1.5.3. Company Financials
- 7.1.5.4. SWOT Analysis
- 7.1.6 Horiba Ltd
- 7.1.6.1. Company Overview
- 7.1.6.2. Products
- 7.1.6.3. Company Financials
- 7.1.6.4. SWOT Analysis
- 7.1.7 Rockwell Automation Inc
- 7.1.7.1. Company Overview
- 7.1.7.2. Products
- 7.1.7.3. Company Financials
- 7.1.7.4. SWOT Analysis
- 7.1.8 Sick AG
- 7.1.8.1. Company Overview
- 7.1.8.2. Products
- 7.1.8.3. Company Financials
- 7.1.8.4. SWOT Analysis
- 7.1.9 Teledyne Monitor Labs Inc (Teledyne Technologies Inc )
- 7.1.9.1. Company Overview
- 7.1.9.2. Products
- 7.1.9.3. Company Financials
- 7.1.9.4. SWOT Analysis
- 7.1.10 Thermo Fisher Scientific Inc
- 7.1.10.1. Company Overview
- 7.1.10.2. Products
- 7.1.10.3. Company Financials
- 7.1.10.4. SWOT Analysis
- 7.1.11 Fuji Electric Co Ltd
- 7.1.11.1. Company Overview
- 7.1.11.2. Products
- 7.1.11.3. Company Financials
- 7.1.11.4. SWOT Analysis
- 7.1.12 Durag Group
- 7.1.12.1. Company Overview
- 7.1.12.2. Products
- 7.1.12.3. Company Financials
- 7.1.12.4. SWOT Analysis
- 7.1.13 Intertek Group PLC
- 7.1.13.1. Company Overview
- 7.1.13.2. Products
- 7.1.13.3. Company Financials
- 7.1.13.4. SWOT Analysis
- 7.1.14 MKS Instruments Inc
- 7.1.14.1. Company Overview
- 7.1.14.2. Products
- 7.1.14.3. Company Financials
- 7.1.14.4. SWOT Analysis
- 7.1.15 Gasmet Technologies oy (Nederman Group)*List Not Exhaustive 7 2 List of Vendors7 3 Vendor Positioning Analysi
- 7.1.15.1. Company Overview
- 7.1.15.2. Products
- 7.1.15.3. Company Financials
- 7.1.15.4. SWOT Analysis
- 7.1.1 ABB Ltd
- 7.2. Market Entropy
- 7.2.1 Company's Key Areas Served
- 7.2.2 Recent Developments
- 7.3. Company Market Share Analysis 2025
- 7.3.1 Top 5 Companies Market Share Analysis
- 7.3.2 Top 3 Companies Market Share Analysis
- 7.4. List of Potential Customers
- 8. Research Methodology
List of Figures
- Figure 1: North America Emission Monitoring Systems Market Revenue Breakdown (Million, %) by Product 2025 & 2033
- Figure 2: North America Emission Monitoring Systems Market Share (%) by Company 2025
List of Tables
- Table 1: North America Emission Monitoring Systems Market Revenue Million Forecast, by Component 2020 & 2033
- Table 2: North America Emission Monitoring Systems Market Volume Billion Forecast, by Component 2020 & 2033
- Table 3: North America Emission Monitoring Systems Market Revenue Million Forecast, by End-user Industry 2020 & 2033
- Table 4: North America Emission Monitoring Systems Market Volume Billion Forecast, by End-user Industry 2020 & 2033
- Table 5: North America Emission Monitoring Systems Market Revenue Million Forecast, by Region 2020 & 2033
- Table 6: North America Emission Monitoring Systems Market Volume Billion Forecast, by Region 2020 & 2033
- Table 7: North America Emission Monitoring Systems Market Revenue Million Forecast, by Component 2020 & 2033
- Table 8: North America Emission Monitoring Systems Market Volume Billion Forecast, by Component 2020 & 2033
- Table 9: North America Emission Monitoring Systems Market Revenue Million Forecast, by End-user Industry 2020 & 2033
- Table 10: North America Emission Monitoring Systems Market Volume Billion Forecast, by End-user Industry 2020 & 2033
- Table 11: North America Emission Monitoring Systems Market Revenue Million Forecast, by Country 2020 & 2033
- Table 12: North America Emission Monitoring Systems Market Volume Billion Forecast, by Country 2020 & 2033
- Table 13: United States North America Emission Monitoring Systems Market Revenue (Million) Forecast, by Application 2020 & 2033
- Table 14: United States North America Emission Monitoring Systems Market Volume (Billion) Forecast, by Application 2020 & 2033
- Table 15: Canada North America Emission Monitoring Systems Market Revenue (Million) Forecast, by Application 2020 & 2033
- Table 16: Canada North America Emission Monitoring Systems Market Volume (Billion) Forecast, by Application 2020 & 2033
- Table 17: Mexico North America Emission Monitoring Systems Market Revenue (Million) Forecast, by Application 2020 & 2033
- Table 18: Mexico North America Emission Monitoring Systems Market Volume (Billion) Forecast, by Application 2020 & 2033
Frequently Asked Questions
1. What is the projected Compound Annual Growth Rate (CAGR) of the North America Emission Monitoring Systems Market?
The projected CAGR is approximately 9.04%.
2. Which companies are prominent players in the North America Emission Monitoring Systems Market?
Key companies in the market include ABB Ltd, AMETEK Inc, Emerson Electric Co, GE Vernova (General Electric Company), Siemens AG, Horiba Ltd, Rockwell Automation Inc, Sick AG, Teledyne Monitor Labs Inc (Teledyne Technologies Inc ), Thermo Fisher Scientific Inc, Fuji Electric Co Ltd, Durag Group, Intertek Group PLC, MKS Instruments Inc, Gasmet Technologies oy (Nederman Group)*List Not Exhaustive 7 2 List of Vendors7 3 Vendor Positioning Analysi.
3. What are the main segments of the North America Emission Monitoring Systems Market?
The market segments include Component, End-user Industry.
4. Can you provide details about the market size?
The market size is estimated to be USD 1.45 Million as of 2022.
5. What are some drivers contributing to market growth?
Stringent Legal and Environmental Regulations; Increasing Health and Safety Issues.
6. What are the notable trends driving market growth?
Power Generation to Witness Major Growth.
7. Are there any restraints impacting market growth?
Stringent Legal and Environmental Regulations; Increasing Health and Safety Issues.
8. Can you provide examples of recent developments in the market?
August 2024: ABB has inked a deal to acquire the Fodisch Group, known for its advanced measurement and analysis solutions designed for the energy and industrial sectors. This move bolsters ABB's Continuous Emission Monitoring Systems (CEMS) offerings and amplifies its edge in technology and innovation. With this acquisition, ABB is set to expand its portfolio, addressing even its clientele's most stringent measurement challenges.July 2024: Digitization and Verification of Marine Live Emission Data (DIVMALDA) is the title of a groundbreaking research and development initiative spearheaded by a consortium led by SICK AG. In collaboration with its partners, SICK AG has unveiled a pioneering project focused on the automated and verified real-time measurement of ship emissions. The consortium's unified objective is to craft a solution that facilitates the real-time digital collection and official verification of ship emissions data. This innovation promises to establish the data as a trustworthy foundation for various processes, including reporting, monitoring, and emissions trading.
9. What pricing options are available for accessing the report?
Pricing options include single-user, multi-user, and enterprise licenses priced at USD 4750, USD 4950, and USD 6800 respectively.
10. Is the market size provided in terms of value or volume?
The market size is provided in terms of value, measured in Million and volume, measured in Billion.
11. Are there any specific market keywords associated with the report?
Yes, the market keyword associated with the report is "North America Emission Monitoring Systems Market," which aids in identifying and referencing the specific market segment covered.
12. How do I determine which pricing option suits my needs best?
The pricing options vary based on user requirements and access needs. Individual users may opt for single-user licenses, while businesses requiring broader access may choose multi-user or enterprise licenses for cost-effective access to the report.
13. Are there any additional resources or data provided in the North America Emission Monitoring Systems Market report?
While the report offers comprehensive insights, it's advisable to review the specific contents or supplementary materials provided to ascertain if additional resources or data are available.
14. How can I stay updated on further developments or reports in the North America Emission Monitoring Systems Market?
To stay informed about further developments, trends, and reports in the North America Emission Monitoring Systems Market, consider subscribing to industry newsletters, following relevant companies and organizations, or regularly checking reputable industry news sources and publications.
Methodology
Step 1 - Identification of Relevant Samples Size from Population Database


Step 2 - Approaches for Defining Global Market Size (Value, Volume* & Price*)

Note*: In applicable scenarios
Step 3 - Data Sources
Primary Research
- Web Analytics
- Survey Reports
- Research Institute
- Latest Research Reports
- Opinion Leaders
Secondary Research
- Annual Reports
- White Paper
- Latest Press Release
- Industry Association
- Paid Database
- Investor Presentations

Step 4 - Data Triangulation
Involves using different sources of information in order to increase the validity of a study
These sources are likely to be stakeholders in a program - participants, other researchers, program staff, other community members, and so on.
Then we put all data in single framework & apply various statistical tools to find out the dynamic on the market.
During the analysis stage, feedback from the stakeholder groups would be compared to determine areas of agreement as well as areas of divergence