
Key Insights
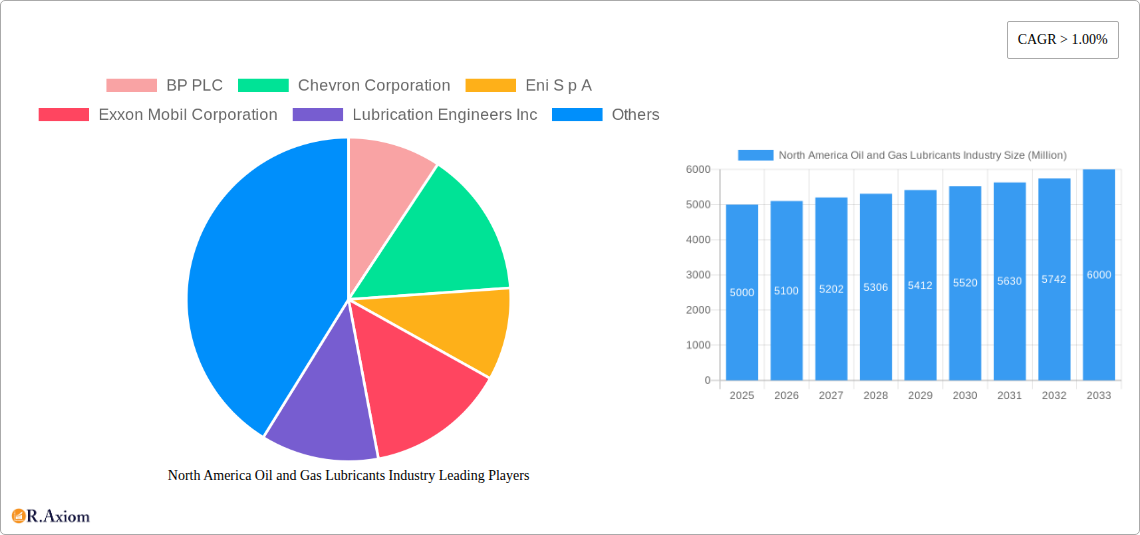
The North American oil and gas lubricants market is experiencing robust growth, driven by increasing oil and gas extraction activities and a rising demand for high-performance lubricants to enhance equipment efficiency and extend operational lifespan. The market's Compound Annual Growth Rate (CAGR) exceeding 1.00% indicates a steady and consistent expansion. Key drivers include the ongoing exploration and production of shale oil and gas, particularly in the United States and Canada, coupled with stringent environmental regulations pushing for the adoption of eco-friendly lubricants. Technological advancements in lubricant formulations, offering enhanced performance characteristics such as improved viscosity, oxidation resistance, and extreme-pressure properties, further fuel market growth. Furthermore, the increasing adoption of advanced analytical techniques for lubricant condition monitoring contributes to optimized maintenance schedules and reduced downtime, bolstering market demand. Major players like BP PLC, Chevron Corporation, and ExxonMobil Corporation, among others, are actively investing in research and development to introduce innovative lubricant solutions, creating a competitive landscape that fosters innovation and market expansion.
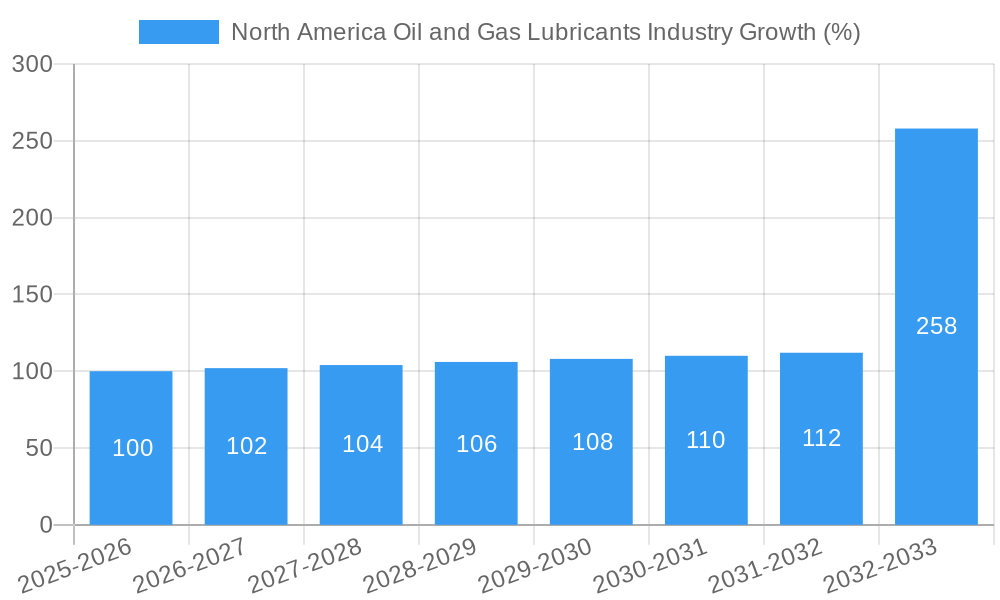
However, the market also faces certain restraints. Fluctuations in crude oil prices directly impact the cost of raw materials for lubricant manufacturing, potentially affecting profitability. Moreover, economic downturns and reduced exploration and production activities can dampen market growth. Despite these challenges, the long-term outlook for the North American oil and gas lubricants market remains positive, supported by the continued growth of the energy sector and the consistent need for high-quality lubricants to ensure efficient and sustainable operations. Market segmentation reveals strong demand across various lubricant types, catering to diverse applications within the oil and gas industry, including drilling, production, and transportation. The significant presence of established industry giants alongside specialized lubricant manufacturers indicates a diversified and dynamic market structure poised for further expansion over the forecast period (2025-2033). We estimate the North American market size in 2025 to be approximately $5 billion, with a projected market value of around $6 billion by 2033, based on a conservative CAGR of 2% considering industry trends.
North America Oil and Gas Lubricants Industry: A Comprehensive Market Report (2019-2033)
This detailed report provides a comprehensive analysis of the North America oil and gas lubricants industry, offering invaluable insights for stakeholders, investors, and industry professionals. The report covers the period from 2019 to 2033, with a focus on the 2025-2033 forecast period. It leverages rigorous research methodologies to deliver actionable intelligence and strategic recommendations.
Keywords: North America, Oil and Gas Lubricants, Market Analysis, Industry Trends, Market Size, Market Share, Growth Drivers, Challenges, Opportunities, BP PLC, Chevron Corporation, ExxonMobil, Shell PLC, Valvoline Inc, M&A, CAGR, Market Segmentation, Technological Disruptions, Regulatory Frameworks.
North America Oil and Gas Lubricants Industry Market Concentration & Innovation
The North American oil and gas lubricants market exhibits a moderately concentrated structure, dominated by multinational corporations and specialized lubricant manufacturers. Major players such as BP PLC, Chevron Corporation, Eni S.p.A, Exxon Mobil Corporation, Shell PLC, TotalEnergies SE, and Valvoline Inc hold significant market share, estimated collectively at xx%. However, several regional and specialized players also compete, driving innovation and creating niche market opportunities.
- Market Concentration: The Herfindahl-Hirschman Index (HHI) is estimated at xx, suggesting a moderately concentrated market.
- Innovation Drivers: Stringent environmental regulations, demand for higher-performance lubricants, and the need for cost-effective solutions are driving innovation in lubricant formulations, additive technology, and sustainable practices.
- Regulatory Frameworks: Regulations concerning emissions, waste disposal, and worker safety significantly impact industry practices and product development.
- Product Substitutes: The emergence of bio-based lubricants and other sustainable alternatives presents both opportunities and competitive pressures for traditional players.
- End-User Trends: The increasing adoption of advanced technologies in the oil and gas sector necessitates the development of specialized lubricants tailored to specific applications.
- M&A Activities: Significant M&A activity, such as Shell's acquisition of Allied Reliability in 2022, demonstrates the strategic importance of expanding product portfolios and market presence. The total value of M&A deals in the sector during the historical period (2019-2024) is estimated at xx Million.
North America Oil and Gas Lubricants Industry Industry Trends & Insights
The North American oil and gas lubricants market is projected to experience significant growth during the forecast period (2025-2033). Several factors contribute to this positive outlook. Increased exploration and production activities, driven by fluctuating global energy demand and prices, create a strong demand for high-quality lubricants. Technological advancements, such as the development of advanced lubricant formulations with enhanced performance characteristics, contribute to efficiency gains and reduced operational costs. The expanding industrial sector, particularly in manufacturing and transportation, also fuels demand. Consumer preference is shifting toward environmentally friendly and sustainable lubricants, prompting innovation in bio-based and biodegradable products. The market's competitive landscape is characterized by intense rivalry among established players and emerging newcomers, leading to product differentiation and price competition. The Compound Annual Growth Rate (CAGR) for the forecast period is estimated at xx%, with market penetration expected to reach xx% by 2033. The increasing adoption of digital technologies and data analytics enhances operational efficiency and predictive maintenance, further boosting market growth.
Dominant Markets & Segments in North America Oil and Gas Lubricants Industry
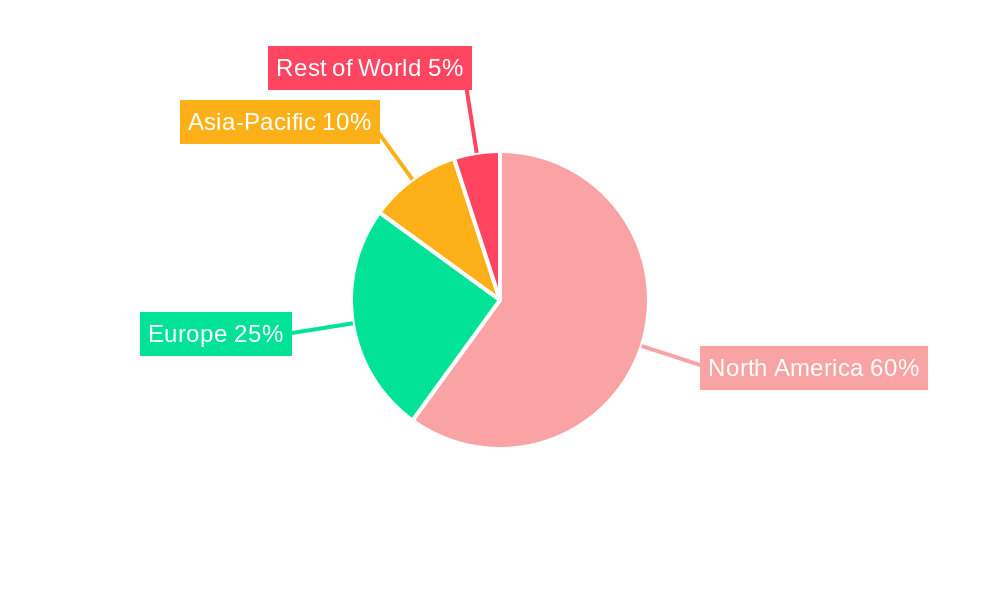
The United States constitutes the largest market within North America, driven by its significant oil and gas production activities and diversified industrial sector. Texas, Louisiana, and Oklahoma are particularly prominent, benefitting from robust energy infrastructure and significant operational activities.
- Key Drivers for US Dominance:
- Extensive Oil & Gas Infrastructure: Mature and extensive pipeline networks, refineries, and processing facilities drive demand for lubricants.
- Large Industrial Base: A diverse manufacturing sector and transportation network require substantial amounts of specialized lubricants.
- Government Policies: While subject to change, supportive energy policies have historically favored exploration and production.
Canada also plays a significant role, with its robust energy sector and focus on oil sands extraction. However, the US market remains the clear leader in terms of both volume and value. Market segmentation by lubricant type (engine oils, gear oils, greases, etc.) reveals that engine oils currently hold the largest share, followed by greases. The industrial segment accounts for the largest share of total demand, followed by the automotive sector.
North America Oil and Gas Lubricants Industry Product Developments
Recent product innovations focus on enhancing lubricant performance, extending equipment life, and improving environmental sustainability. Formulations incorporating advanced additive packages to enhance oxidation resistance, reduce friction, and improve fuel efficiency are gaining prominence. Bio-based lubricants and synthetic blends are emerging as environmentally friendly alternatives, catering to growing sustainability concerns. The industry emphasizes developing products tailored to specific applications, catering to the diverse needs of various oil and gas operations and industrial sectors. The key competitive advantage lies in offering superior performance characteristics, extended service life, cost-effectiveness, and environmental responsibility.
Report Scope & Segmentation Analysis
This report segments the North American oil and gas lubricants market across various parameters. By lubricant type, this includes engine oils, gear oils, greases, and other specialized lubricants. By application, it encompasses industrial, automotive, and other specialized applications. By end-user, it categorizes demand from oil and gas producers, refineries, transportation companies, and industrial facilities. Growth projections vary across segments, with engine oils and the industrial segment exhibiting the highest growth potential. Competitive dynamics are segment-specific, influenced by the presence of both major multinational companies and smaller specialized players. Market size estimates for each segment are provided in detail within the full report.
Key Drivers of North America Oil and Gas Lubricants Industry Growth
Several factors contribute to the growth of the North American oil and gas lubricants market. Increased energy exploration and production, driven by global demand, creates substantial demand for specialized lubricants. Technological advancements in lubricant formulations deliver improved performance, efficiency, and environmental benefits. The expansion of the industrial sector, particularly manufacturing and transportation, fuels consistent demand. Government regulations promoting energy efficiency and environmental sustainability encourage the adoption of advanced, eco-friendly lubricant solutions.
Challenges in the North America Oil and Gas Lubricants Industry Sector
The industry faces challenges such as fluctuating oil prices, impacting both raw material costs and end-user spending. Stringent environmental regulations necessitate investments in research and development to create sustainable and compliant lubricants, increasing costs. Supply chain disruptions can impact raw material availability and production schedules, potentially leading to shortages. Intense competition among major players necessitates continuous innovation and cost optimization strategies to maintain profitability and market share. These challenges have cumulatively reduced projected market growth by an estimated xx% in the past year.
Emerging Opportunities in North America Oil and Gas Lubricants Industry
The industry presents opportunities in bio-based lubricants, catering to growing sustainability concerns. Advanced lubricant formulations with enhanced performance characteristics address the demand for improved efficiency and reduced operational costs. The expanding renewable energy sector, particularly wind and solar power, presents new applications for specialized lubricants. The integration of digital technologies and data analytics enhances predictive maintenance and operational efficiency, opening new avenues for value creation.
Leading Players in the North America Oil and Gas Lubricants Industry Market
- BP PLC
- Chevron Corporation
- Eni S.p.A
- Exxon Mobil Corporation
- Lubrication Engineers Inc
- LUKOIL
- Petro-Canada Lubricants Inc
- Shell PLC
- Schlumberger Limited
- SKF
- TotalEnergies SE
- Valvoline Inc
- *List Not Exhaustive
Key Developments in North America Oil and Gas Lubricants Industry Industry
- December 2022: Shell acquired Allied Reliability, expanding its North American lubricants business.
- August 2022: Valvoline Inc. sold its global products business (including lubricants) to Saudi Aramco for USD 2.65 Billion.
Strategic Outlook for North America Oil and Gas Lubricants Industry Market
The North American oil and gas lubricants market holds significant growth potential driven by continued demand for energy, technological advancements in lubricant formulations, and growing focus on sustainability. The industry’s strategic focus should be on innovation, sustainability, and digitalization to create new value and stay ahead of the competition. Companies that invest in advanced lubricant technologies, environmentally friendly solutions, and digitalization will be well-positioned to benefit from future market opportunities.
North America Oil and Gas Lubricants Industry Segmentation
-
1. Location
- 1.1. Onshore
- 1.2. Offshore
-
2. Product Type
- 2.1. Grease
- 2.2. Coolant/Anti-freezer
- 2.3. Engine Oils
- 2.4. Hydraulic Fluids
- 2.5. Other Product Types
-
3. Sector
- 3.1. Upstream
- 3.2. Midstream
- 3.3. Downstream
-
4. Geography
- 4.1. United States
- 4.2. Canada
- 4.3. Mexico
North America Oil and Gas Lubricants Industry Segmentation By Geography
- 1. United States
- 2. Canada
- 3. Mexico
North America Oil and Gas Lubricants Industry REPORT HIGHLIGHTS
| Aspects | Details |
|---|---|
| Study Period | 2019-2033 |
| Base Year | 2024 |
| Estimated Year | 2025 |
| Forecast Period | 2025-2033 |
| Historical Period | 2019-2024 |
| Growth Rate | CAGR of > 1.00% from 2019-2033 |
| Segmentation |
|
Table of Contents
- 1. Introduction
- 1.1. Research Scope
- 1.2. Market Segmentation
- 1.3. Research Methodology
- 1.4. Definitions and Assumptions
- 2. Executive Summary
- 2.1. Introduction
- 3. Market Dynamics
- 3.1. Introduction
- 3.2. Market Drivers
- 3.2.1. Growing Interest towards Unconventional Reserves; Technological Advancement Leading to Higher Well Production Rates
- 3.3. Market Restrains
- 3.3.1. Growing Interest towards Unconventional Reserves; Technological Advancement Leading to Higher Well Production Rates
- 3.4. Market Trends
- 3.4.1. Offshore Exploration is Expected to Experience the Highest Growth
- 4. Market Factor Analysis
- 4.1. Porters Five Forces
- 4.2. Supply/Value Chain
- 4.3. PESTEL analysis
- 4.4. Market Entropy
- 4.5. Patent/Trademark Analysis
- 5. Global North America Oil and Gas Lubricants Industry Analysis, Insights and Forecast, 2019-2031
- 5.1. Market Analysis, Insights and Forecast - by Location
- 5.1.1. Onshore
- 5.1.2. Offshore
- 5.2. Market Analysis, Insights and Forecast - by Product Type
- 5.2.1. Grease
- 5.2.2. Coolant/Anti-freezer
- 5.2.3. Engine Oils
- 5.2.4. Hydraulic Fluids
- 5.2.5. Other Product Types
- 5.3. Market Analysis, Insights and Forecast - by Sector
- 5.3.1. Upstream
- 5.3.2. Midstream
- 5.3.3. Downstream
- 5.4. Market Analysis, Insights and Forecast - by Geography
- 5.4.1. United States
- 5.4.2. Canada
- 5.4.3. Mexico
- 5.5. Market Analysis, Insights and Forecast - by Region
- 5.5.1. United States
- 5.5.2. Canada
- 5.5.3. Mexico
- 5.1. Market Analysis, Insights and Forecast - by Location
- 6. United States North America Oil and Gas Lubricants Industry Analysis, Insights and Forecast, 2019-2031
- 6.1. Market Analysis, Insights and Forecast - by Location
- 6.1.1. Onshore
- 6.1.2. Offshore
- 6.2. Market Analysis, Insights and Forecast - by Product Type
- 6.2.1. Grease
- 6.2.2. Coolant/Anti-freezer
- 6.2.3. Engine Oils
- 6.2.4. Hydraulic Fluids
- 6.2.5. Other Product Types
- 6.3. Market Analysis, Insights and Forecast - by Sector
- 6.3.1. Upstream
- 6.3.2. Midstream
- 6.3.3. Downstream
- 6.4. Market Analysis, Insights and Forecast - by Geography
- 6.4.1. United States
- 6.4.2. Canada
- 6.4.3. Mexico
- 6.1. Market Analysis, Insights and Forecast - by Location
- 7. Canada North America Oil and Gas Lubricants Industry Analysis, Insights and Forecast, 2019-2031
- 7.1. Market Analysis, Insights and Forecast - by Location
- 7.1.1. Onshore
- 7.1.2. Offshore
- 7.2. Market Analysis, Insights and Forecast - by Product Type
- 7.2.1. Grease
- 7.2.2. Coolant/Anti-freezer
- 7.2.3. Engine Oils
- 7.2.4. Hydraulic Fluids
- 7.2.5. Other Product Types
- 7.3. Market Analysis, Insights and Forecast - by Sector
- 7.3.1. Upstream
- 7.3.2. Midstream
- 7.3.3. Downstream
- 7.4. Market Analysis, Insights and Forecast - by Geography
- 7.4.1. United States
- 7.4.2. Canada
- 7.4.3. Mexico
- 7.1. Market Analysis, Insights and Forecast - by Location
- 8. Mexico North America Oil and Gas Lubricants Industry Analysis, Insights and Forecast, 2019-2031
- 8.1. Market Analysis, Insights and Forecast - by Location
- 8.1.1. Onshore
- 8.1.2. Offshore
- 8.2. Market Analysis, Insights and Forecast - by Product Type
- 8.2.1. Grease
- 8.2.2. Coolant/Anti-freezer
- 8.2.3. Engine Oils
- 8.2.4. Hydraulic Fluids
- 8.2.5. Other Product Types
- 8.3. Market Analysis, Insights and Forecast - by Sector
- 8.3.1. Upstream
- 8.3.2. Midstream
- 8.3.3. Downstream
- 8.4. Market Analysis, Insights and Forecast - by Geography
- 8.4.1. United States
- 8.4.2. Canada
- 8.4.3. Mexico
- 8.1. Market Analysis, Insights and Forecast - by Location
- 9. Competitive Analysis
- 9.1. Global Market Share Analysis 2024
- 9.2. Company Profiles
- 9.2.1 BP PLC
- 9.2.1.1. Overview
- 9.2.1.2. Products
- 9.2.1.3. SWOT Analysis
- 9.2.1.4. Recent Developments
- 9.2.1.5. Financials (Based on Availability)
- 9.2.2 Chevron Corporation
- 9.2.2.1. Overview
- 9.2.2.2. Products
- 9.2.2.3. SWOT Analysis
- 9.2.2.4. Recent Developments
- 9.2.2.5. Financials (Based on Availability)
- 9.2.3 Eni S p A
- 9.2.3.1. Overview
- 9.2.3.2. Products
- 9.2.3.3. SWOT Analysis
- 9.2.3.4. Recent Developments
- 9.2.3.5. Financials (Based on Availability)
- 9.2.4 Exxon Mobil Corporation
- 9.2.4.1. Overview
- 9.2.4.2. Products
- 9.2.4.3. SWOT Analysis
- 9.2.4.4. Recent Developments
- 9.2.4.5. Financials (Based on Availability)
- 9.2.5 Lubrication Engineers Inc
- 9.2.5.1. Overview
- 9.2.5.2. Products
- 9.2.5.3. SWOT Analysis
- 9.2.5.4. Recent Developments
- 9.2.5.5. Financials (Based on Availability)
- 9.2.6 LUKOIL
- 9.2.6.1. Overview
- 9.2.6.2. Products
- 9.2.6.3. SWOT Analysis
- 9.2.6.4. Recent Developments
- 9.2.6.5. Financials (Based on Availability)
- 9.2.7 Petro-Canada Lubricants Inc
- 9.2.7.1. Overview
- 9.2.7.2. Products
- 9.2.7.3. SWOT Analysis
- 9.2.7.4. Recent Developments
- 9.2.7.5. Financials (Based on Availability)
- 9.2.8 Shell PLC
- 9.2.8.1. Overview
- 9.2.8.2. Products
- 9.2.8.3. SWOT Analysis
- 9.2.8.4. Recent Developments
- 9.2.8.5. Financials (Based on Availability)
- 9.2.9 Schlumberger Limited
- 9.2.9.1. Overview
- 9.2.9.2. Products
- 9.2.9.3. SWOT Analysis
- 9.2.9.4. Recent Developments
- 9.2.9.5. Financials (Based on Availability)
- 9.2.10 SKF
- 9.2.10.1. Overview
- 9.2.10.2. Products
- 9.2.10.3. SWOT Analysis
- 9.2.10.4. Recent Developments
- 9.2.10.5. Financials (Based on Availability)
- 9.2.11 TotalEnergies SE
- 9.2.11.1. Overview
- 9.2.11.2. Products
- 9.2.11.3. SWOT Analysis
- 9.2.11.4. Recent Developments
- 9.2.11.5. Financials (Based on Availability)
- 9.2.12 Valvoline Inc *List Not Exhaustive
- 9.2.12.1. Overview
- 9.2.12.2. Products
- 9.2.12.3. SWOT Analysis
- 9.2.12.4. Recent Developments
- 9.2.12.5. Financials (Based on Availability)
- 9.2.1 BP PLC
List of Figures
- Figure 1: Global North America Oil and Gas Lubricants Industry Revenue Breakdown (Million, %) by Region 2024 & 2032
- Figure 2: United States North America Oil and Gas Lubricants Industry Revenue (Million), by Location 2024 & 2032
- Figure 3: United States North America Oil and Gas Lubricants Industry Revenue Share (%), by Location 2024 & 2032
- Figure 4: United States North America Oil and Gas Lubricants Industry Revenue (Million), by Product Type 2024 & 2032
- Figure 5: United States North America Oil and Gas Lubricants Industry Revenue Share (%), by Product Type 2024 & 2032
- Figure 6: United States North America Oil and Gas Lubricants Industry Revenue (Million), by Sector 2024 & 2032
- Figure 7: United States North America Oil and Gas Lubricants Industry Revenue Share (%), by Sector 2024 & 2032
- Figure 8: United States North America Oil and Gas Lubricants Industry Revenue (Million), by Geography 2024 & 2032
- Figure 9: United States North America Oil and Gas Lubricants Industry Revenue Share (%), by Geography 2024 & 2032
- Figure 10: United States North America Oil and Gas Lubricants Industry Revenue (Million), by Country 2024 & 2032
- Figure 11: United States North America Oil and Gas Lubricants Industry Revenue Share (%), by Country 2024 & 2032
- Figure 12: Canada North America Oil and Gas Lubricants Industry Revenue (Million), by Location 2024 & 2032
- Figure 13: Canada North America Oil and Gas Lubricants Industry Revenue Share (%), by Location 2024 & 2032
- Figure 14: Canada North America Oil and Gas Lubricants Industry Revenue (Million), by Product Type 2024 & 2032
- Figure 15: Canada North America Oil and Gas Lubricants Industry Revenue Share (%), by Product Type 2024 & 2032
- Figure 16: Canada North America Oil and Gas Lubricants Industry Revenue (Million), by Sector 2024 & 2032
- Figure 17: Canada North America Oil and Gas Lubricants Industry Revenue Share (%), by Sector 2024 & 2032
- Figure 18: Canada North America Oil and Gas Lubricants Industry Revenue (Million), by Geography 2024 & 2032
- Figure 19: Canada North America Oil and Gas Lubricants Industry Revenue Share (%), by Geography 2024 & 2032
- Figure 20: Canada North America Oil and Gas Lubricants Industry Revenue (Million), by Country 2024 & 2032
- Figure 21: Canada North America Oil and Gas Lubricants Industry Revenue Share (%), by Country 2024 & 2032
- Figure 22: Mexico North America Oil and Gas Lubricants Industry Revenue (Million), by Location 2024 & 2032
- Figure 23: Mexico North America Oil and Gas Lubricants Industry Revenue Share (%), by Location 2024 & 2032
- Figure 24: Mexico North America Oil and Gas Lubricants Industry Revenue (Million), by Product Type 2024 & 2032
- Figure 25: Mexico North America Oil and Gas Lubricants Industry Revenue Share (%), by Product Type 2024 & 2032
- Figure 26: Mexico North America Oil and Gas Lubricants Industry Revenue (Million), by Sector 2024 & 2032
- Figure 27: Mexico North America Oil and Gas Lubricants Industry Revenue Share (%), by Sector 2024 & 2032
- Figure 28: Mexico North America Oil and Gas Lubricants Industry Revenue (Million), by Geography 2024 & 2032
- Figure 29: Mexico North America Oil and Gas Lubricants Industry Revenue Share (%), by Geography 2024 & 2032
- Figure 30: Mexico North America Oil and Gas Lubricants Industry Revenue (Million), by Country 2024 & 2032
- Figure 31: Mexico North America Oil and Gas Lubricants Industry Revenue Share (%), by Country 2024 & 2032
List of Tables
- Table 1: Global North America Oil and Gas Lubricants Industry Revenue Million Forecast, by Region 2019 & 2032
- Table 2: Global North America Oil and Gas Lubricants Industry Revenue Million Forecast, by Location 2019 & 2032
- Table 3: Global North America Oil and Gas Lubricants Industry Revenue Million Forecast, by Product Type 2019 & 2032
- Table 4: Global North America Oil and Gas Lubricants Industry Revenue Million Forecast, by Sector 2019 & 2032
- Table 5: Global North America Oil and Gas Lubricants Industry Revenue Million Forecast, by Geography 2019 & 2032
- Table 6: Global North America Oil and Gas Lubricants Industry Revenue Million Forecast, by Region 2019 & 2032
- Table 7: Global North America Oil and Gas Lubricants Industry Revenue Million Forecast, by Location 2019 & 2032
- Table 8: Global North America Oil and Gas Lubricants Industry Revenue Million Forecast, by Product Type 2019 & 2032
- Table 9: Global North America Oil and Gas Lubricants Industry Revenue Million Forecast, by Sector 2019 & 2032
- Table 10: Global North America Oil and Gas Lubricants Industry Revenue Million Forecast, by Geography 2019 & 2032
- Table 11: Global North America Oil and Gas Lubricants Industry Revenue Million Forecast, by Country 2019 & 2032
- Table 12: Global North America Oil and Gas Lubricants Industry Revenue Million Forecast, by Location 2019 & 2032
- Table 13: Global North America Oil and Gas Lubricants Industry Revenue Million Forecast, by Product Type 2019 & 2032
- Table 14: Global North America Oil and Gas Lubricants Industry Revenue Million Forecast, by Sector 2019 & 2032
- Table 15: Global North America Oil and Gas Lubricants Industry Revenue Million Forecast, by Geography 2019 & 2032
- Table 16: Global North America Oil and Gas Lubricants Industry Revenue Million Forecast, by Country 2019 & 2032
- Table 17: Global North America Oil and Gas Lubricants Industry Revenue Million Forecast, by Location 2019 & 2032
- Table 18: Global North America Oil and Gas Lubricants Industry Revenue Million Forecast, by Product Type 2019 & 2032
- Table 19: Global North America Oil and Gas Lubricants Industry Revenue Million Forecast, by Sector 2019 & 2032
- Table 20: Global North America Oil and Gas Lubricants Industry Revenue Million Forecast, by Geography 2019 & 2032
- Table 21: Global North America Oil and Gas Lubricants Industry Revenue Million Forecast, by Country 2019 & 2032
Frequently Asked Questions
1. What is the projected Compound Annual Growth Rate (CAGR) of the North America Oil and Gas Lubricants Industry?
The projected CAGR is approximately > 1.00%.
2. Which companies are prominent players in the North America Oil and Gas Lubricants Industry?
Key companies in the market include BP PLC, Chevron Corporation, Eni S p A, Exxon Mobil Corporation, Lubrication Engineers Inc, LUKOIL, Petro-Canada Lubricants Inc, Shell PLC, Schlumberger Limited, SKF, TotalEnergies SE, Valvoline Inc *List Not Exhaustive.
3. What are the main segments of the North America Oil and Gas Lubricants Industry?
The market segments include Location, Product Type, Sector, Geography.
4. Can you provide details about the market size?
The market size is estimated to be USD XX Million as of 2022.
5. What are some drivers contributing to market growth?
Growing Interest towards Unconventional Reserves; Technological Advancement Leading to Higher Well Production Rates.
6. What are the notable trends driving market growth?
Offshore Exploration is Expected to Experience the Highest Growth.
7. Are there any restraints impacting market growth?
Growing Interest towards Unconventional Reserves; Technological Advancement Leading to Higher Well Production Rates.
8. Can you provide examples of recent developments in the market?
In December 2022, Shell acquired Allied Reliability, expanding its North American lubricants business. This is in line with its global lubricants strategy of expanding its premium product offering and presence in the industrial sector and providing complementary services to provide a strong value proposition to its customers.
9. What pricing options are available for accessing the report?
Pricing options include single-user, multi-user, and enterprise licenses priced at USD 4750, USD 5250, and USD 8750 respectively.
10. Is the market size provided in terms of value or volume?
The market size is provided in terms of value, measured in Million.
11. Are there any specific market keywords associated with the report?
Yes, the market keyword associated with the report is "North America Oil and Gas Lubricants Industry," which aids in identifying and referencing the specific market segment covered.
12. How do I determine which pricing option suits my needs best?
The pricing options vary based on user requirements and access needs. Individual users may opt for single-user licenses, while businesses requiring broader access may choose multi-user or enterprise licenses for cost-effective access to the report.
13. Are there any additional resources or data provided in the North America Oil and Gas Lubricants Industry report?
While the report offers comprehensive insights, it's advisable to review the specific contents or supplementary materials provided to ascertain if additional resources or data are available.
14. How can I stay updated on further developments or reports in the North America Oil and Gas Lubricants Industry?
To stay informed about further developments, trends, and reports in the North America Oil and Gas Lubricants Industry, consider subscribing to industry newsletters, following relevant companies and organizations, or regularly checking reputable industry news sources and publications.
Methodology
Step 1 - Identification of Relevant Samples Size from Population Database


Step 2 - Approaches for Defining Global Market Size (Value, Volume* & Price*)

Note*: In applicable scenarios
Step 3 - Data Sources
Primary Research
- Web Analytics
- Survey Reports
- Research Institute
- Latest Research Reports
- Opinion Leaders
Secondary Research
- Annual Reports
- White Paper
- Latest Press Release
- Industry Association
- Paid Database
- Investor Presentations

Step 4 - Data Triangulation
Involves using different sources of information in order to increase the validity of a study
These sources are likely to be stakeholders in a program - participants, other researchers, program staff, other community members, and so on.
Then we put all data in single framework & apply various statistical tools to find out the dynamic on the market.
During the analysis stage, feedback from the stakeholder groups would be compared to determine areas of agreement as well as areas of divergence


