
Key Insights
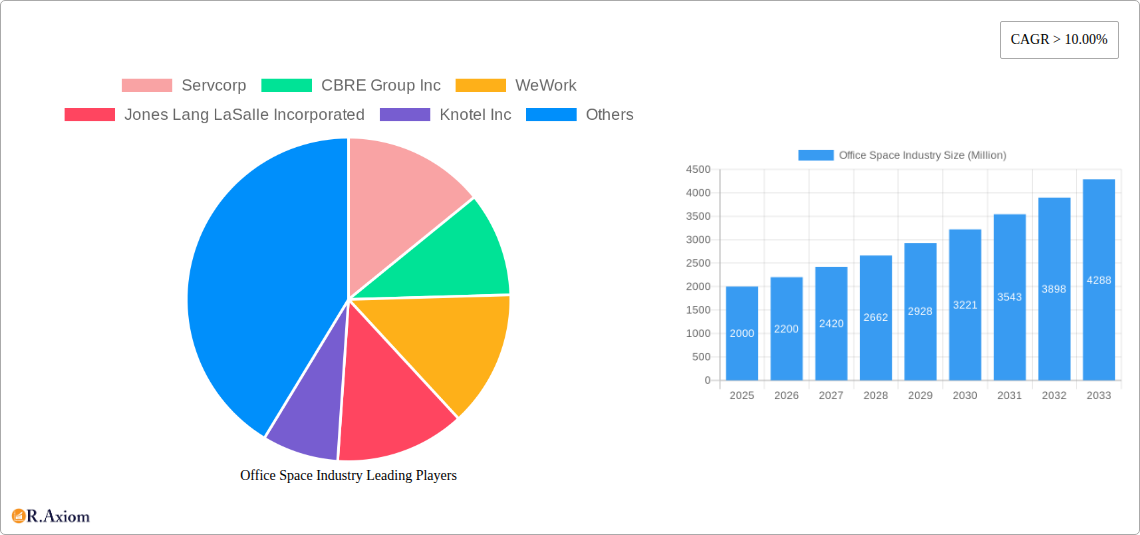
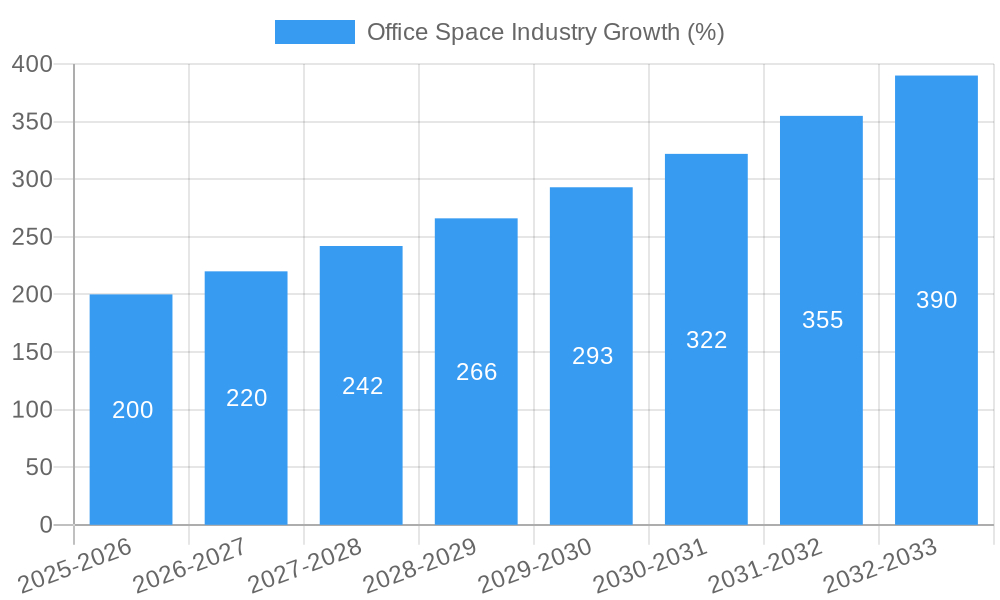
The global office space industry, currently experiencing robust growth with a Compound Annual Growth Rate (CAGR) exceeding 10%, is projected to reach significant value by 2033. Driving this expansion are several key factors. The burgeoning technology sector, coupled with the increasing demand for flexible and collaborative workspaces, fuels substantial growth in both new building constructions and retrofits. The rise of co-working spaces, a trend catering to the evolving needs of diverse businesses, contributes significantly to market expansion. Media and entertainment companies, along with retail and consumer goods firms, also represent key end-user segments driving demand. However, the industry faces certain constraints. Economic downturns can impact leasing activity, while the rise of remote work models presents a challenge to occupancy rates. Strategic location, sophisticated building amenities, and sustainable practices remain crucial for attracting and retaining tenants. The market is segmented by building type (retrofits and new buildings) and end-user (IT & Telecommunications, Media & Entertainment, Retail & Consumer Goods). Key players include established firms like Servcorp, CBRE Group Inc., WeWork, Jones Lang LaSalle, and IWG PLC, alongside regional and emerging companies, indicating a competitive yet dynamic market landscape.
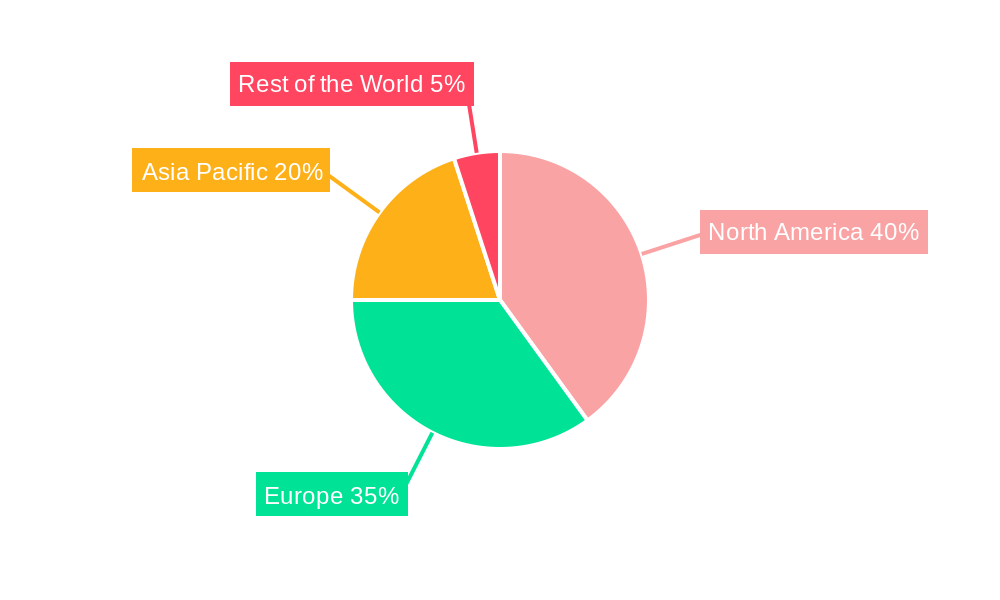
The North American and European markets currently dominate the office space sector, but the Asia-Pacific region is demonstrating significant growth potential, attracting substantial investment and development activity. This growth is driven by rapid urbanization, economic expansion, and the increasing presence of multinational corporations in emerging Asian economies. The ongoing evolution of workstyles and technology continues to shape the demand for office spaces. The adoption of smart building technologies, enhanced security features, and focus on employee well-being are influencing design and operational strategies across the sector. This requires companies to adapt and innovate to remain competitive, offering adaptable, technologically advanced, and sustainable solutions to meet evolving client needs.
Office Space Industry: A Comprehensive Market Report (2019-2033)
This comprehensive report provides an in-depth analysis of the global office space industry, offering invaluable insights for investors, stakeholders, and industry professionals. The study period covers 2019-2033, with a base year of 2025 and a forecast period of 2025-2033. The report uses data from the historical period (2019-2024) to project future trends and market values, totaling in the millions. Key players such as Servcorp, CBRE Group Inc, WeWork, Jones Lang LaSalle Incorporated, Knotel Inc, IWG PLC, Mitsui Fudosan Co Ltd, The Office Group, Regus, and WOJO are analyzed, along with 73 other companies. The market is segmented by building type (Retrofits, New Buildings) and end-user (IT and Telecommunications, Media and Entertainment, Retail and Consumer Goods).
Office Space Industry Market Concentration & Innovation
The office space industry exhibits a moderately concentrated market structure, with a few dominant players controlling a significant market share. In 2025, the top 10 companies are estimated to hold approximately xx% of the global market. However, the market is also characterized by considerable innovation, driven by technological advancements and evolving end-user preferences. The increasing adoption of flexible workspaces and smart building technologies is reshaping the industry landscape. Regulatory frameworks, varying by region, influence market dynamics. The rise of co-working spaces represents a significant product substitute, while M&A activity remains robust. For instance, the total value of M&A deals in the office space industry in 2024 was estimated at $xx Million.
- Market Share Concentration: Top 10 players holding approximately xx% in 2025.
- Innovation Drivers: Flexible workspaces, smart building technologies, sustainability initiatives.
- Regulatory Frameworks: Varying zoning laws, building codes, and environmental regulations.
- Product Substitutes: Co-working spaces, remote work options.
- End-User Trends: Increased demand for flexible, sustainable, and technologically advanced office spaces.
- M&A Activity: Significant deal flow with a total value of $xx Million in 2024.
Office Space Industry Industry Trends & Insights
The global office space industry is projected to experience significant growth over the forecast period (2025-2033), driven by factors such as increasing urbanization, economic growth in emerging markets, and the growing adoption of flexible workspace solutions. The market is expected to witness a Compound Annual Growth Rate (CAGR) of xx% during this period. Technological disruptions, such as the implementation of smart building technologies and the increased use of data analytics, are transforming operational efficiency and tenant experience. Consumer preferences are shifting towards sustainable and technologically advanced workspaces, influencing design and construction practices. Competitive dynamics are marked by increased competition among traditional landlords and new entrants offering flexible workspace solutions. Market penetration of co-working spaces is steadily rising, estimated at xx% in 2025.
Dominant Markets & Segments in Office Space Industry
The North American region is currently the dominant market for office space, followed by Asia-Pacific and Europe. Within North America, the United States holds the largest market share. Among building types, new buildings currently command a larger share compared to retrofits. However, the retrofit segment is expected to witness significant growth owing to increasing demand for sustainable and efficient spaces. The IT and Telecommunications sector represents the largest end-user segment, followed by Media and Entertainment and Retail and Consumer Goods.
- Key Drivers of North American Dominance: Strong economic growth, advanced infrastructure, established real estate market.
- New Buildings Segment: High demand driven by technological advancements and modern amenities.
- Retrofits Segment: Growing appeal due to cost-effectiveness and sustainability concerns.
- IT and Telecommunications Dominance: High demand for advanced technological infrastructure and flexible spaces.
Office Space Industry Product Developments
The office space industry is witnessing significant product innovation, encompassing smart building technologies that enhance energy efficiency, security, and workspace management. The integration of IoT devices, advanced analytics, and flexible workspace designs are becoming increasingly prevalent. These innovations provide significant competitive advantages by improving operational efficiency, enhancing tenant experience, and fostering sustainability. The market fit for these products is strong, especially in urban centers with high demand for modern, technologically advanced offices.
Report Scope & Segmentation Analysis
This report segments the office space market by building type (Retrofits and New Buildings) and end-user (IT and Telecommunications, Media and Entertainment, Retail and Consumer Goods). Each segment is analyzed in detail, considering its growth projections, market size, and competitive dynamics. For instance, the new buildings segment is predicted to reach $xx Million by 2033, while the IT and Telecommunications segment is projected to grow at a xx% CAGR over the forecast period. Competition within each segment varies, reflecting the specific needs and preferences of end-users.
Key Drivers of Office Space Industry Growth
Several factors fuel the growth of the office space industry. Technological advancements, especially in smart building technologies and flexible workspace solutions, are key. Economic growth in both developed and emerging markets creates demand for commercial real estate. Favorable regulatory environments that encourage investment and development also contribute. For example, tax incentives for green buildings are driving growth in the retrofit segment.
Challenges in the Office Space Industry Sector
The industry faces several challenges, including economic downturns that can impact demand, supply chain disruptions that delay construction projects, and intense competition among providers. Furthermore, regulatory hurdles, such as zoning restrictions, can hinder development. These factors can result in fluctuating occupancy rates and reduced profitability. For instance, supply chain issues in 2022-2023 resulted in xx% increase in construction costs.
Emerging Opportunities in Office Space Industry
Emerging opportunities lie in expanding into new markets, particularly in rapidly developing economies. The integration of advanced technologies like AI and automation presents significant opportunities for enhancing building management and tenant experience. Growing demand for sustainable and eco-friendly office spaces opens avenues for green building projects and related services.
Leading Players in the Office Space Industry Market
- Servcorp
- CBRE Group Inc
- WeWork
- Jones Lang LaSalle Incorporated
- Knotel Inc
- IWG PLC
- Mitsui Fudosan Co Ltd
- The Office Group
- Regus
- WOJO
- 73 Other Companies
Key Developments in Office Space Industry Industry
- Q1 2023: WeWork announced a new partnership to expand its flexible workspace offerings in Asia.
- Q3 2022: CBRE Group Inc acquired a significant portfolio of office buildings in a major metropolitan area.
- 2021: Several major players invested heavily in technology upgrades for existing properties.
Strategic Outlook for Office Space Industry Market
The office space industry is poised for continued growth, driven by technological advancements, evolving workplace trends, and growing urbanization. Opportunities exist in developing sustainable, technologically integrated, and flexible workspace solutions catering to the evolving needs of diverse end-users. Continued focus on innovation and strategic partnerships will be crucial for success in this dynamic and competitive market.
Office Space Industry Segmentation
-
1. Building Type
- 1.1. Retrofits
- 1.2. New Buildings
-
2. End User
- 2.1. IT and Telecommunications
- 2.2. Media and Entertainment
- 2.3. Retail and Consumer Goods
Office Space Industry Segmentation By Geography
- 1. North America
- 2. Europe
- 3. Asia Pacific
- 4. Rest of the World
Office Space Industry REPORT HIGHLIGHTS
| Aspects | Details |
|---|---|
| Study Period | 2019-2033 |
| Base Year | 2024 |
| Estimated Year | 2025 |
| Forecast Period | 2025-2033 |
| Historical Period | 2019-2024 |
| Growth Rate | CAGR of > 10.00% from 2019-2033 |
| Segmentation |
|
Table of Contents
- 1. Introduction
- 1.1. Research Scope
- 1.2. Market Segmentation
- 1.3. Research Methodology
- 1.4. Definitions and Assumptions
- 2. Executive Summary
- 2.1. Introduction
- 3. Market Dynamics
- 3.1. Introduction
- 3.2. Market Drivers
- 3.2.1. 4.; Increase in Aging Population Driving the Market4.; Healthcare and Long-term Care Needs Driving the Market
- 3.3. Market Restrains
- 3.3.1. 4.; High Affordability and Cost of Care Affecting the Market4.; Staffing and Workforce Challenges Affecting the Market
- 3.4. Market Trends
- 3.4.1. Increase in Office Space Vacancy Rate
- 4. Market Factor Analysis
- 4.1. Porters Five Forces
- 4.2. Supply/Value Chain
- 4.3. PESTEL analysis
- 4.4. Market Entropy
- 4.5. Patent/Trademark Analysis
- 5. Global Office Space Industry Analysis, Insights and Forecast, 2019-2031
- 5.1. Market Analysis, Insights and Forecast - by Building Type
- 5.1.1. Retrofits
- 5.1.2. New Buildings
- 5.2. Market Analysis, Insights and Forecast - by End User
- 5.2.1. IT and Telecommunications
- 5.2.2. Media and Entertainment
- 5.2.3. Retail and Consumer Goods
- 5.3. Market Analysis, Insights and Forecast - by Region
- 5.3.1. North America
- 5.3.2. Europe
- 5.3.3. Asia Pacific
- 5.3.4. Rest of the World
- 5.1. Market Analysis, Insights and Forecast - by Building Type
- 6. North America Office Space Industry Analysis, Insights and Forecast, 2019-2031
- 6.1. Market Analysis, Insights and Forecast - by Building Type
- 6.1.1. Retrofits
- 6.1.2. New Buildings
- 6.2. Market Analysis, Insights and Forecast - by End User
- 6.2.1. IT and Telecommunications
- 6.2.2. Media and Entertainment
- 6.2.3. Retail and Consumer Goods
- 6.1. Market Analysis, Insights and Forecast - by Building Type
- 7. Europe Office Space Industry Analysis, Insights and Forecast, 2019-2031
- 7.1. Market Analysis, Insights and Forecast - by Building Type
- 7.1.1. Retrofits
- 7.1.2. New Buildings
- 7.2. Market Analysis, Insights and Forecast - by End User
- 7.2.1. IT and Telecommunications
- 7.2.2. Media and Entertainment
- 7.2.3. Retail and Consumer Goods
- 7.1. Market Analysis, Insights and Forecast - by Building Type
- 8. Asia Pacific Office Space Industry Analysis, Insights and Forecast, 2019-2031
- 8.1. Market Analysis, Insights and Forecast - by Building Type
- 8.1.1. Retrofits
- 8.1.2. New Buildings
- 8.2. Market Analysis, Insights and Forecast - by End User
- 8.2.1. IT and Telecommunications
- 8.2.2. Media and Entertainment
- 8.2.3. Retail and Consumer Goods
- 8.1. Market Analysis, Insights and Forecast - by Building Type
- 9. Rest of the World Office Space Industry Analysis, Insights and Forecast, 2019-2031
- 9.1. Market Analysis, Insights and Forecast - by Building Type
- 9.1.1. Retrofits
- 9.1.2. New Buildings
- 9.2. Market Analysis, Insights and Forecast - by End User
- 9.2.1. IT and Telecommunications
- 9.2.2. Media and Entertainment
- 9.2.3. Retail and Consumer Goods
- 9.1. Market Analysis, Insights and Forecast - by Building Type
- 10. North America Office Space Industry Analysis, Insights and Forecast, 2019-2031
- 10.1. Market Analysis, Insights and Forecast - By Country/Sub-region
- 10.1.1.
- 11. Europe Office Space Industry Analysis, Insights and Forecast, 2019-2031
- 11.1. Market Analysis, Insights and Forecast - By Country/Sub-region
- 11.1.1.
- 12. Asia Pacific Office Space Industry Analysis, Insights and Forecast, 2019-2031
- 12.1. Market Analysis, Insights and Forecast - By Country/Sub-region
- 12.1.1.
- 13. Rest of the World Office Space Industry Analysis, Insights and Forecast, 2019-2031
- 13.1. Market Analysis, Insights and Forecast - By Country/Sub-region
- 13.1.1.
- 14. Competitive Analysis
- 14.1. Global Market Share Analysis 2024
- 14.2. Company Profiles
- 14.2.1 Servcorp
- 14.2.1.1. Overview
- 14.2.1.2. Products
- 14.2.1.3. SWOT Analysis
- 14.2.1.4. Recent Developments
- 14.2.1.5. Financials (Based on Availability)
- 14.2.2 CBRE Group Inc
- 14.2.2.1. Overview
- 14.2.2.2. Products
- 14.2.2.3. SWOT Analysis
- 14.2.2.4. Recent Developments
- 14.2.2.5. Financials (Based on Availability)
- 14.2.3 WeWork
- 14.2.3.1. Overview
- 14.2.3.2. Products
- 14.2.3.3. SWOT Analysis
- 14.2.3.4. Recent Developments
- 14.2.3.5. Financials (Based on Availability)
- 14.2.4 Jones Lang LaSalle Incorporated
- 14.2.4.1. Overview
- 14.2.4.2. Products
- 14.2.4.3. SWOT Analysis
- 14.2.4.4. Recent Developments
- 14.2.4.5. Financials (Based on Availability)
- 14.2.5 Knotel Inc
- 14.2.5.1. Overview
- 14.2.5.2. Products
- 14.2.5.3. SWOT Analysis
- 14.2.5.4. Recent Developments
- 14.2.5.5. Financials (Based on Availability)
- 14.2.6 IWG PLC
- 14.2.6.1. Overview
- 14.2.6.2. Products
- 14.2.6.3. SWOT Analysis
- 14.2.6.4. Recent Developments
- 14.2.6.5. Financials (Based on Availability)
- 14.2.7 Mitsui Fudosan Co Ltd
- 14.2.7.1. Overview
- 14.2.7.2. Products
- 14.2.7.3. SWOT Analysis
- 14.2.7.4. Recent Developments
- 14.2.7.5. Financials (Based on Availability)
- 14.2.8 The Office Group
- 14.2.8.1. Overview
- 14.2.8.2. Products
- 14.2.8.3. SWOT Analysis
- 14.2.8.4. Recent Developments
- 14.2.8.5. Financials (Based on Availability)
- 14.2.9 Regus
- 14.2.9.1. Overview
- 14.2.9.2. Products
- 14.2.9.3. SWOT Analysis
- 14.2.9.4. Recent Developments
- 14.2.9.5. Financials (Based on Availability)
- 14.2.10 WOJO**List Not Exhaustive 7 3 Other Companie
- 14.2.10.1. Overview
- 14.2.10.2. Products
- 14.2.10.3. SWOT Analysis
- 14.2.10.4. Recent Developments
- 14.2.10.5. Financials (Based on Availability)
- 14.2.1 Servcorp
List of Figures
- Figure 1: Global Office Space Industry Revenue Breakdown (Million, %) by Region 2024 & 2032
- Figure 2: North America Office Space Industry Revenue (Million), by Country 2024 & 2032
- Figure 3: North America Office Space Industry Revenue Share (%), by Country 2024 & 2032
- Figure 4: Europe Office Space Industry Revenue (Million), by Country 2024 & 2032
- Figure 5: Europe Office Space Industry Revenue Share (%), by Country 2024 & 2032
- Figure 6: Asia Pacific Office Space Industry Revenue (Million), by Country 2024 & 2032
- Figure 7: Asia Pacific Office Space Industry Revenue Share (%), by Country 2024 & 2032
- Figure 8: Rest of the World Office Space Industry Revenue (Million), by Country 2024 & 2032
- Figure 9: Rest of the World Office Space Industry Revenue Share (%), by Country 2024 & 2032
- Figure 10: North America Office Space Industry Revenue (Million), by Building Type 2024 & 2032
- Figure 11: North America Office Space Industry Revenue Share (%), by Building Type 2024 & 2032
- Figure 12: North America Office Space Industry Revenue (Million), by End User 2024 & 2032
- Figure 13: North America Office Space Industry Revenue Share (%), by End User 2024 & 2032
- Figure 14: North America Office Space Industry Revenue (Million), by Country 2024 & 2032
- Figure 15: North America Office Space Industry Revenue Share (%), by Country 2024 & 2032
- Figure 16: Europe Office Space Industry Revenue (Million), by Building Type 2024 & 2032
- Figure 17: Europe Office Space Industry Revenue Share (%), by Building Type 2024 & 2032
- Figure 18: Europe Office Space Industry Revenue (Million), by End User 2024 & 2032
- Figure 19: Europe Office Space Industry Revenue Share (%), by End User 2024 & 2032
- Figure 20: Europe Office Space Industry Revenue (Million), by Country 2024 & 2032
- Figure 21: Europe Office Space Industry Revenue Share (%), by Country 2024 & 2032
- Figure 22: Asia Pacific Office Space Industry Revenue (Million), by Building Type 2024 & 2032
- Figure 23: Asia Pacific Office Space Industry Revenue Share (%), by Building Type 2024 & 2032
- Figure 24: Asia Pacific Office Space Industry Revenue (Million), by End User 2024 & 2032
- Figure 25: Asia Pacific Office Space Industry Revenue Share (%), by End User 2024 & 2032
- Figure 26: Asia Pacific Office Space Industry Revenue (Million), by Country 2024 & 2032
- Figure 27: Asia Pacific Office Space Industry Revenue Share (%), by Country 2024 & 2032
- Figure 28: Rest of the World Office Space Industry Revenue (Million), by Building Type 2024 & 2032
- Figure 29: Rest of the World Office Space Industry Revenue Share (%), by Building Type 2024 & 2032
- Figure 30: Rest of the World Office Space Industry Revenue (Million), by End User 2024 & 2032
- Figure 31: Rest of the World Office Space Industry Revenue Share (%), by End User 2024 & 2032
- Figure 32: Rest of the World Office Space Industry Revenue (Million), by Country 2024 & 2032
- Figure 33: Rest of the World Office Space Industry Revenue Share (%), by Country 2024 & 2032
List of Tables
- Table 1: Global Office Space Industry Revenue Million Forecast, by Region 2019 & 2032
- Table 2: Global Office Space Industry Revenue Million Forecast, by Building Type 2019 & 2032
- Table 3: Global Office Space Industry Revenue Million Forecast, by End User 2019 & 2032
- Table 4: Global Office Space Industry Revenue Million Forecast, by Region 2019 & 2032
- Table 5: Global Office Space Industry Revenue Million Forecast, by Country 2019 & 2032
- Table 6: Office Space Industry Revenue (Million) Forecast, by Application 2019 & 2032
- Table 7: Global Office Space Industry Revenue Million Forecast, by Country 2019 & 2032
- Table 8: Office Space Industry Revenue (Million) Forecast, by Application 2019 & 2032
- Table 9: Global Office Space Industry Revenue Million Forecast, by Country 2019 & 2032
- Table 10: Office Space Industry Revenue (Million) Forecast, by Application 2019 & 2032
- Table 11: Global Office Space Industry Revenue Million Forecast, by Country 2019 & 2032
- Table 12: Office Space Industry Revenue (Million) Forecast, by Application 2019 & 2032
- Table 13: Global Office Space Industry Revenue Million Forecast, by Building Type 2019 & 2032
- Table 14: Global Office Space Industry Revenue Million Forecast, by End User 2019 & 2032
- Table 15: Global Office Space Industry Revenue Million Forecast, by Country 2019 & 2032
- Table 16: Global Office Space Industry Revenue Million Forecast, by Building Type 2019 & 2032
- Table 17: Global Office Space Industry Revenue Million Forecast, by End User 2019 & 2032
- Table 18: Global Office Space Industry Revenue Million Forecast, by Country 2019 & 2032
- Table 19: Global Office Space Industry Revenue Million Forecast, by Building Type 2019 & 2032
- Table 20: Global Office Space Industry Revenue Million Forecast, by End User 2019 & 2032
- Table 21: Global Office Space Industry Revenue Million Forecast, by Country 2019 & 2032
- Table 22: Global Office Space Industry Revenue Million Forecast, by Building Type 2019 & 2032
- Table 23: Global Office Space Industry Revenue Million Forecast, by End User 2019 & 2032
- Table 24: Global Office Space Industry Revenue Million Forecast, by Country 2019 & 2032
Frequently Asked Questions
1. What is the projected Compound Annual Growth Rate (CAGR) of the Office Space Industry?
The projected CAGR is approximately > 10.00%.
2. Which companies are prominent players in the Office Space Industry?
Key companies in the market include Servcorp, CBRE Group Inc, WeWork, Jones Lang LaSalle Incorporated, Knotel Inc, IWG PLC, Mitsui Fudosan Co Ltd, The Office Group, Regus, WOJO**List Not Exhaustive 7 3 Other Companie.
3. What are the main segments of the Office Space Industry?
The market segments include Building Type, End User.
4. Can you provide details about the market size?
The market size is estimated to be USD XX Million as of 2022.
5. What are some drivers contributing to market growth?
4.; Increase in Aging Population Driving the Market4.; Healthcare and Long-term Care Needs Driving the Market.
6. What are the notable trends driving market growth?
Increase in Office Space Vacancy Rate.
7. Are there any restraints impacting market growth?
4.; High Affordability and Cost of Care Affecting the Market4.; Staffing and Workforce Challenges Affecting the Market.
8. Can you provide examples of recent developments in the market?
N/A
9. What pricing options are available for accessing the report?
Pricing options include single-user, multi-user, and enterprise licenses priced at USD 4750, USD 5250, and USD 8750 respectively.
10. Is the market size provided in terms of value or volume?
The market size is provided in terms of value, measured in Million.
11. Are there any specific market keywords associated with the report?
Yes, the market keyword associated with the report is "Office Space Industry," which aids in identifying and referencing the specific market segment covered.
12. How do I determine which pricing option suits my needs best?
The pricing options vary based on user requirements and access needs. Individual users may opt for single-user licenses, while businesses requiring broader access may choose multi-user or enterprise licenses for cost-effective access to the report.
13. Are there any additional resources or data provided in the Office Space Industry report?
While the report offers comprehensive insights, it's advisable to review the specific contents or supplementary materials provided to ascertain if additional resources or data are available.
14. How can I stay updated on further developments or reports in the Office Space Industry?
To stay informed about further developments, trends, and reports in the Office Space Industry, consider subscribing to industry newsletters, following relevant companies and organizations, or regularly checking reputable industry news sources and publications.
Methodology
Step 1 - Identification of Relevant Samples Size from Population Database


Step 2 - Approaches for Defining Global Market Size (Value, Volume* & Price*)

Note*: In applicable scenarios
Step 3 - Data Sources
Primary Research
- Web Analytics
- Survey Reports
- Research Institute
- Latest Research Reports
- Opinion Leaders
Secondary Research
- Annual Reports
- White Paper
- Latest Press Release
- Industry Association
- Paid Database
- Investor Presentations

Step 4 - Data Triangulation
Involves using different sources of information in order to increase the validity of a study
These sources are likely to be stakeholders in a program - participants, other researchers, program staff, other community members, and so on.
Then we put all data in single framework & apply various statistical tools to find out the dynamic on the market.
During the analysis stage, feedback from the stakeholder groups would be compared to determine areas of agreement as well as areas of divergence


