
Key Insights
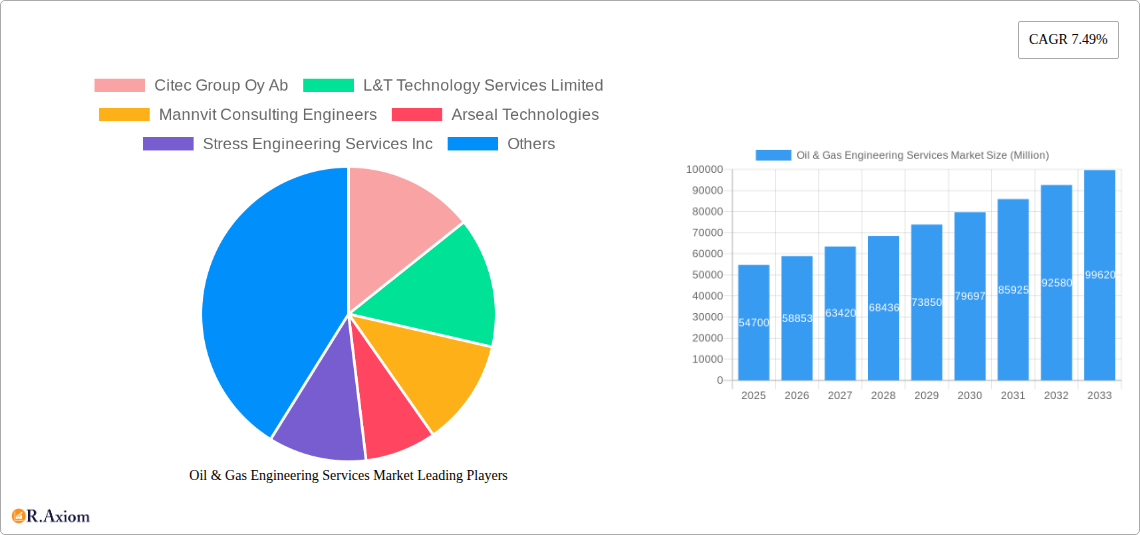
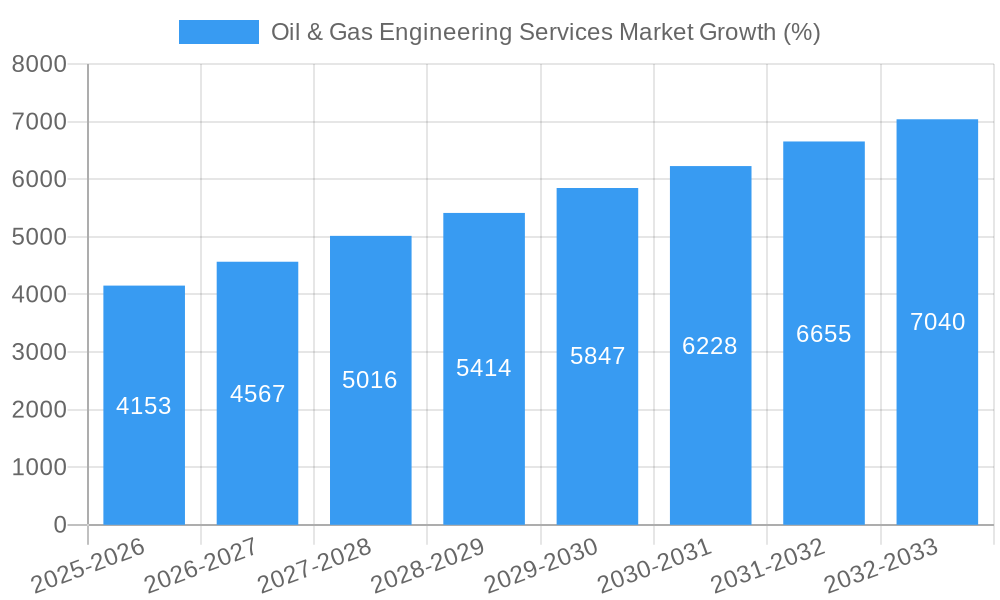
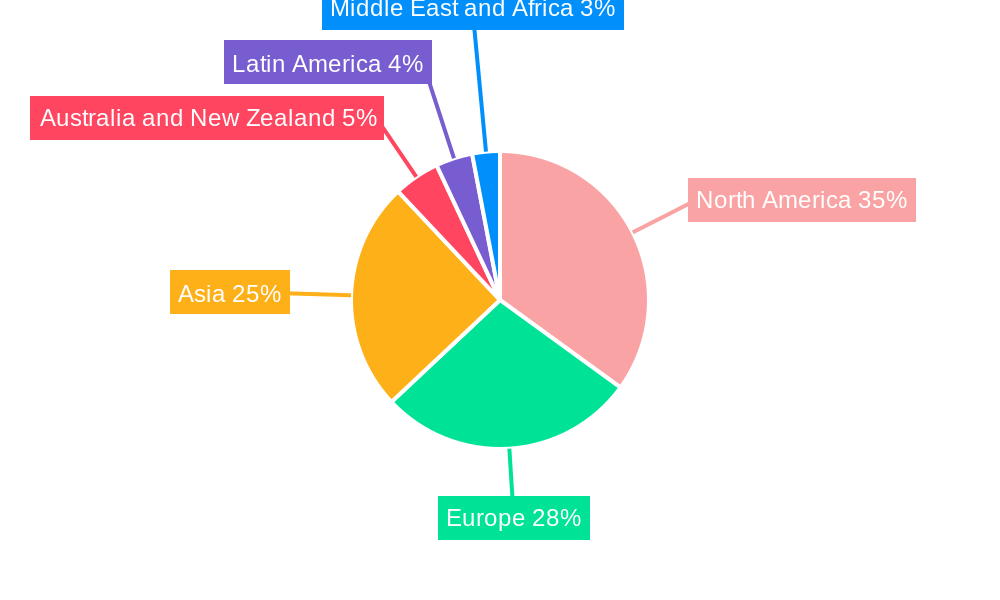
The Oil & Gas Engineering Services market is experiencing robust growth, projected to reach a market size of $54.70 billion in 2025 and maintain a Compound Annual Growth Rate (CAGR) of 7.49% from 2025 to 2033. This expansion is driven by several key factors. Firstly, increasing global energy demand necessitates continuous upgrades and expansion of existing oil and gas infrastructure, fueling demand for engineering services across upstream, midstream, and downstream segments. Secondly, the ongoing transition towards cleaner energy sources is prompting investment in carbon capture, utilization, and storage (CCUS) technologies, thereby creating new opportunities for specialized engineering firms. Furthermore, stringent environmental regulations and safety standards are driving the need for sophisticated engineering solutions to improve operational efficiency and minimize environmental impact. The market's segmentation by type (upstream, midstream, downstream) reflects the diverse range of services required throughout the oil and gas lifecycle. Major players like Citec Group Oy Ab, L&T Technology Services, and Wood PLC are leveraging their expertise and technological capabilities to capture market share. Geographic distribution shows varying levels of maturity, with North America and Europe expected to remain significant markets, while the Asia-Pacific region presents a high-growth potential due to substantial infrastructure development and increasing energy consumption.
The forecast period (2025-2033) anticipates continued growth driven by factors such as technological advancements in digitalization and automation, leading to improved efficiency and cost optimization within the sector. However, potential restraints include fluctuating oil and gas prices, geopolitical instability impacting investment decisions, and the growing emphasis on renewable energy sources which could potentially moderate growth in the long term. Despite these challenges, the long-term outlook remains positive, with the industry projected to benefit from ongoing investments in infrastructure modernization, operational efficiency enhancement, and the adoption of advanced engineering technologies, particularly in emerging markets. The competitive landscape remains dynamic, with established players facing challenges from smaller, specialized firms offering niche services and innovative solutions.
Oil & Gas Engineering Services Market: A Comprehensive Report (2019-2033)
This in-depth report provides a comprehensive analysis of the Oil & Gas Engineering Services market, offering valuable insights for stakeholders across the value chain. Covering the period 2019-2033, with a focus on 2025, this report examines market dynamics, competitive landscapes, and future growth prospects. The study incorporates detailed segmentation by type (Upstream, Midstream, Downstream), revealing key trends and opportunities within each segment.
Oil & Gas Engineering Services Market Concentration & Innovation
The Oil & Gas Engineering Services market exhibits a moderately concentrated structure, with a few major players commanding significant market share. While precise market share figures for each company are unavailable, Citec Group Oy Ab, L&T Technology Services Limited, Wood PLC, and WSP Global Inc. are among the prominent firms. The market exhibits considerable innovation, driven by the need for enhanced efficiency, safety, and sustainability in oil and gas operations. This is reflected in investments in digitalization, automation, and advanced analytics. Regulatory frameworks, particularly those related to environmental protection and safety, significantly influence market dynamics. The increasing adoption of renewable energy sources presents a substitute for traditional fossil fuels, impacting the overall demand for oil and gas engineering services. End-user trends toward integrated solutions and lifecycle services are also reshaping the market. M&A activity has been moderate, with deal values varying significantly depending on the size and strategic alignment of the merging entities. For instance, xx Million deals have been recorded in the past five years, largely driven by the desire to expand service portfolios and geographical reach.
- Key Factors: Market concentration, innovation drivers, regulatory frameworks, product substitutes, end-user trends, M&A activities.
- Metrics: Market share (xx%), M&A deal values (xx Million).
Oil & Gas Engineering Services Market Industry Trends & Insights
The Oil & Gas Engineering Services market is projected to experience a CAGR of xx% during the forecast period (2025-2033). This growth is primarily fueled by increasing upstream activities globally, particularly in regions with significant hydrocarbon reserves. Technological advancements, such as the adoption of digital twins and AI-powered predictive maintenance, are improving operational efficiency and reducing costs. However, fluctuating oil prices and the ongoing energy transition pose challenges. Consumer preferences are shifting towards environmentally responsible practices, necessitating a focus on sustainable solutions. Competitive dynamics are intense, with companies focusing on differentiation through specialized services and technological expertise. Market penetration of digital solutions is steadily increasing, with xx% adoption rate in 2025. The demand for integrated solutions encompassing reservoir engineering, project management, and operations optimization is also on the rise. The need for efficient and sustainable solutions in the face of environmental concerns and regulatory pressures will continue to drive market growth.
Dominant Markets & Segments in Oil & Gas Engineering Services Market
The Upstream segment currently dominates the Oil & Gas Engineering Services market, accounting for xx% of the total market value in 2025. This dominance is primarily attributed to the continued exploration and development of new oil and gas reserves across the globe, particularly in North America, the Middle East, and Asia-Pacific regions.
- Key Drivers (Upstream):
- High investments in exploration and production activities.
- Technological advancements enhancing efficiency in drilling and extraction.
- Significant hydrocarbon reserves in several regions.
The Middle East stands out as the leading region, driven by substantial investments in oil and gas infrastructure development and large-scale projects. Stringent environmental regulations and focus on emissions reduction are driving demand in other regions like Europe and North America, but with slower growth rates compared to the Middle East.
- Key Drivers (Middle East):
- Major oil and gas reserves.
- Large-scale infrastructure development projects.
- Government support and investments.
Oil & Gas Engineering Services Market Product Developments
Recent product innovations focus on integrating digital technologies like AI, machine learning, and advanced analytics to enhance efficiency, safety, and sustainability. These advancements include improved simulation tools for reservoir modeling, predictive maintenance platforms for minimizing downtime, and digital twins for optimizing field operations. The competitive advantage lies in providing comprehensive, integrated solutions that leverage these technological advancements to deliver cost savings, efficiency gains, and environmental responsibility. This aligns with the growing market preference for streamlined services and sustainable practices.
Report Scope & Segmentation Analysis
The report segments the Oil & Gas Engineering Services market based on the type of service: Upstream, Midstream, and Downstream.
Upstream: This segment focuses on exploration, drilling, and production activities. It is projected to experience significant growth driven by rising global demand for oil and gas.
Midstream: This segment includes the transportation, storage, and processing of oil and gas. Growth will be moderate, influenced by infrastructure development and expansion.
Downstream: This segment encompasses the refining, marketing, and distribution of oil and gas products. Growth will be relatively steady, shaped by refining capacity additions and product demand.
Each segment shows distinct competitive dynamics, with certain players focusing on niche areas while others adopt a broad approach. Market sizes and growth projections are provided for each segment in the full report.
Key Drivers of Oil & Gas Engineering Services Market Growth
Technological advancements, including automation, digitalization, and data analytics, are driving significant efficiency improvements and cost reductions. The increasing focus on environmental sustainability is stimulating demand for eco-friendly solutions and reducing emissions. Favorable government policies and investments in oil and gas infrastructure projects in several key regions also contribute to market growth. Specifically, the development of CCS (Carbon Capture and Storage) infrastructure is opening up new markets for oil and gas engineering services.
Challenges in the Oil & Gas Engineering Services Market Sector
Fluctuating oil prices present a major challenge, impacting project investments and profitability. Stringent environmental regulations and growing pressure to reduce carbon emissions necessitate costly upgrades and compliance measures. Supply chain disruptions, particularly for specialized equipment and materials, can lead to project delays and increased costs. Intense competition from established players and new entrants puts pressure on pricing and margins. These factors combined can negatively impact revenue by as much as xx% in certain scenarios.
Emerging Opportunities in Oil & Gas Engineering Services Market
The increasing adoption of digital technologies creates numerous opportunities, including the development of AI-powered solutions for reservoir management, predictive maintenance, and real-time monitoring. The expanding renewable energy sector opens up avenues for providing engineering services for associated infrastructure and operations. Growth in emerging economies with substantial hydrocarbon reserves presents promising new markets. Focusing on sustainable practices and emissions reduction is also key to tapping into growth opportunities.
Leading Players in the Oil & Gas Engineering Services Market Market
- Citec Group Oy Ab
- L&T Technology Services Limited
- Mannvit Consulting Engineers
- Arseal Technologies
- Stress Engineering Services Inc
- Wood PLC
- Lloyd's Register Group Services Limited
- M&H
- WSP Global Inc
- Hatch Ltd
- Element Materials Technology
- Toyo Engineering Corporation
- Tetra Tech Inc
- QuEST Global Services Pte Ltd
Key Developments in Oil & Gas Engineering Services Market Industry
March 2024: Genesis secures Offshore Systems Engineering Services contract for the Northern Endurance Partnership's East Coast Cluster CCS infrastructure project in the UK. This highlights the growing demand for engineering expertise in carbon capture and storage.
March 2024: Genesis and Beicip announce a collaboration to offer integrated solutions for field development planning, emphasizing holistic approaches from reservoir to point of sale. This partnership reflects the market trend toward integrated, sustainable solutions.
Strategic Outlook for Oil & Gas Engineering Services Market Market
The Oil & Gas Engineering Services market is poised for continued growth, driven by ongoing investments in exploration and production, coupled with the rising demand for efficient and sustainable solutions. The integration of digital technologies and the focus on decarbonization strategies present significant growth catalysts. Companies that can adapt to the evolving market landscape, embracing technological innovation and sustainable practices, are well-positioned to capitalize on future opportunities. The market's potential remains considerable, with opportunities spanning traditional oil and gas operations and emerging areas such as CCS and renewable energy integration.
Oil & Gas Engineering Services Market Segmentation
-
1. Type
- 1.1. Downstream
- 1.2. Midstream
- 1.3. Upstream
Oil & Gas Engineering Services Market Segmentation By Geography
- 1. North America
- 2. Europe
- 3. Asia
- 4. Australia and New Zealand
- 5. Latin America
- 6. Middle East and Africa
Oil & Gas Engineering Services Market REPORT HIGHLIGHTS
| Aspects | Details |
|---|---|
| Study Period | 2019-2033 |
| Base Year | 2024 |
| Estimated Year | 2025 |
| Forecast Period | 2025-2033 |
| Historical Period | 2019-2024 |
| Growth Rate | CAGR of 7.49% from 2019-2033 |
| Segmentation |
|
Table of Contents
- 1. Introduction
- 1.1. Research Scope
- 1.2. Market Segmentation
- 1.3. Research Methodology
- 1.4. Definitions and Assumptions
- 2. Executive Summary
- 2.1. Introduction
- 3. Market Dynamics
- 3.1. Introduction
- 3.2. Market Drivers
- 3.2.1. Growing Adoption of Automation in the Oil and Gas Industry to Aid Growth of Design and Engineering Services; Ongoing Efforts to Enhance Cost and Operational Efficiency in the Oil and Gas Industry; Industry 4.0 Practices Such as Extended Reality and BIM 4D to Reduce TTM
- 3.3. Market Restrains
- 3.3.1. The Market is Susceptible to Fluctuations in the Oil and Gas Prices as Well as Other Macroeconomic Changes; Operational and Compliance-related Challenges
- 3.4. Market Trends
- 3.4.1. Downstream Segment to Exhibit Significant Growth
- 4. Market Factor Analysis
- 4.1. Porters Five Forces
- 4.2. Supply/Value Chain
- 4.3. PESTEL analysis
- 4.4. Market Entropy
- 4.5. Patent/Trademark Analysis
- 5. Global Oil & Gas Engineering Services Market Analysis, Insights and Forecast, 2019-2031
- 5.1. Market Analysis, Insights and Forecast - by Type
- 5.1.1. Downstream
- 5.1.2. Midstream
- 5.1.3. Upstream
- 5.2. Market Analysis, Insights and Forecast - by Region
- 5.2.1. North America
- 5.2.2. Europe
- 5.2.3. Asia
- 5.2.4. Australia and New Zealand
- 5.2.5. Latin America
- 5.2.6. Middle East and Africa
- 5.1. Market Analysis, Insights and Forecast - by Type
- 6. North America Oil & Gas Engineering Services Market Analysis, Insights and Forecast, 2019-2031
- 6.1. Market Analysis, Insights and Forecast - by Type
- 6.1.1. Downstream
- 6.1.2. Midstream
- 6.1.3. Upstream
- 6.1. Market Analysis, Insights and Forecast - by Type
- 7. Europe Oil & Gas Engineering Services Market Analysis, Insights and Forecast, 2019-2031
- 7.1. Market Analysis, Insights and Forecast - by Type
- 7.1.1. Downstream
- 7.1.2. Midstream
- 7.1.3. Upstream
- 7.1. Market Analysis, Insights and Forecast - by Type
- 8. Asia Oil & Gas Engineering Services Market Analysis, Insights and Forecast, 2019-2031
- 8.1. Market Analysis, Insights and Forecast - by Type
- 8.1.1. Downstream
- 8.1.2. Midstream
- 8.1.3. Upstream
- 8.1. Market Analysis, Insights and Forecast - by Type
- 9. Australia and New Zealand Oil & Gas Engineering Services Market Analysis, Insights and Forecast, 2019-2031
- 9.1. Market Analysis, Insights and Forecast - by Type
- 9.1.1. Downstream
- 9.1.2. Midstream
- 9.1.3. Upstream
- 9.1. Market Analysis, Insights and Forecast - by Type
- 10. Latin America Oil & Gas Engineering Services Market Analysis, Insights and Forecast, 2019-2031
- 10.1. Market Analysis, Insights and Forecast - by Type
- 10.1.1. Downstream
- 10.1.2. Midstream
- 10.1.3. Upstream
- 10.1. Market Analysis, Insights and Forecast - by Type
- 11. Middle East and Africa Oil & Gas Engineering Services Market Analysis, Insights and Forecast, 2019-2031
- 11.1. Market Analysis, Insights and Forecast - by Type
- 11.1.1. Downstream
- 11.1.2. Midstream
- 11.1.3. Upstream
- 11.1. Market Analysis, Insights and Forecast - by Type
- 12. North America Oil & Gas Engineering Services Market Analysis, Insights and Forecast, 2019-2031
- 12.1. Market Analysis, Insights and Forecast - By Country/Sub-region
- 12.1.1.
- 13. Europe Oil & Gas Engineering Services Market Analysis, Insights and Forecast, 2019-2031
- 13.1. Market Analysis, Insights and Forecast - By Country/Sub-region
- 13.1.1.
- 14. Asia Oil & Gas Engineering Services Market Analysis, Insights and Forecast, 2019-2031
- 14.1. Market Analysis, Insights and Forecast - By Country/Sub-region
- 14.1.1.
- 15. Australia and New Zealand Oil & Gas Engineering Services Market Analysis, Insights and Forecast, 2019-2031
- 15.1. Market Analysis, Insights and Forecast - By Country/Sub-region
- 15.1.1.
- 16. Latin America Oil & Gas Engineering Services Market Analysis, Insights and Forecast, 2019-2031
- 16.1. Market Analysis, Insights and Forecast - By Country/Sub-region
- 16.1.1.
- 17. Middle East and Africa Oil & Gas Engineering Services Market Analysis, Insights and Forecast, 2019-2031
- 17.1. Market Analysis, Insights and Forecast - By Country/Sub-region
- 17.1.1.
- 18. Competitive Analysis
- 18.1. Global Market Share Analysis 2024
- 18.2. Company Profiles
- 18.2.1 Citec Group Oy Ab
- 18.2.1.1. Overview
- 18.2.1.2. Products
- 18.2.1.3. SWOT Analysis
- 18.2.1.4. Recent Developments
- 18.2.1.5. Financials (Based on Availability)
- 18.2.2 L&T Technology Services Limited
- 18.2.2.1. Overview
- 18.2.2.2. Products
- 18.2.2.3. SWOT Analysis
- 18.2.2.4. Recent Developments
- 18.2.2.5. Financials (Based on Availability)
- 18.2.3 Mannvit Consulting Engineers
- 18.2.3.1. Overview
- 18.2.3.2. Products
- 18.2.3.3. SWOT Analysis
- 18.2.3.4. Recent Developments
- 18.2.3.5. Financials (Based on Availability)
- 18.2.4 Arseal Technologies
- 18.2.4.1. Overview
- 18.2.4.2. Products
- 18.2.4.3. SWOT Analysis
- 18.2.4.4. Recent Developments
- 18.2.4.5. Financials (Based on Availability)
- 18.2.5 Stress Engineering Services Inc
- 18.2.5.1. Overview
- 18.2.5.2. Products
- 18.2.5.3. SWOT Analysis
- 18.2.5.4. Recent Developments
- 18.2.5.5. Financials (Based on Availability)
- 18.2.6 Wood PLC
- 18.2.6.1. Overview
- 18.2.6.2. Products
- 18.2.6.3. SWOT Analysis
- 18.2.6.4. Recent Developments
- 18.2.6.5. Financials (Based on Availability)
- 18.2.7 Lloyd's Register Group Services Limite
- 18.2.7.1. Overview
- 18.2.7.2. Products
- 18.2.7.3. SWOT Analysis
- 18.2.7.4. Recent Developments
- 18.2.7.5. Financials (Based on Availability)
- 18.2.8 M&H
- 18.2.8.1. Overview
- 18.2.8.2. Products
- 18.2.8.3. SWOT Analysis
- 18.2.8.4. Recent Developments
- 18.2.8.5. Financials (Based on Availability)
- 18.2.9 WSP Global Inc
- 18.2.9.1. Overview
- 18.2.9.2. Products
- 18.2.9.3. SWOT Analysis
- 18.2.9.4. Recent Developments
- 18.2.9.5. Financials (Based on Availability)
- 18.2.10 Hatch Ltd
- 18.2.10.1. Overview
- 18.2.10.2. Products
- 18.2.10.3. SWOT Analysis
- 18.2.10.4. Recent Developments
- 18.2.10.5. Financials (Based on Availability)
- 18.2.11 Element Materials Technology
- 18.2.11.1. Overview
- 18.2.11.2. Products
- 18.2.11.3. SWOT Analysis
- 18.2.11.4. Recent Developments
- 18.2.11.5. Financials (Based on Availability)
- 18.2.12 Toyo Engineering Corporation
- 18.2.12.1. Overview
- 18.2.12.2. Products
- 18.2.12.3. SWOT Analysis
- 18.2.12.4. Recent Developments
- 18.2.12.5. Financials (Based on Availability)
- 18.2.13 Tetra Tech Inc
- 18.2.13.1. Overview
- 18.2.13.2. Products
- 18.2.13.3. SWOT Analysis
- 18.2.13.4. Recent Developments
- 18.2.13.5. Financials (Based on Availability)
- 18.2.14 QuEST Global Services Pte Ltd
- 18.2.14.1. Overview
- 18.2.14.2. Products
- 18.2.14.3. SWOT Analysis
- 18.2.14.4. Recent Developments
- 18.2.14.5. Financials (Based on Availability)
- 18.2.1 Citec Group Oy Ab
List of Figures
- Figure 1: Global Oil & Gas Engineering Services Market Revenue Breakdown (Million, %) by Region 2024 & 2032
- Figure 2: North America Oil & Gas Engineering Services Market Revenue (Million), by Country 2024 & 2032
- Figure 3: North America Oil & Gas Engineering Services Market Revenue Share (%), by Country 2024 & 2032
- Figure 4: Europe Oil & Gas Engineering Services Market Revenue (Million), by Country 2024 & 2032
- Figure 5: Europe Oil & Gas Engineering Services Market Revenue Share (%), by Country 2024 & 2032
- Figure 6: Asia Oil & Gas Engineering Services Market Revenue (Million), by Country 2024 & 2032
- Figure 7: Asia Oil & Gas Engineering Services Market Revenue Share (%), by Country 2024 & 2032
- Figure 8: Australia and New Zealand Oil & Gas Engineering Services Market Revenue (Million), by Country 2024 & 2032
- Figure 9: Australia and New Zealand Oil & Gas Engineering Services Market Revenue Share (%), by Country 2024 & 2032
- Figure 10: Latin America Oil & Gas Engineering Services Market Revenue (Million), by Country 2024 & 2032
- Figure 11: Latin America Oil & Gas Engineering Services Market Revenue Share (%), by Country 2024 & 2032
- Figure 12: Middle East and Africa Oil & Gas Engineering Services Market Revenue (Million), by Country 2024 & 2032
- Figure 13: Middle East and Africa Oil & Gas Engineering Services Market Revenue Share (%), by Country 2024 & 2032
- Figure 14: North America Oil & Gas Engineering Services Market Revenue (Million), by Type 2024 & 2032
- Figure 15: North America Oil & Gas Engineering Services Market Revenue Share (%), by Type 2024 & 2032
- Figure 16: North America Oil & Gas Engineering Services Market Revenue (Million), by Country 2024 & 2032
- Figure 17: North America Oil & Gas Engineering Services Market Revenue Share (%), by Country 2024 & 2032
- Figure 18: Europe Oil & Gas Engineering Services Market Revenue (Million), by Type 2024 & 2032
- Figure 19: Europe Oil & Gas Engineering Services Market Revenue Share (%), by Type 2024 & 2032
- Figure 20: Europe Oil & Gas Engineering Services Market Revenue (Million), by Country 2024 & 2032
- Figure 21: Europe Oil & Gas Engineering Services Market Revenue Share (%), by Country 2024 & 2032
- Figure 22: Asia Oil & Gas Engineering Services Market Revenue (Million), by Type 2024 & 2032
- Figure 23: Asia Oil & Gas Engineering Services Market Revenue Share (%), by Type 2024 & 2032
- Figure 24: Asia Oil & Gas Engineering Services Market Revenue (Million), by Country 2024 & 2032
- Figure 25: Asia Oil & Gas Engineering Services Market Revenue Share (%), by Country 2024 & 2032
- Figure 26: Australia and New Zealand Oil & Gas Engineering Services Market Revenue (Million), by Type 2024 & 2032
- Figure 27: Australia and New Zealand Oil & Gas Engineering Services Market Revenue Share (%), by Type 2024 & 2032
- Figure 28: Australia and New Zealand Oil & Gas Engineering Services Market Revenue (Million), by Country 2024 & 2032
- Figure 29: Australia and New Zealand Oil & Gas Engineering Services Market Revenue Share (%), by Country 2024 & 2032
- Figure 30: Latin America Oil & Gas Engineering Services Market Revenue (Million), by Type 2024 & 2032
- Figure 31: Latin America Oil & Gas Engineering Services Market Revenue Share (%), by Type 2024 & 2032
- Figure 32: Latin America Oil & Gas Engineering Services Market Revenue (Million), by Country 2024 & 2032
- Figure 33: Latin America Oil & Gas Engineering Services Market Revenue Share (%), by Country 2024 & 2032
- Figure 34: Middle East and Africa Oil & Gas Engineering Services Market Revenue (Million), by Type 2024 & 2032
- Figure 35: Middle East and Africa Oil & Gas Engineering Services Market Revenue Share (%), by Type 2024 & 2032
- Figure 36: Middle East and Africa Oil & Gas Engineering Services Market Revenue (Million), by Country 2024 & 2032
- Figure 37: Middle East and Africa Oil & Gas Engineering Services Market Revenue Share (%), by Country 2024 & 2032
List of Tables
- Table 1: Global Oil & Gas Engineering Services Market Revenue Million Forecast, by Region 2019 & 2032
- Table 2: Global Oil & Gas Engineering Services Market Revenue Million Forecast, by Type 2019 & 2032
- Table 3: Global Oil & Gas Engineering Services Market Revenue Million Forecast, by Region 2019 & 2032
- Table 4: Global Oil & Gas Engineering Services Market Revenue Million Forecast, by Country 2019 & 2032
- Table 5: Oil & Gas Engineering Services Market Revenue (Million) Forecast, by Application 2019 & 2032
- Table 6: Global Oil & Gas Engineering Services Market Revenue Million Forecast, by Country 2019 & 2032
- Table 7: Oil & Gas Engineering Services Market Revenue (Million) Forecast, by Application 2019 & 2032
- Table 8: Global Oil & Gas Engineering Services Market Revenue Million Forecast, by Country 2019 & 2032
- Table 9: Oil & Gas Engineering Services Market Revenue (Million) Forecast, by Application 2019 & 2032
- Table 10: Global Oil & Gas Engineering Services Market Revenue Million Forecast, by Country 2019 & 2032
- Table 11: Oil & Gas Engineering Services Market Revenue (Million) Forecast, by Application 2019 & 2032
- Table 12: Global Oil & Gas Engineering Services Market Revenue Million Forecast, by Country 2019 & 2032
- Table 13: Oil & Gas Engineering Services Market Revenue (Million) Forecast, by Application 2019 & 2032
- Table 14: Global Oil & Gas Engineering Services Market Revenue Million Forecast, by Country 2019 & 2032
- Table 15: Oil & Gas Engineering Services Market Revenue (Million) Forecast, by Application 2019 & 2032
- Table 16: Global Oil & Gas Engineering Services Market Revenue Million Forecast, by Type 2019 & 2032
- Table 17: Global Oil & Gas Engineering Services Market Revenue Million Forecast, by Country 2019 & 2032
- Table 18: Global Oil & Gas Engineering Services Market Revenue Million Forecast, by Type 2019 & 2032
- Table 19: Global Oil & Gas Engineering Services Market Revenue Million Forecast, by Country 2019 & 2032
- Table 20: Global Oil & Gas Engineering Services Market Revenue Million Forecast, by Type 2019 & 2032
- Table 21: Global Oil & Gas Engineering Services Market Revenue Million Forecast, by Country 2019 & 2032
- Table 22: Global Oil & Gas Engineering Services Market Revenue Million Forecast, by Type 2019 & 2032
- Table 23: Global Oil & Gas Engineering Services Market Revenue Million Forecast, by Country 2019 & 2032
- Table 24: Global Oil & Gas Engineering Services Market Revenue Million Forecast, by Type 2019 & 2032
- Table 25: Global Oil & Gas Engineering Services Market Revenue Million Forecast, by Country 2019 & 2032
- Table 26: Global Oil & Gas Engineering Services Market Revenue Million Forecast, by Type 2019 & 2032
- Table 27: Global Oil & Gas Engineering Services Market Revenue Million Forecast, by Country 2019 & 2032
Frequently Asked Questions
1. What is the projected Compound Annual Growth Rate (CAGR) of the Oil & Gas Engineering Services Market?
The projected CAGR is approximately 7.49%.
2. Which companies are prominent players in the Oil & Gas Engineering Services Market?
Key companies in the market include Citec Group Oy Ab, L&T Technology Services Limited, Mannvit Consulting Engineers, Arseal Technologies, Stress Engineering Services Inc, Wood PLC, Lloyd's Register Group Services Limite, M&H, WSP Global Inc, Hatch Ltd, Element Materials Technology, Toyo Engineering Corporation, Tetra Tech Inc, QuEST Global Services Pte Ltd.
3. What are the main segments of the Oil & Gas Engineering Services Market?
The market segments include Type.
4. Can you provide details about the market size?
The market size is estimated to be USD 54.70 Million as of 2022.
5. What are some drivers contributing to market growth?
Growing Adoption of Automation in the Oil and Gas Industry to Aid Growth of Design and Engineering Services; Ongoing Efforts to Enhance Cost and Operational Efficiency in the Oil and Gas Industry; Industry 4.0 Practices Such as Extended Reality and BIM 4D to Reduce TTM.
6. What are the notable trends driving market growth?
Downstream Segment to Exhibit Significant Growth.
7. Are there any restraints impacting market growth?
The Market is Susceptible to Fluctuations in the Oil and Gas Prices as Well as Other Macroeconomic Changes; Operational and Compliance-related Challenges.
8. Can you provide examples of recent developments in the market?
March 2024 - Genesis has been selected to provide Offshore Systems Engineering Services for the Northern Endurance Partnership part of the East Coast Cluster in the UK, These projects are actively bringing together communities, business, and academia to deliver the carbon capture and storage (CCS) infrastructure needed to decarbonise this key industrial heartland of the UK.
9. What pricing options are available for accessing the report?
Pricing options include single-user, multi-user, and enterprise licenses priced at USD 4750, USD 5250, and USD 8750 respectively.
10. Is the market size provided in terms of value or volume?
The market size is provided in terms of value, measured in Million.
11. Are there any specific market keywords associated with the report?
Yes, the market keyword associated with the report is "Oil & Gas Engineering Services Market," which aids in identifying and referencing the specific market segment covered.
12. How do I determine which pricing option suits my needs best?
The pricing options vary based on user requirements and access needs. Individual users may opt for single-user licenses, while businesses requiring broader access may choose multi-user or enterprise licenses for cost-effective access to the report.
13. Are there any additional resources or data provided in the Oil & Gas Engineering Services Market report?
While the report offers comprehensive insights, it's advisable to review the specific contents or supplementary materials provided to ascertain if additional resources or data are available.
14. How can I stay updated on further developments or reports in the Oil & Gas Engineering Services Market?
To stay informed about further developments, trends, and reports in the Oil & Gas Engineering Services Market, consider subscribing to industry newsletters, following relevant companies and organizations, or regularly checking reputable industry news sources and publications.
Methodology
Step 1 - Identification of Relevant Samples Size from Population Database


Step 2 - Approaches for Defining Global Market Size (Value, Volume* & Price*)

Note*: In applicable scenarios
Step 3 - Data Sources
Primary Research
- Web Analytics
- Survey Reports
- Research Institute
- Latest Research Reports
- Opinion Leaders
Secondary Research
- Annual Reports
- White Paper
- Latest Press Release
- Industry Association
- Paid Database
- Investor Presentations

Step 4 - Data Triangulation
Involves using different sources of information in order to increase the validity of a study
These sources are likely to be stakeholders in a program - participants, other researchers, program staff, other community members, and so on.
Then we put all data in single framework & apply various statistical tools to find out the dynamic on the market.
During the analysis stage, feedback from the stakeholder groups would be compared to determine areas of agreement as well as areas of divergence


