

Key Insights
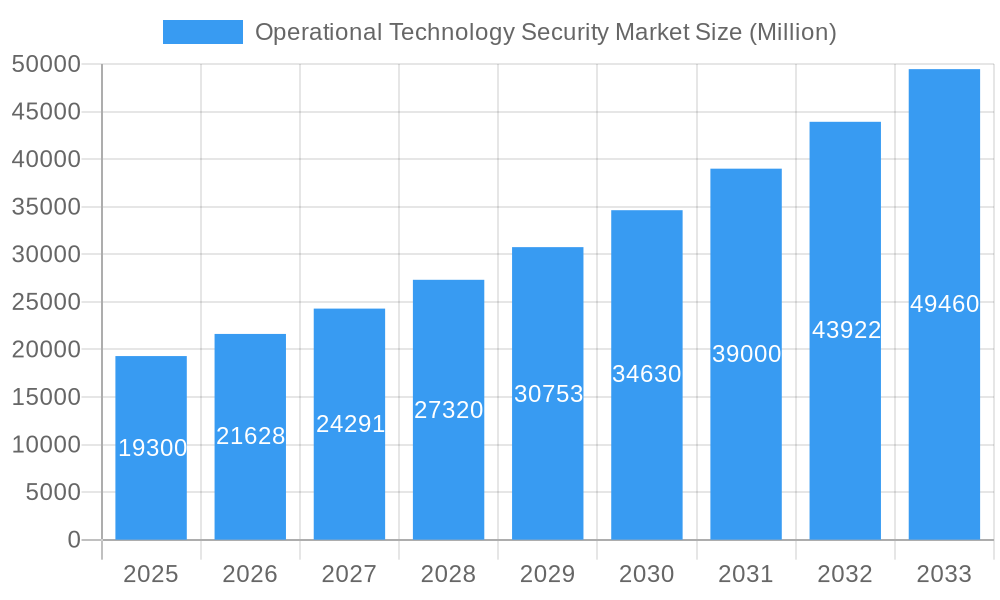
The Operational Technology (OT) security market is experiencing robust growth, driven by the increasing digitization of industrial processes and the escalating number of cyberattacks targeting critical infrastructure. With a market size of $19.3 billion in 2025 and a Compound Annual Growth Rate (CAGR) of 12.06%, the market is projected to reach significant size by 2033. Key drivers include the expanding adoption of Industrial Internet of Things (IIoT) devices, the rising sophistication of cyber threats targeting industrial control systems (ICS), and stringent government regulations aimed at bolstering cybersecurity in critical sectors like energy, manufacturing, and healthcare. The market is segmented by solution type (network security, endpoint security, data security), deployment type (cloud-based, on-premises), and industry vertical. Companies such as Fortinet, Siemens, Schneider Electric, and others are actively competing to provide comprehensive OT security solutions, leading to innovation in areas like threat detection, vulnerability management, and incident response. The market's growth is further fueled by a growing awareness among organizations of the potential financial and operational consequences of OT security breaches.
Operational Technology Security Market Market Size (In Billion)
The competitive landscape is characterized by a mix of established players and emerging cybersecurity firms. Larger corporations, with their established customer bases and extensive portfolios, often offer comprehensive, integrated solutions. Smaller, more agile companies, however, are innovating rapidly, providing specialized expertise and cutting-edge technologies in specific OT security niches. This combination fosters a dynamic market, pushing technological advancements and ultimately enhancing the overall security posture of critical infrastructures. The forecast period (2025-2033) anticipates consistent growth, largely driven by continued investments in digital transformation across various industrial sectors and the evolving nature of cyber threats, requiring continuous adaptation and improvement of security measures. Restraints include high initial investment costs for implementing OT security solutions, the need for skilled cybersecurity professionals, and the complexity of integrating security measures within legacy industrial systems.
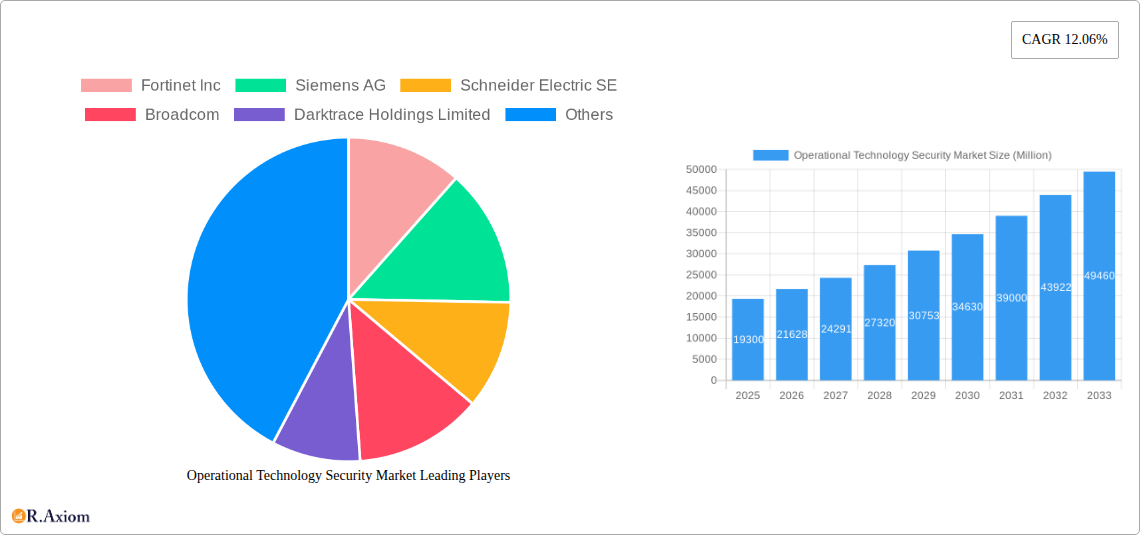
Operational Technology Security Market Company Market Share
Operational Technology Security Market: A Comprehensive Report (2019-2033)
This in-depth report provides a comprehensive analysis of the Operational Technology (OT) Security market, offering actionable insights for stakeholders across the value chain. The study period covers 2019-2033, with 2025 serving as the base and estimated year. The report forecasts market trends from 2025 to 2033, utilizing data from the historical period of 2019-2024. The market is expected to reach xx Million by 2033, exhibiting a CAGR of xx% during the forecast period.
Operational Technology Security Market Concentration & Innovation
The OT security market exhibits a moderately concentrated landscape, with key players like Fortinet Inc, Siemens AG, Schneider Electric SE, and Rockwell Automation Inc holding significant market share. However, the market is also witnessing increased participation from specialized cybersecurity firms and startups, driving innovation and competition. Market share data for 2024 indicates that the top 5 players account for approximately xx% of the total market, while the remaining share is distributed among numerous smaller players. The average M&A deal value in the sector during 2023-2024 was approximately xx Million, reflecting consolidation and strategic acquisitions aimed at expanding product portfolios and market reach.
- Innovation Drivers: Growing adoption of Industrial IoT (IIoT), increasing digitalization of industrial processes, and rising concerns about cybersecurity threats are major drivers of innovation.
- Regulatory Frameworks: Stringent government regulations related to data privacy and critical infrastructure protection are shaping market dynamics and driving demand for robust OT security solutions.
- Product Substitutes: Limited direct substitutes exist, but alternative approaches like improved network segmentation and enhanced physical security measures are influencing market competition.
- End-User Trends: The manufacturing, energy, and transportation sectors are leading adopters of OT security solutions, driving significant market growth.
- M&A Activities: Increased merger and acquisition activity signifies consolidation and an effort by larger players to expand their market presence and capabilities.
Operational Technology Security Market Industry Trends & Insights
The OT security market is experiencing robust growth, propelled by several factors. The increasing adoption of connected devices and IIoT across various industries is expanding the attack surface, making OT security a critical concern. Furthermore, stringent regulatory compliance requirements are driving investments in OT security solutions. The market is also witnessing technological disruptions such as advancements in artificial intelligence (AI) and machine learning (ML) for threat detection and response. These technologies enhance the ability to identify and mitigate cyber threats in real-time. Consumer preferences are shifting towards integrated and comprehensive security solutions offering advanced threat detection, vulnerability management, and incident response capabilities. Competitive dynamics are characterized by both intense competition among established players and the emergence of new entrants offering specialized solutions. Market penetration of advanced OT security solutions like network segmentation and intrusion detection systems is still relatively low but exhibiting rapid growth.
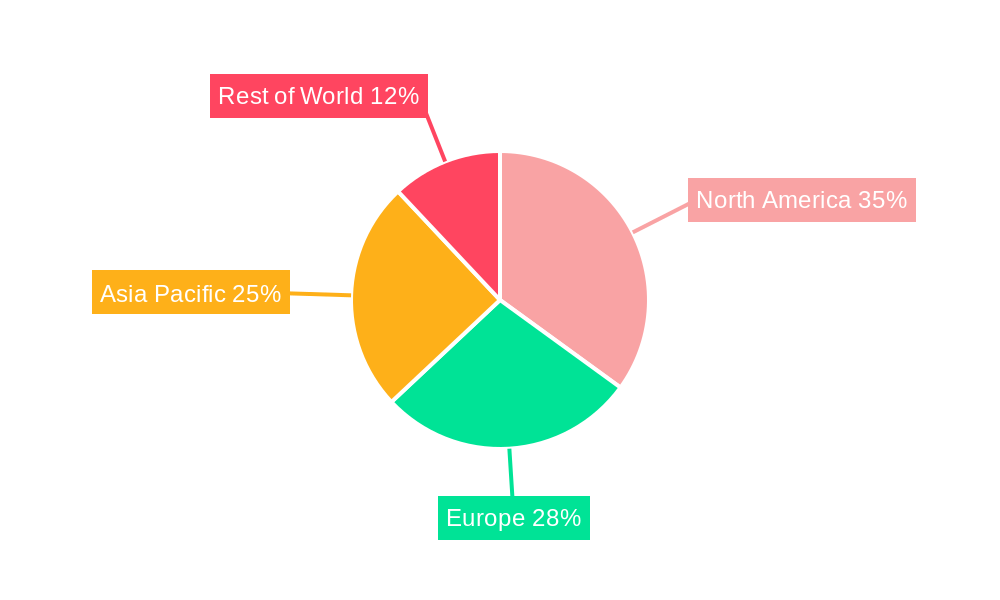
Dominant Markets & Segments in Operational Technology Security Market
The North American region currently dominates the OT security market, primarily driven by strong regulatory frameworks, a high concentration of critical infrastructure, and significant investments in digital transformation initiatives. Europe and Asia-Pacific are also experiencing significant growth, driven by increasing industrial automation and digitalization efforts across these regions.
Key Drivers for North American Dominance:
- Robust regulatory environment mandating cybersecurity measures for critical infrastructure.
- High adoption rate of advanced technologies like AI and ML in OT security solutions.
- Significant investments in digital transformation across key industries.
- Strong presence of major OT security vendors.
Other Regions: While North America holds the lead, both Europe and Asia-Pacific exhibit high growth potential driven by increasing industrialization and government initiatives promoting cybersecurity.
Operational Technology Security Market Product Developments
Recent product innovations focus on AI-powered threat detection, advanced vulnerability management tools, and integrated security platforms that encompass various aspects of OT security. These solutions are tailored to meet the specific needs of different industrial sectors, offering improved visibility, enhanced threat response capabilities, and streamlined management. The competitive advantage lies in offering sophisticated solutions that seamlessly integrate into existing OT environments while providing real-time threat detection and mitigation.
Report Scope & Segmentation Analysis
This report segments the OT security market based on several factors:
By Component: Hardware (sensors, network devices, gateways), Software (security information and event management (SIEM) tools, intrusion detection systems, vulnerability scanners), Services (consulting, integration, and managed security services). Hardware segment holds the largest market share currently but the software and service segments are demonstrating the fastest growth rates.
By Deployment Model: Cloud-based, On-premises. Cloud-based deployments are gaining traction due to scalability and cost-effectiveness.
By End-User: Manufacturing, Energy, Transportation, Healthcare, Others. Manufacturing currently accounts for the largest market share.
By Geography: North America, Europe, Asia Pacific, Middle East and Africa, South America.
Key Drivers of Operational Technology Security Market Growth
Several factors are driving the growth of the OT security market:
- Increasing Cyber Threats: The rising frequency and sophistication of cyberattacks targeting industrial control systems (ICS) are escalating the demand for robust security solutions.
- Growing Adoption of IIoT: The proliferation of connected devices in industrial environments expands the attack surface, making OT security crucial.
- Stringent Regulatory Compliance: Governments worldwide are implementing stricter regulations requiring improved cybersecurity measures for critical infrastructure, driving adoption of OT security solutions.
- Digital Transformation Initiatives: Companies undergoing digital transformation are investing heavily in OT security to protect their critical infrastructure and data.
Challenges in the Operational Technology Security Market Sector
Despite the significant growth potential, the OT security market faces several challenges:
- Legacy Systems: Many industrial organizations rely on legacy systems incompatible with modern security solutions, hindering adoption. This presents a significant obstacle in the implementation of up-to-date security protocols.
- Skills Gap: A shortage of skilled cybersecurity professionals hinders the effective implementation and management of OT security solutions.
- High Implementation Costs: The cost of implementing and maintaining comprehensive OT security solutions can be a barrier for smaller organizations.
Emerging Opportunities in Operational Technology Security Market
The OT security market presents several emerging opportunities:
- AI-powered Threat Detection: The use of artificial intelligence and machine learning for threat detection is rapidly gaining traction, offering improved accuracy and efficiency.
- Secure Remote Access Solutions: The increasing need for remote maintenance and monitoring of industrial assets is driving demand for secure remote access solutions.
- IoT Security Solutions: Specialized security solutions addressing the unique security challenges of IoT devices in industrial settings present a significant growth opportunity.
Leading Players in the Operational Technology Security Market Market
Key Developments in Operational Technology Security Market Industry
February 2024: Mitsubishi Electric Corporation partnered with Dispel LLC to enhance its OT security business through improved marketing and technical development. This reflects the growing importance of strategic partnerships in the OT security market.
February 2024: The US Department of Energy (DOE) collaborated with Rockwell Automation on a cybersecurity vulnerability assessment program. This underscores the increasing focus on critical infrastructure protection and the role of private-public partnerships in bolstering OT security.
Strategic Outlook for Operational Technology Security Market Market
The OT security market is poised for continued strong growth driven by the increasing interconnectedness of industrial systems, rising cyber threats, and stringent regulatory compliance requirements. The market will witness ongoing innovation in areas such as AI-powered threat detection, advanced vulnerability management, and secure remote access solutions. Strategic partnerships and acquisitions will continue to reshape the competitive landscape, leading to consolidation and the emergence of comprehensive security platforms. The market's growth trajectory is expected to remain positive throughout the forecast period, driven by a persistent need for robust security measures to protect critical infrastructure and safeguard sensitive industrial data.
Operational Technology Security Market Segmentation
-
1. Component
- 1.1. Solutions
- 1.2. Services
-
2. Deployment Mode
- 2.1. On-Premises
- 2.2. Cloud
-
3. End-User Industry
- 3.1. Manufacturing
- 3.2. Oil and Gas
- 3.3. Power Utilities
- 3.4. Transportation and Logistics
- 3.5. Others
Operational Technology Security Market Segmentation By Geography
- 1. North America
- 2. Europe
- 3. Asia
- 4. Australia and New Zealand
- 5. Latin America
- 6. Middle East and Africa
Operational Technology Security Market Regional Market Share
Geographic Coverage of Operational Technology Security Market
Operational Technology Security Market REPORT HIGHLIGHTS
| Aspects | Details |
|---|---|
| Study Period | 2020-2034 |
| Base Year | 2025 |
| Estimated Year | 2026 |
| Forecast Period | 2026-2034 |
| Historical Period | 2020-2025 |
| Growth Rate | CAGR of 12.06% from 2020-2034 |
| Segmentation |
|
Table of Contents
- 1. Introduction
- 1.1. Research Scope
- 1.2. Market Segmentation
- 1.3. Research Objective
- 1.4. Definitions and Assumptions
- 2. Executive Summary
- 2.1. Market Snapshot
- 3. Market Dynamics
- 3.1. Market Drivers
- 3.2. Market Restrains
- 3.3. Market Trends
- 3.4. Market Opportunities
- 4. Market Factor Analysis
- 4.1. Porters Five Forces
- 4.1.1. Bargaining Power of Suppliers
- 4.1.2. Bargaining Power of Buyers
- 4.1.3. Threat of New Entrants
- 4.1.4. Threat of Substitutes
- 4.1.5. Competitive Rivalry
- 4.2. PESTEL analysis
- 4.3. BCG Analysis
- 4.3.1. Stars (High Growth, High Market Share)
- 4.3.2. Cash Cows (Low Growth, High Market Share)
- 4.3.3. Question Mark (High Growth, Low Market Share)
- 4.3.4. Dogs (Low Growth, Low Market Share)
- 4.4. Ansoff Matrix Analysis
- 4.5. Supply Chain Analysis
- 4.6. Regulatory Landscape
- 4.7. Current Market Potential and Opportunity Assessment (TAM–SAM–SOM Framework)
- 4.8. RAX Analyst Note
- 4.1. Porters Five Forces
- 5. Market Analysis, Insights and Forecast 2021-2033
- 5.1. Market Analysis, Insights and Forecast - by Component
- 5.1.1. Solutions
- 5.1.2. Services
- 5.2. Market Analysis, Insights and Forecast - by Deployment Mode
- 5.2.1. On-Premises
- 5.2.2. Cloud
- 5.3. Market Analysis, Insights and Forecast - by End-User Industry
- 5.3.1. Manufacturing
- 5.3.2. Oil and Gas
- 5.3.3. Power Utilities
- 5.3.4. Transportation and Logistics
- 5.3.5. Others
- 5.4. Market Analysis, Insights and Forecast - by Region
- 5.4.1. North America
- 5.4.2. Europe
- 5.4.3. Asia
- 5.4.4. Australia and New Zealand
- 5.4.5. Latin America
- 5.4.6. Middle East and Africa
- 5.1. Market Analysis, Insights and Forecast - by Component
- 6. Global Operational Technology Security Market Analysis, Insights and Forecast, 2021-2033
- 6.1. Market Analysis, Insights and Forecast - by Component
- 6.1.1. Solutions
- 6.1.2. Services
- 6.2. Market Analysis, Insights and Forecast - by Deployment Mode
- 6.2.1. On-Premises
- 6.2.2. Cloud
- 6.3. Market Analysis, Insights and Forecast - by End-User Industry
- 6.3.1. Manufacturing
- 6.3.2. Oil and Gas
- 6.3.3. Power Utilities
- 6.3.4. Transportation and Logistics
- 6.3.5. Others
- 6.1. Market Analysis, Insights and Forecast - by Component
- 7. North America Operational Technology Security Market Analysis, Insights and Forecast, 2020-2032
- 7.1. Market Analysis, Insights and Forecast - by Component
- 7.1.1. Solutions
- 7.1.2. Services
- 7.2. Market Analysis, Insights and Forecast - by Deployment Mode
- 7.2.1. On-Premises
- 7.2.2. Cloud
- 7.3. Market Analysis, Insights and Forecast - by End-User Industry
- 7.3.1. Manufacturing
- 7.3.2. Oil and Gas
- 7.3.3. Power Utilities
- 7.3.4. Transportation and Logistics
- 7.3.5. Others
- 7.1. Market Analysis, Insights and Forecast - by Component
- 8. Europe Operational Technology Security Market Analysis, Insights and Forecast, 2020-2032
- 8.1. Market Analysis, Insights and Forecast - by Component
- 8.1.1. Solutions
- 8.1.2. Services
- 8.2. Market Analysis, Insights and Forecast - by Deployment Mode
- 8.2.1. On-Premises
- 8.2.2. Cloud
- 8.3. Market Analysis, Insights and Forecast - by End-User Industry
- 8.3.1. Manufacturing
- 8.3.2. Oil and Gas
- 8.3.3. Power Utilities
- 8.3.4. Transportation and Logistics
- 8.3.5. Others
- 8.1. Market Analysis, Insights and Forecast - by Component
- 9. Asia Operational Technology Security Market Analysis, Insights and Forecast, 2020-2032
- 9.1. Market Analysis, Insights and Forecast - by Component
- 9.1.1. Solutions
- 9.1.2. Services
- 9.2. Market Analysis, Insights and Forecast - by Deployment Mode
- 9.2.1. On-Premises
- 9.2.2. Cloud
- 9.3. Market Analysis, Insights and Forecast - by End-User Industry
- 9.3.1. Manufacturing
- 9.3.2. Oil and Gas
- 9.3.3. Power Utilities
- 9.3.4. Transportation and Logistics
- 9.3.5. Others
- 9.1. Market Analysis, Insights and Forecast - by Component
- 10. Australia and New Zealand Operational Technology Security Market Analysis, Insights and Forecast, 2020-2032
- 10.1. Market Analysis, Insights and Forecast - by Component
- 10.1.1. Solutions
- 10.1.2. Services
- 10.2. Market Analysis, Insights and Forecast - by Deployment Mode
- 10.2.1. On-Premises
- 10.2.2. Cloud
- 10.3. Market Analysis, Insights and Forecast - by End-User Industry
- 10.3.1. Manufacturing
- 10.3.2. Oil and Gas
- 10.3.3. Power Utilities
- 10.3.4. Transportation and Logistics
- 10.3.5. Others
- 10.1. Market Analysis, Insights and Forecast - by Component
- 11. Latin America Operational Technology Security Market Analysis, Insights and Forecast, 2020-2032
- 11.1. Market Analysis, Insights and Forecast - by Component
- 11.1.1. Solutions
- 11.1.2. Services
- 11.2. Market Analysis, Insights and Forecast - by Deployment Mode
- 11.2.1. On-Premises
- 11.2.2. Cloud
- 11.3. Market Analysis, Insights and Forecast - by End-User Industry
- 11.3.1. Manufacturing
- 11.3.2. Oil and Gas
- 11.3.3. Power Utilities
- 11.3.4. Transportation and Logistics
- 11.3.5. Others
- 11.1. Market Analysis, Insights and Forecast - by Component
- 12. Middle East and Africa Operational Technology Security Market Analysis, Insights and Forecast, 2020-2032
- 12.1. Market Analysis, Insights and Forecast - by Component
- 12.1.1. Solutions
- 12.1.2. Services
- 12.2. Market Analysis, Insights and Forecast - by Deployment Mode
- 12.2.1. On-Premises
- 12.2.2. Cloud
- 12.3. Market Analysis, Insights and Forecast - by End-User Industry
- 12.3.1. Manufacturing
- 12.3.2. Oil and Gas
- 12.3.3. Power Utilities
- 12.3.4. Transportation and Logistics
- 12.3.5. Others
- 12.1. Market Analysis, Insights and Forecast - by Component
- 13. Competitive Analysis
- 13.1. Company Profiles
- 13.1.1 Fortinet Inc
- 13.1.1.1. Company Overview
- 13.1.1.2. Products
- 13.1.1.3. Company Financials
- 13.1.1.4. SWOT Analysis
- 13.1.2 Siemens AG
- 13.1.2.1. Company Overview
- 13.1.2.2. Products
- 13.1.2.3. Company Financials
- 13.1.2.4. SWOT Analysis
- 13.1.3 Schneider Electric SE
- 13.1.3.1. Company Overview
- 13.1.3.2. Products
- 13.1.3.3. Company Financials
- 13.1.3.4. SWOT Analysis
- 13.1.4 Broadcom
- 13.1.4.1. Company Overview
- 13.1.4.2. Products
- 13.1.4.3. Company Financials
- 13.1.4.4. SWOT Analysis
- 13.1.5 Darktrace Holdings Limited
- 13.1.5.1. Company Overview
- 13.1.5.2. Products
- 13.1.5.3. Company Financials
- 13.1.5.4. SWOT Analysis
- 13.1.6 Nozomi Networks
- 13.1.6.1. Company Overview
- 13.1.6.2. Products
- 13.1.6.3. Company Financials
- 13.1.6.4. SWOT Analysis
- 13.1.7 Rockwell Automation Inc
- 13.1.7.1. Company Overview
- 13.1.7.2. Products
- 13.1.7.3. Company Financials
- 13.1.7.4. SWOT Analysis
- 13.1.8 Honeywell International Inc
- 13.1.8.1. Company Overview
- 13.1.8.2. Products
- 13.1.8.3. Company Financials
- 13.1.8.4. SWOT Analysis
- 13.1.9 GE Vernova (General Electric)
- 13.1.9.1. Company Overview
- 13.1.9.2. Products
- 13.1.9.3. Company Financials
- 13.1.9.4. SWOT Analysis
- 13.1.10 Claroty
- 13.1.10.1. Company Overview
- 13.1.10.2. Products
- 13.1.10.3. Company Financials
- 13.1.10.4. SWOT Analysis
- 13.1.11 Palo Alto Network
- 13.1.11.1. Company Overview
- 13.1.11.2. Products
- 13.1.11.3. Company Financials
- 13.1.11.4. SWOT Analysis
- 13.1.1 Fortinet Inc
- 13.2. Market Entropy
- 13.2.1 Company's Key Areas Served
- 13.2.2 Recent Developments
- 13.3. Company Market Share Analysis 2025
- 13.3.1 Top 5 Companies Market Share Analysis
- 13.3.2 Top 3 Companies Market Share Analysis
- 13.4. List of Potential Customers
- 14. Research Methodology
List of Figures
- Figure 1: Global Operational Technology Security Market Revenue Breakdown (Million, %) by Region 2025 & 2033
- Figure 2: Global Operational Technology Security Market Volume Breakdown (Billion, %) by Region 2025 & 2033
- Figure 3: North America Operational Technology Security Market Revenue (Million), by Component 2025 & 2033
- Figure 4: North America Operational Technology Security Market Volume (Billion), by Component 2025 & 2033
- Figure 5: North America Operational Technology Security Market Revenue Share (%), by Component 2025 & 2033
- Figure 6: North America Operational Technology Security Market Volume Share (%), by Component 2025 & 2033
- Figure 7: North America Operational Technology Security Market Revenue (Million), by Deployment Mode 2025 & 2033
- Figure 8: North America Operational Technology Security Market Volume (Billion), by Deployment Mode 2025 & 2033
- Figure 9: North America Operational Technology Security Market Revenue Share (%), by Deployment Mode 2025 & 2033
- Figure 10: North America Operational Technology Security Market Volume Share (%), by Deployment Mode 2025 & 2033
- Figure 11: North America Operational Technology Security Market Revenue (Million), by End-User Industry 2025 & 2033
- Figure 12: North America Operational Technology Security Market Volume (Billion), by End-User Industry 2025 & 2033
- Figure 13: North America Operational Technology Security Market Revenue Share (%), by End-User Industry 2025 & 2033
- Figure 14: North America Operational Technology Security Market Volume Share (%), by End-User Industry 2025 & 2033
- Figure 15: North America Operational Technology Security Market Revenue (Million), by Country 2025 & 2033
- Figure 16: North America Operational Technology Security Market Volume (Billion), by Country 2025 & 2033
- Figure 17: North America Operational Technology Security Market Revenue Share (%), by Country 2025 & 2033
- Figure 18: North America Operational Technology Security Market Volume Share (%), by Country 2025 & 2033
- Figure 19: Europe Operational Technology Security Market Revenue (Million), by Component 2025 & 2033
- Figure 20: Europe Operational Technology Security Market Volume (Billion), by Component 2025 & 2033
- Figure 21: Europe Operational Technology Security Market Revenue Share (%), by Component 2025 & 2033
- Figure 22: Europe Operational Technology Security Market Volume Share (%), by Component 2025 & 2033
- Figure 23: Europe Operational Technology Security Market Revenue (Million), by Deployment Mode 2025 & 2033
- Figure 24: Europe Operational Technology Security Market Volume (Billion), by Deployment Mode 2025 & 2033
- Figure 25: Europe Operational Technology Security Market Revenue Share (%), by Deployment Mode 2025 & 2033
- Figure 26: Europe Operational Technology Security Market Volume Share (%), by Deployment Mode 2025 & 2033
- Figure 27: Europe Operational Technology Security Market Revenue (Million), by End-User Industry 2025 & 2033
- Figure 28: Europe Operational Technology Security Market Volume (Billion), by End-User Industry 2025 & 2033
- Figure 29: Europe Operational Technology Security Market Revenue Share (%), by End-User Industry 2025 & 2033
- Figure 30: Europe Operational Technology Security Market Volume Share (%), by End-User Industry 2025 & 2033
- Figure 31: Europe Operational Technology Security Market Revenue (Million), by Country 2025 & 2033
- Figure 32: Europe Operational Technology Security Market Volume (Billion), by Country 2025 & 2033
- Figure 33: Europe Operational Technology Security Market Revenue Share (%), by Country 2025 & 2033
- Figure 34: Europe Operational Technology Security Market Volume Share (%), by Country 2025 & 2033
- Figure 35: Asia Operational Technology Security Market Revenue (Million), by Component 2025 & 2033
- Figure 36: Asia Operational Technology Security Market Volume (Billion), by Component 2025 & 2033
- Figure 37: Asia Operational Technology Security Market Revenue Share (%), by Component 2025 & 2033
- Figure 38: Asia Operational Technology Security Market Volume Share (%), by Component 2025 & 2033
- Figure 39: Asia Operational Technology Security Market Revenue (Million), by Deployment Mode 2025 & 2033
- Figure 40: Asia Operational Technology Security Market Volume (Billion), by Deployment Mode 2025 & 2033
- Figure 41: Asia Operational Technology Security Market Revenue Share (%), by Deployment Mode 2025 & 2033
- Figure 42: Asia Operational Technology Security Market Volume Share (%), by Deployment Mode 2025 & 2033
- Figure 43: Asia Operational Technology Security Market Revenue (Million), by End-User Industry 2025 & 2033
- Figure 44: Asia Operational Technology Security Market Volume (Billion), by End-User Industry 2025 & 2033
- Figure 45: Asia Operational Technology Security Market Revenue Share (%), by End-User Industry 2025 & 2033
- Figure 46: Asia Operational Technology Security Market Volume Share (%), by End-User Industry 2025 & 2033
- Figure 47: Asia Operational Technology Security Market Revenue (Million), by Country 2025 & 2033
- Figure 48: Asia Operational Technology Security Market Volume (Billion), by Country 2025 & 2033
- Figure 49: Asia Operational Technology Security Market Revenue Share (%), by Country 2025 & 2033
- Figure 50: Asia Operational Technology Security Market Volume Share (%), by Country 2025 & 2033
- Figure 51: Australia and New Zealand Operational Technology Security Market Revenue (Million), by Component 2025 & 2033
- Figure 52: Australia and New Zealand Operational Technology Security Market Volume (Billion), by Component 2025 & 2033
- Figure 53: Australia and New Zealand Operational Technology Security Market Revenue Share (%), by Component 2025 & 2033
- Figure 54: Australia and New Zealand Operational Technology Security Market Volume Share (%), by Component 2025 & 2033
- Figure 55: Australia and New Zealand Operational Technology Security Market Revenue (Million), by Deployment Mode 2025 & 2033
- Figure 56: Australia and New Zealand Operational Technology Security Market Volume (Billion), by Deployment Mode 2025 & 2033
- Figure 57: Australia and New Zealand Operational Technology Security Market Revenue Share (%), by Deployment Mode 2025 & 2033
- Figure 58: Australia and New Zealand Operational Technology Security Market Volume Share (%), by Deployment Mode 2025 & 2033
- Figure 59: Australia and New Zealand Operational Technology Security Market Revenue (Million), by End-User Industry 2025 & 2033
- Figure 60: Australia and New Zealand Operational Technology Security Market Volume (Billion), by End-User Industry 2025 & 2033
- Figure 61: Australia and New Zealand Operational Technology Security Market Revenue Share (%), by End-User Industry 2025 & 2033
- Figure 62: Australia and New Zealand Operational Technology Security Market Volume Share (%), by End-User Industry 2025 & 2033
- Figure 63: Australia and New Zealand Operational Technology Security Market Revenue (Million), by Country 2025 & 2033
- Figure 64: Australia and New Zealand Operational Technology Security Market Volume (Billion), by Country 2025 & 2033
- Figure 65: Australia and New Zealand Operational Technology Security Market Revenue Share (%), by Country 2025 & 2033
- Figure 66: Australia and New Zealand Operational Technology Security Market Volume Share (%), by Country 2025 & 2033
- Figure 67: Latin America Operational Technology Security Market Revenue (Million), by Component 2025 & 2033
- Figure 68: Latin America Operational Technology Security Market Volume (Billion), by Component 2025 & 2033
- Figure 69: Latin America Operational Technology Security Market Revenue Share (%), by Component 2025 & 2033
- Figure 70: Latin America Operational Technology Security Market Volume Share (%), by Component 2025 & 2033
- Figure 71: Latin America Operational Technology Security Market Revenue (Million), by Deployment Mode 2025 & 2033
- Figure 72: Latin America Operational Technology Security Market Volume (Billion), by Deployment Mode 2025 & 2033
- Figure 73: Latin America Operational Technology Security Market Revenue Share (%), by Deployment Mode 2025 & 2033
- Figure 74: Latin America Operational Technology Security Market Volume Share (%), by Deployment Mode 2025 & 2033
- Figure 75: Latin America Operational Technology Security Market Revenue (Million), by End-User Industry 2025 & 2033
- Figure 76: Latin America Operational Technology Security Market Volume (Billion), by End-User Industry 2025 & 2033
- Figure 77: Latin America Operational Technology Security Market Revenue Share (%), by End-User Industry 2025 & 2033
- Figure 78: Latin America Operational Technology Security Market Volume Share (%), by End-User Industry 2025 & 2033
- Figure 79: Latin America Operational Technology Security Market Revenue (Million), by Country 2025 & 2033
- Figure 80: Latin America Operational Technology Security Market Volume (Billion), by Country 2025 & 2033
- Figure 81: Latin America Operational Technology Security Market Revenue Share (%), by Country 2025 & 2033
- Figure 82: Latin America Operational Technology Security Market Volume Share (%), by Country 2025 & 2033
- Figure 83: Middle East and Africa Operational Technology Security Market Revenue (Million), by Component 2025 & 2033
- Figure 84: Middle East and Africa Operational Technology Security Market Volume (Billion), by Component 2025 & 2033
- Figure 85: Middle East and Africa Operational Technology Security Market Revenue Share (%), by Component 2025 & 2033
- Figure 86: Middle East and Africa Operational Technology Security Market Volume Share (%), by Component 2025 & 2033
- Figure 87: Middle East and Africa Operational Technology Security Market Revenue (Million), by Deployment Mode 2025 & 2033
- Figure 88: Middle East and Africa Operational Technology Security Market Volume (Billion), by Deployment Mode 2025 & 2033
- Figure 89: Middle East and Africa Operational Technology Security Market Revenue Share (%), by Deployment Mode 2025 & 2033
- Figure 90: Middle East and Africa Operational Technology Security Market Volume Share (%), by Deployment Mode 2025 & 2033
- Figure 91: Middle East and Africa Operational Technology Security Market Revenue (Million), by End-User Industry 2025 & 2033
- Figure 92: Middle East and Africa Operational Technology Security Market Volume (Billion), by End-User Industry 2025 & 2033
- Figure 93: Middle East and Africa Operational Technology Security Market Revenue Share (%), by End-User Industry 2025 & 2033
- Figure 94: Middle East and Africa Operational Technology Security Market Volume Share (%), by End-User Industry 2025 & 2033
- Figure 95: Middle East and Africa Operational Technology Security Market Revenue (Million), by Country 2025 & 2033
- Figure 96: Middle East and Africa Operational Technology Security Market Volume (Billion), by Country 2025 & 2033
- Figure 97: Middle East and Africa Operational Technology Security Market Revenue Share (%), by Country 2025 & 2033
- Figure 98: Middle East and Africa Operational Technology Security Market Volume Share (%), by Country 2025 & 2033
List of Tables
- Table 1: Global Operational Technology Security Market Revenue Million Forecast, by Component 2020 & 2033
- Table 2: Global Operational Technology Security Market Volume Billion Forecast, by Component 2020 & 2033
- Table 3: Global Operational Technology Security Market Revenue Million Forecast, by Deployment Mode 2020 & 2033
- Table 4: Global Operational Technology Security Market Volume Billion Forecast, by Deployment Mode 2020 & 2033
- Table 5: Global Operational Technology Security Market Revenue Million Forecast, by End-User Industry 2020 & 2033
- Table 6: Global Operational Technology Security Market Volume Billion Forecast, by End-User Industry 2020 & 2033
- Table 7: Global Operational Technology Security Market Revenue Million Forecast, by Region 2020 & 2033
- Table 8: Global Operational Technology Security Market Volume Billion Forecast, by Region 2020 & 2033
- Table 9: Global Operational Technology Security Market Revenue Million Forecast, by Component 2020 & 2033
- Table 10: Global Operational Technology Security Market Volume Billion Forecast, by Component 2020 & 2033
- Table 11: Global Operational Technology Security Market Revenue Million Forecast, by Deployment Mode 2020 & 2033
- Table 12: Global Operational Technology Security Market Volume Billion Forecast, by Deployment Mode 2020 & 2033
- Table 13: Global Operational Technology Security Market Revenue Million Forecast, by End-User Industry 2020 & 2033
- Table 14: Global Operational Technology Security Market Volume Billion Forecast, by End-User Industry 2020 & 2033
- Table 15: Global Operational Technology Security Market Revenue Million Forecast, by Country 2020 & 2033
- Table 16: Global Operational Technology Security Market Volume Billion Forecast, by Country 2020 & 2033
- Table 17: Global Operational Technology Security Market Revenue Million Forecast, by Component 2020 & 2033
- Table 18: Global Operational Technology Security Market Volume Billion Forecast, by Component 2020 & 2033
- Table 19: Global Operational Technology Security Market Revenue Million Forecast, by Deployment Mode 2020 & 2033
- Table 20: Global Operational Technology Security Market Volume Billion Forecast, by Deployment Mode 2020 & 2033
- Table 21: Global Operational Technology Security Market Revenue Million Forecast, by End-User Industry 2020 & 2033
- Table 22: Global Operational Technology Security Market Volume Billion Forecast, by End-User Industry 2020 & 2033
- Table 23: Global Operational Technology Security Market Revenue Million Forecast, by Country 2020 & 2033
- Table 24: Global Operational Technology Security Market Volume Billion Forecast, by Country 2020 & 2033
- Table 25: Global Operational Technology Security Market Revenue Million Forecast, by Component 2020 & 2033
- Table 26: Global Operational Technology Security Market Volume Billion Forecast, by Component 2020 & 2033
- Table 27: Global Operational Technology Security Market Revenue Million Forecast, by Deployment Mode 2020 & 2033
- Table 28: Global Operational Technology Security Market Volume Billion Forecast, by Deployment Mode 2020 & 2033
- Table 29: Global Operational Technology Security Market Revenue Million Forecast, by End-User Industry 2020 & 2033
- Table 30: Global Operational Technology Security Market Volume Billion Forecast, by End-User Industry 2020 & 2033
- Table 31: Global Operational Technology Security Market Revenue Million Forecast, by Country 2020 & 2033
- Table 32: Global Operational Technology Security Market Volume Billion Forecast, by Country 2020 & 2033
- Table 33: Global Operational Technology Security Market Revenue Million Forecast, by Component 2020 & 2033
- Table 34: Global Operational Technology Security Market Volume Billion Forecast, by Component 2020 & 2033
- Table 35: Global Operational Technology Security Market Revenue Million Forecast, by Deployment Mode 2020 & 2033
- Table 36: Global Operational Technology Security Market Volume Billion Forecast, by Deployment Mode 2020 & 2033
- Table 37: Global Operational Technology Security Market Revenue Million Forecast, by End-User Industry 2020 & 2033
- Table 38: Global Operational Technology Security Market Volume Billion Forecast, by End-User Industry 2020 & 2033
- Table 39: Global Operational Technology Security Market Revenue Million Forecast, by Country 2020 & 2033
- Table 40: Global Operational Technology Security Market Volume Billion Forecast, by Country 2020 & 2033
- Table 41: Global Operational Technology Security Market Revenue Million Forecast, by Component 2020 & 2033
- Table 42: Global Operational Technology Security Market Volume Billion Forecast, by Component 2020 & 2033
- Table 43: Global Operational Technology Security Market Revenue Million Forecast, by Deployment Mode 2020 & 2033
- Table 44: Global Operational Technology Security Market Volume Billion Forecast, by Deployment Mode 2020 & 2033
- Table 45: Global Operational Technology Security Market Revenue Million Forecast, by End-User Industry 2020 & 2033
- Table 46: Global Operational Technology Security Market Volume Billion Forecast, by End-User Industry 2020 & 2033
- Table 47: Global Operational Technology Security Market Revenue Million Forecast, by Country 2020 & 2033
- Table 48: Global Operational Technology Security Market Volume Billion Forecast, by Country 2020 & 2033
- Table 49: Global Operational Technology Security Market Revenue Million Forecast, by Component 2020 & 2033
- Table 50: Global Operational Technology Security Market Volume Billion Forecast, by Component 2020 & 2033
- Table 51: Global Operational Technology Security Market Revenue Million Forecast, by Deployment Mode 2020 & 2033
- Table 52: Global Operational Technology Security Market Volume Billion Forecast, by Deployment Mode 2020 & 2033
- Table 53: Global Operational Technology Security Market Revenue Million Forecast, by End-User Industry 2020 & 2033
- Table 54: Global Operational Technology Security Market Volume Billion Forecast, by End-User Industry 2020 & 2033
- Table 55: Global Operational Technology Security Market Revenue Million Forecast, by Country 2020 & 2033
- Table 56: Global Operational Technology Security Market Volume Billion Forecast, by Country 2020 & 2033
Frequently Asked Questions
1. What is the projected Compound Annual Growth Rate (CAGR) of the Operational Technology Security Market?
The projected CAGR is approximately 12.06%.
2. Which companies are prominent players in the Operational Technology Security Market?
Key companies in the market include Fortinet Inc, Siemens AG, Schneider Electric SE, Broadcom, Darktrace Holdings Limited, Nozomi Networks, Rockwell Automation Inc, Honeywell International Inc, GE Vernova (General Electric), Claroty, Palo Alto Network.
3. What are the main segments of the Operational Technology Security Market?
The market segments include Component, Deployment Mode, End-User Industry.
4. Can you provide details about the market size?
The market size is estimated to be USD 19.30 Million as of 2022.
5. What are some drivers contributing to market growth?
Surge in Cyber-Attacks Targeting Critical Infrastructure; Increased Integration of Government Initiatives into Security Standards.
6. What are the notable trends driving market growth?
Oil and Gas End User Segment is Expected to Witness Significant Growth.
7. Are there any restraints impacting market growth?
Surge in Cyber-Attacks Targeting Critical Infrastructure; Increased Integration of Government Initiatives into Security Standards.
8. Can you provide examples of recent developments in the market?
February 2024: Mitsubishi Electric Corporation inked a deal with Dispel LLC to bolster its operational technology (OT) security business via enhanced marketing and technical development. As manufacturing undergoes globalization and embraces IoT and digital transformation, there is a surging interest in remote maintenance. This technology allows for internet monitoring and troubleshooting production lines from distant locations.
9. What pricing options are available for accessing the report?
Pricing options include single-user, multi-user, and enterprise licenses priced at USD 4750, USD 5250, and USD 8750 respectively.
10. Is the market size provided in terms of value or volume?
The market size is provided in terms of value, measured in Million and volume, measured in Billion.
11. Are there any specific market keywords associated with the report?
Yes, the market keyword associated with the report is "Operational Technology Security Market," which aids in identifying and referencing the specific market segment covered.
12. How do I determine which pricing option suits my needs best?
The pricing options vary based on user requirements and access needs. Individual users may opt for single-user licenses, while businesses requiring broader access may choose multi-user or enterprise licenses for cost-effective access to the report.
13. Are there any additional resources or data provided in the Operational Technology Security Market report?
While the report offers comprehensive insights, it's advisable to review the specific contents or supplementary materials provided to ascertain if additional resources or data are available.
14. How can I stay updated on further developments or reports in the Operational Technology Security Market?
To stay informed about further developments, trends, and reports in the Operational Technology Security Market, consider subscribing to industry newsletters, following relevant companies and organizations, or regularly checking reputable industry news sources and publications.
Methodology
Step 1 - Identification of Relevant Samples Size from Population Database


Step 2 - Approaches for Defining Global Market Size (Value, Volume* & Price*)

Note*: In applicable scenarios
Step 3 - Data Sources
Primary Research
- Web Analytics
- Survey Reports
- Research Institute
- Latest Research Reports
- Opinion Leaders
Secondary Research
- Annual Reports
- White Paper
- Latest Press Release
- Industry Association
- Paid Database
- Investor Presentations

Step 4 - Data Triangulation
Involves using different sources of information in order to increase the validity of a study
These sources are likely to be stakeholders in a program - participants, other researchers, program staff, other community members, and so on.
Then we put all data in single framework & apply various statistical tools to find out the dynamic on the market.
During the analysis stage, feedback from the stakeholder groups would be compared to determine areas of agreement as well as areas of divergence