
Key Insights
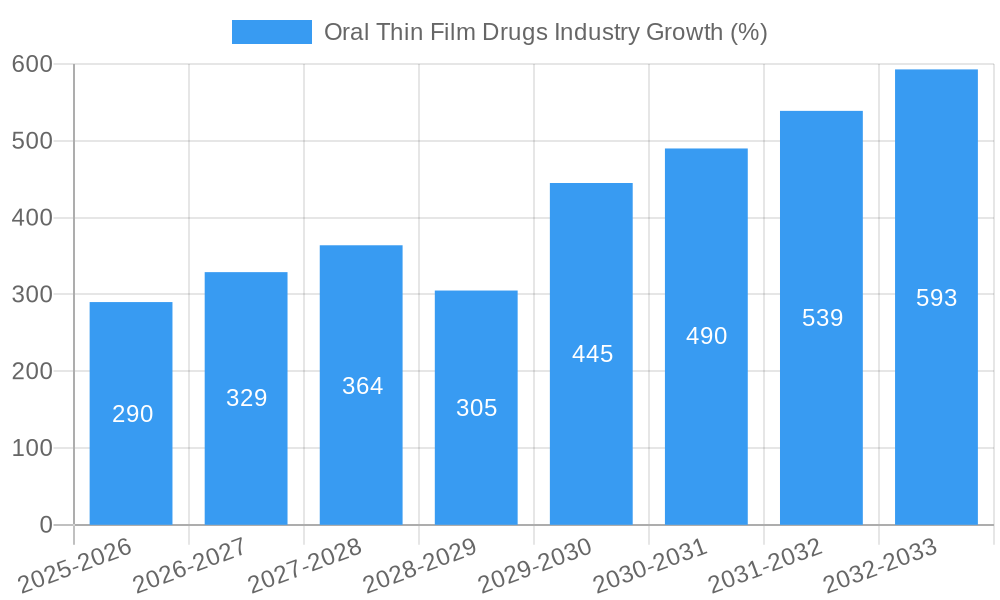
The oral thin film drug market, valued at $3.01 billion in 2025, is projected to experience robust growth, driven by a compound annual growth rate (CAGR) of 9.56% from 2025 to 2033. This expansion is fueled by several key factors. Firstly, the increasing prevalence of chronic conditions like opioid dependence and nausea & vomiting necessitates convenient and effective drug delivery systems. Oral thin films offer a distinct advantage with their rapid absorption, ease of administration, and improved patient compliance compared to traditional oral formulations. Secondly, technological advancements in thin film manufacturing are leading to enhanced product efficacy and stability, further boosting market adoption. The sublingual film segment currently holds a significant share, but other innovative product formats are emerging, driving future market segmentation. Finally, the strategic expansion of distribution channels, particularly within hospital and retail pharmacies, facilitates wider accessibility and contributes to market growth. However, regulatory hurdles and the development of generic alternatives represent potential market restraints.
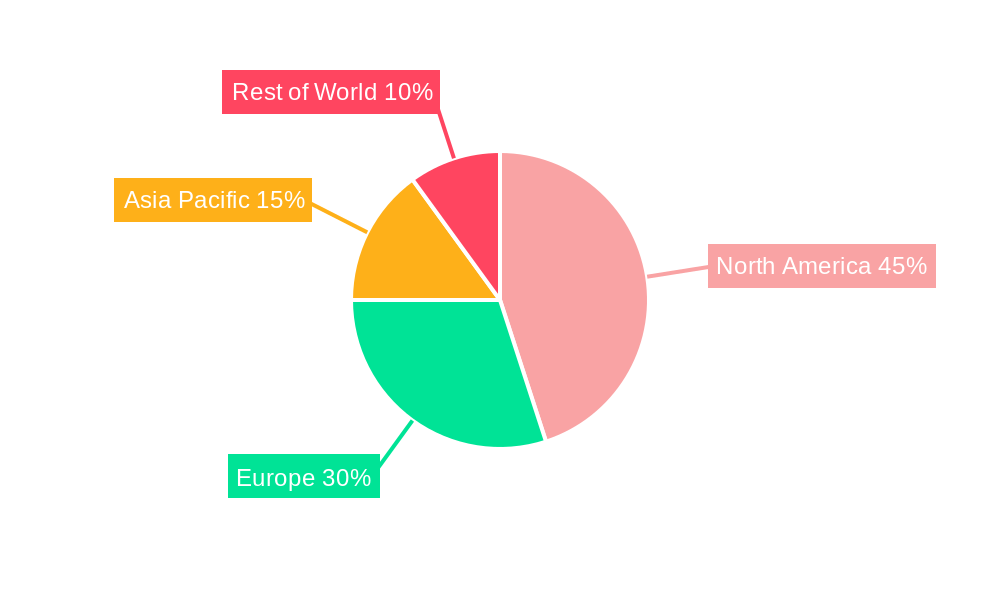
Geographical market segmentation reveals a significant concentration in North America, driven by high healthcare expenditure and advanced medical infrastructure. The European market is also expected to exhibit substantial growth, propelled by increasing healthcare investments and the growing adoption of innovative drug delivery technologies. The Asia-Pacific region, although currently having a smaller market share, presents a promising opportunity for growth owing to its large and expanding patient population and increasing disposable incomes. The competitive landscape includes established pharmaceutical companies like Sunovion Pharmaceuticals Inc and Viatris, alongside emerging players focused on innovation in drug delivery technologies, suggesting a dynamic and competitive market environment ripe for expansion and disruption. The continued focus on patient convenience, combined with the technological advancements in the manufacturing of oral thin films, positions this market for substantial future growth.

Oral Thin Film Drugs Industry Market Report: 2019-2033
This comprehensive report provides a detailed analysis of the Oral Thin Film Drugs industry, offering actionable insights for stakeholders across the value chain. Covering the period 2019-2033, with a focus on 2025, this report examines market dynamics, competitive landscapes, and future growth potential. The study incorporates granular segmentation, including disease indication, distribution channel, and product type, and provides crucial data points for strategic decision-making.
Oral Thin Film Drugs Industry Market Concentration & Innovation
The Oral Thin Film Drugs market exhibits a moderately concentrated landscape, with a few major players commanding significant market share. Sunovion Pharmaceuticals Inc, Aquestive Therapeutics Inc, and IntelGenx Corp are among the key players, actively engaged in research and development, and strategic acquisitions to expand their product portfolios. The market share for the top three players in 2024 was approximately xx%, reflecting a moderate level of consolidation. Innovation is a key driver, with companies focusing on developing novel drug formulations and delivery systems to improve patient compliance and efficacy. Regulatory frameworks, particularly those related to FDA approvals, play a significant role in shaping market dynamics. The market witnesses continuous innovation in drug formulation, driven by the demand for improved patient experience and efficacy. However, challenges exist due to the relatively high cost of R&D and stringent regulatory requirements. Mergers and acquisitions (M&A) activities have been instrumental in expanding market share and strengthening competitive positioning. Over the period 2019-2024, total M&A deal values in the industry reached approximately $xx Million, showing moderate consolidation activity.
- Key Metrics:
- Top 3 players market share (2024): xx%
- Total M&A deal value (2019-2024): $xx Million
- Average R&D spend per company (2024): $xx Million
Oral Thin Film Drugs Industry Industry Trends & Insights
The Oral Thin Film Drugs market is experiencing robust growth, driven by the increasing prevalence of chronic diseases, the growing demand for convenient and patient-friendly drug delivery systems, and advancements in pharmaceutical technology. The market is projected to grow at a Compound Annual Growth Rate (CAGR) of xx% during the forecast period (2025-2033). This growth is fueled by several key factors, including rising healthcare expenditure, increasing geriatric population, growing preference for improved patient adherence, and technological advancements that enhance the efficacy and convenience of oral thin film drugs. The market penetration of oral thin film drugs has increased significantly in recent years, with a notable rise in adoption across various therapeutic areas. The competitive landscape is dynamic, with established players and emerging companies vying for market share through product innovation, strategic partnerships, and geographic expansion. Technological advancements, such as improved film-forming materials and enhanced manufacturing processes, are further driving the market's expansion.
Dominant Markets & Segments in Oral Thin Film Drugs Industry
The North American market currently dominates the global oral thin film drug industry, driven by high healthcare expenditure, strong regulatory support, and the presence of key players in the region. Within disease indications, Opioid Dependence and Nausea and Vomiting segments are among the largest, reflecting a significant unmet need and growing patient population. Retail pharmacies represent the largest distribution channel due to their widespread accessibility and convenience. Sublingual films constitute the largest product segment, benefitting from their rapid absorption and ease of administration.
- Key Drivers of Segment Dominance:
- North America: High healthcare spending, robust regulatory environment, presence of major players.
- Opioid Dependence & Nausea/Vomiting: High prevalence of these conditions, significant unmet needs.
- Retail Pharmacies: Widespread accessibility, patient convenience.
- Sublingual Films: Rapid absorption, ease of administration.
Oral Thin Film Drugs Industry Product Developments
Recent years have witnessed significant advancements in oral thin film drug technology, leading to improved drug formulations with enhanced bioavailability, patient compliance, and efficacy. The focus has been on developing faster-dissolving films, improved taste-masking techniques, and customized formulations to cater to diverse patient needs. These technological advancements are increasing the adoption of oral thin film drugs across various therapeutic areas and expanding market potential.
Report Scope & Segmentation Analysis
This report segments the Oral Thin Film Drugs market by disease indication (Opioid Dependence, Nausea and Vomiting, Other Disease Indications), distribution channel (Hospital Pharmacies, Retail Pharmacies, Other Distribution Channels), and product type (Sublingual Film, Other Products). Each segment provides detailed market size estimates, growth projections, and competitive analysis for the historical period (2019-2024), base year (2025), and forecast period (2025-2033). The market is expected to witness significant growth in all segments, driven by several factors, including increasing demand, technological advancements, and regulatory approvals.
Key Drivers of Oral Thin Film Drugs Industry Growth
The Oral Thin Film Drugs market growth is driven by a confluence of factors including the increasing prevalence of chronic diseases, growing demand for convenient drug delivery systems, technological advancements leading to improved formulations, and supportive regulatory environments in key markets. The rising geriatric population also contributes significantly to market expansion, given the higher incidence of chronic conditions in this age group. Government initiatives and funding for research and development further support the industry's growth trajectory.
Challenges in the Oral Thin Film Drugs Industry Sector
The Oral Thin Film Drugs industry faces challenges, including stringent regulatory approvals and the need for substantial investment in research and development. Supply chain complexities and the potential for generic competition also pose significant hurdles to market growth. The high cost of production and limited market awareness in certain regions represent additional obstacles. These challenges necessitate a proactive approach to overcoming regulatory hurdles, improving supply chain efficiency, and building strong brand recognition to maintain sustainable market growth.
Emerging Opportunities in Oral Thin Film Drugs Industry
Emerging opportunities exist in the Oral Thin Film Drugs industry, driven by the expanding use of these drug delivery systems for new therapeutic indications and the exploration of personalized medicine approaches. Technological advances leading to improved formulations and manufacturing processes also present significant potential. Expanding market penetration in emerging economies and increasing collaborations among industry players and research institutions further offer promising prospects for the future.
Leading Players in the Oral Thin Film Drugs Industry Market
- Sunovion Pharmaceuticals Inc
- C L Pharm
- Aquestive Therapeutics Inc
- ZIM Laboratories Limited
- LTS Lohmann Therapie-Systeme AG
- Viatris
- Cure Pharmaceutical
- IntelGenx Corp
- NAL Pharma
Key Developments in Oral Thin Film Drugs Industry Industry
- October 2022: IntelGenx Corp. received a U.S. FDA Generic Drug User Fee Act ("GDUFA") for its Buprenorphine Buccal Film, a generic version of Belbuca for managing severe continuous pain.
- August 2022: Aquestive Therapeutics received FDA grant for Libervant (diazepam) Buccal Film for treating frequent seizure activity.
Strategic Outlook for Oral Thin Film Drugs Industry Market
The Oral Thin Film Drugs market is poised for continued robust growth, fueled by ongoing technological advancements, increased demand for convenient drug delivery systems, and the expansion into new therapeutic areas. The industry will likely witness further consolidation through mergers and acquisitions, as companies seek to enhance their market position and diversify their product portfolios. Focus on innovative formulations, personalized medicine approaches, and strategic partnerships will be key to success in the coming years.
Oral Thin Film Drugs Industry Segmentation
-
1. Product
- 1.1. Sublingual Film
- 1.2. Other Products
-
2. Disease Indication
- 2.1. Opioid Dependence
- 2.2. Nausea and Vomiting
- 2.3. Other Disease Indications
-
3. Distribution Channel
- 3.1. Hospital Pharmacies
- 3.2. Retail Pharmacies
- 3.3. Other Distribution Channels
Oral Thin Film Drugs Industry Segmentation By Geography
-
1. North America
- 1.1. United States
- 1.2. Canada
- 1.3. Mexico
-
2. Europe
- 2.1. Germany
- 2.2. United Kingdom
- 2.3. France
- 2.4. Italy
- 2.5. Spain
- 2.6. Rest of Europe
-
3. Asia Pacific
- 3.1. China
- 3.2. Japan
- 3.3. India
- 3.4. Australia
- 3.5. South Korea
- 3.6. Rest of Asia Pacific
-
4. Middle East and Africa
- 4.1. GCC
- 4.2. South Africa
- 4.3. Rest of Middle East and Africa
-
5. South America
- 5.1. Brazil
- 5.2. Argentina
- 5.3. Rest of South America
Oral Thin Film Drugs Industry REPORT HIGHLIGHTS
| Aspects | Details |
|---|---|
| Study Period | 2019-2033 |
| Base Year | 2024 |
| Estimated Year | 2025 |
| Forecast Period | 2025-2033 |
| Historical Period | 2019-2024 |
| Growth Rate | CAGR of 9.56% from 2019-2033 |
| Segmentation |
|
Table of Contents
- 1. Introduction
- 1.1. Research Scope
- 1.2. Market Segmentation
- 1.3. Research Methodology
- 1.4. Definitions and Assumptions
- 2. Executive Summary
- 2.1. Introduction
- 3. Market Dynamics
- 3.1. Introduction
- 3.2. Market Drivers
- 3.2.1. Growing Burden of Target Diseases; Advantages Associated with the Thin Films
- 3.3. Market Restrains
- 3.3.1. Technical Limitations of Oral Thin Films
- 3.4. Market Trends
- 3.4.1. The Sublingual Film Segment is Expected to Witness Considerable Growth Over the Forecast Period
- 4. Market Factor Analysis
- 4.1. Porters Five Forces
- 4.2. Supply/Value Chain
- 4.3. PESTEL analysis
- 4.4. Market Entropy
- 4.5. Patent/Trademark Analysis
- 5. Global Oral Thin Film Drugs Industry Analysis, Insights and Forecast, 2019-2031
- 5.1. Market Analysis, Insights and Forecast - by Product
- 5.1.1. Sublingual Film
- 5.1.2. Other Products
- 5.2. Market Analysis, Insights and Forecast - by Disease Indication
- 5.2.1. Opioid Dependence
- 5.2.2. Nausea and Vomiting
- 5.2.3. Other Disease Indications
- 5.3. Market Analysis, Insights and Forecast - by Distribution Channel
- 5.3.1. Hospital Pharmacies
- 5.3.2. Retail Pharmacies
- 5.3.3. Other Distribution Channels
- 5.4. Market Analysis, Insights and Forecast - by Region
- 5.4.1. North America
- 5.4.2. Europe
- 5.4.3. Asia Pacific
- 5.4.4. Middle East and Africa
- 5.4.5. South America
- 5.1. Market Analysis, Insights and Forecast - by Product
- 6. North America Oral Thin Film Drugs Industry Analysis, Insights and Forecast, 2019-2031
- 6.1. Market Analysis, Insights and Forecast - by Product
- 6.1.1. Sublingual Film
- 6.1.2. Other Products
- 6.2. Market Analysis, Insights and Forecast - by Disease Indication
- 6.2.1. Opioid Dependence
- 6.2.2. Nausea and Vomiting
- 6.2.3. Other Disease Indications
- 6.3. Market Analysis, Insights and Forecast - by Distribution Channel
- 6.3.1. Hospital Pharmacies
- 6.3.2. Retail Pharmacies
- 6.3.3. Other Distribution Channels
- 6.1. Market Analysis, Insights and Forecast - by Product
- 7. Europe Oral Thin Film Drugs Industry Analysis, Insights and Forecast, 2019-2031
- 7.1. Market Analysis, Insights and Forecast - by Product
- 7.1.1. Sublingual Film
- 7.1.2. Other Products
- 7.2. Market Analysis, Insights and Forecast - by Disease Indication
- 7.2.1. Opioid Dependence
- 7.2.2. Nausea and Vomiting
- 7.2.3. Other Disease Indications
- 7.3. Market Analysis, Insights and Forecast - by Distribution Channel
- 7.3.1. Hospital Pharmacies
- 7.3.2. Retail Pharmacies
- 7.3.3. Other Distribution Channels
- 7.1. Market Analysis, Insights and Forecast - by Product
- 8. Asia Pacific Oral Thin Film Drugs Industry Analysis, Insights and Forecast, 2019-2031
- 8.1. Market Analysis, Insights and Forecast - by Product
- 8.1.1. Sublingual Film
- 8.1.2. Other Products
- 8.2. Market Analysis, Insights and Forecast - by Disease Indication
- 8.2.1. Opioid Dependence
- 8.2.2. Nausea and Vomiting
- 8.2.3. Other Disease Indications
- 8.3. Market Analysis, Insights and Forecast - by Distribution Channel
- 8.3.1. Hospital Pharmacies
- 8.3.2. Retail Pharmacies
- 8.3.3. Other Distribution Channels
- 8.1. Market Analysis, Insights and Forecast - by Product
- 9. Middle East and Africa Oral Thin Film Drugs Industry Analysis, Insights and Forecast, 2019-2031
- 9.1. Market Analysis, Insights and Forecast - by Product
- 9.1.1. Sublingual Film
- 9.1.2. Other Products
- 9.2. Market Analysis, Insights and Forecast - by Disease Indication
- 9.2.1. Opioid Dependence
- 9.2.2. Nausea and Vomiting
- 9.2.3. Other Disease Indications
- 9.3. Market Analysis, Insights and Forecast - by Distribution Channel
- 9.3.1. Hospital Pharmacies
- 9.3.2. Retail Pharmacies
- 9.3.3. Other Distribution Channels
- 9.1. Market Analysis, Insights and Forecast - by Product
- 10. South America Oral Thin Film Drugs Industry Analysis, Insights and Forecast, 2019-2031
- 10.1. Market Analysis, Insights and Forecast - by Product
- 10.1.1. Sublingual Film
- 10.1.2. Other Products
- 10.2. Market Analysis, Insights and Forecast - by Disease Indication
- 10.2.1. Opioid Dependence
- 10.2.2. Nausea and Vomiting
- 10.2.3. Other Disease Indications
- 10.3. Market Analysis, Insights and Forecast - by Distribution Channel
- 10.3.1. Hospital Pharmacies
- 10.3.2. Retail Pharmacies
- 10.3.3. Other Distribution Channels
- 10.1. Market Analysis, Insights and Forecast - by Product
- 11. North America Oral Thin Film Drugs Industry Analysis, Insights and Forecast, 2019-2031
- 11.1. Market Analysis, Insights and Forecast - By Country/Sub-region
- 11.1.1 United States
- 11.1.2 Canada
- 11.1.3 Mexico
- 12. Europe Oral Thin Film Drugs Industry Analysis, Insights and Forecast, 2019-2031
- 12.1. Market Analysis, Insights and Forecast - By Country/Sub-region
- 12.1.1 Germany
- 12.1.2 United Kingdom
- 12.1.3 France
- 12.1.4 Italy
- 12.1.5 Spain
- 12.1.6 Rest of Europe
- 13. Asia Pacific Oral Thin Film Drugs Industry Analysis, Insights and Forecast, 2019-2031
- 13.1. Market Analysis, Insights and Forecast - By Country/Sub-region
- 13.1.1 China
- 13.1.2 Japan
- 13.1.3 India
- 13.1.4 Australia
- 13.1.5 South Korea
- 13.1.6 Rest of Asia Pacific
- 14. Middle East Oral Thin Film Drugs Industry Analysis, Insights and Forecast, 2019-2031
- 14.1. Market Analysis, Insights and Forecast - By Country/Sub-region
- 14.1.1.
- 15. GCC Oral Thin Film Drugs Industry Analysis, Insights and Forecast, 2019-2031
- 15.1. Market Analysis, Insights and Forecast - By Country/Sub-region
- 15.1.1 South Africa
- 15.1.2 Rest of Middle East
- 16. South America Oral Thin Film Drugs Industry Analysis, Insights and Forecast, 2019-2031
- 16.1. Market Analysis, Insights and Forecast - By Country/Sub-region
- 16.1.1 Brazil
- 16.1.2 Argentina
- 16.1.3 Rest of South America
- 17. Competitive Analysis
- 17.1. Global Market Share Analysis 2024
- 17.2. Company Profiles
- 17.2.1 Sunovion Pharmaceuticals Inc
- 17.2.1.1. Overview
- 17.2.1.2. Products
- 17.2.1.3. SWOT Analysis
- 17.2.1.4. Recent Developments
- 17.2.1.5. Financials (Based on Availability)
- 17.2.2 C L Pharm
- 17.2.2.1. Overview
- 17.2.2.2. Products
- 17.2.2.3. SWOT Analysis
- 17.2.2.4. Recent Developments
- 17.2.2.5. Financials (Based on Availability)
- 17.2.3 Aquestive Therapeutics Inc
- 17.2.3.1. Overview
- 17.2.3.2. Products
- 17.2.3.3. SWOT Analysis
- 17.2.3.4. Recent Developments
- 17.2.3.5. Financials (Based on Availability)
- 17.2.4 ZIM Laboratories Limited
- 17.2.4.1. Overview
- 17.2.4.2. Products
- 17.2.4.3. SWOT Analysis
- 17.2.4.4. Recent Developments
- 17.2.4.5. Financials (Based on Availability)
- 17.2.5 LTS Lohmann Therapie-Systeme AG
- 17.2.5.1. Overview
- 17.2.5.2. Products
- 17.2.5.3. SWOT Analysis
- 17.2.5.4. Recent Developments
- 17.2.5.5. Financials (Based on Availability)
- 17.2.6 Viatris
- 17.2.6.1. Overview
- 17.2.6.2. Products
- 17.2.6.3. SWOT Analysis
- 17.2.6.4. Recent Developments
- 17.2.6.5. Financials (Based on Availability)
- 17.2.7 Cure Pharmaceutical
- 17.2.7.1. Overview
- 17.2.7.2. Products
- 17.2.7.3. SWOT Analysis
- 17.2.7.4. Recent Developments
- 17.2.7.5. Financials (Based on Availability)
- 17.2.8 IntelGenx Corp
- 17.2.8.1. Overview
- 17.2.8.2. Products
- 17.2.8.3. SWOT Analysis
- 17.2.8.4. Recent Developments
- 17.2.8.5. Financials (Based on Availability)
- 17.2.9 NAL Pharma
- 17.2.9.1. Overview
- 17.2.9.2. Products
- 17.2.9.3. SWOT Analysis
- 17.2.9.4. Recent Developments
- 17.2.9.5. Financials (Based on Availability)
- 17.2.1 Sunovion Pharmaceuticals Inc
List of Figures
- Figure 1: Global Oral Thin Film Drugs Industry Revenue Breakdown (Million, %) by Region 2024 & 2032
- Figure 2: Global Oral Thin Film Drugs Industry Volume Breakdown (K Unit, %) by Region 2024 & 2032
- Figure 3: North America Oral Thin Film Drugs Industry Revenue (Million), by Country 2024 & 2032
- Figure 4: North America Oral Thin Film Drugs Industry Volume (K Unit), by Country 2024 & 2032
- Figure 5: North America Oral Thin Film Drugs Industry Revenue Share (%), by Country 2024 & 2032
- Figure 6: North America Oral Thin Film Drugs Industry Volume Share (%), by Country 2024 & 2032
- Figure 7: Europe Oral Thin Film Drugs Industry Revenue (Million), by Country 2024 & 2032
- Figure 8: Europe Oral Thin Film Drugs Industry Volume (K Unit), by Country 2024 & 2032
- Figure 9: Europe Oral Thin Film Drugs Industry Revenue Share (%), by Country 2024 & 2032
- Figure 10: Europe Oral Thin Film Drugs Industry Volume Share (%), by Country 2024 & 2032
- Figure 11: Asia Pacific Oral Thin Film Drugs Industry Revenue (Million), by Country 2024 & 2032
- Figure 12: Asia Pacific Oral Thin Film Drugs Industry Volume (K Unit), by Country 2024 & 2032
- Figure 13: Asia Pacific Oral Thin Film Drugs Industry Revenue Share (%), by Country 2024 & 2032
- Figure 14: Asia Pacific Oral Thin Film Drugs Industry Volume Share (%), by Country 2024 & 2032
- Figure 15: Middle East Oral Thin Film Drugs Industry Revenue (Million), by Country 2024 & 2032
- Figure 16: Middle East Oral Thin Film Drugs Industry Volume (K Unit), by Country 2024 & 2032
- Figure 17: Middle East Oral Thin Film Drugs Industry Revenue Share (%), by Country 2024 & 2032
- Figure 18: Middle East Oral Thin Film Drugs Industry Volume Share (%), by Country 2024 & 2032
- Figure 19: GCC Oral Thin Film Drugs Industry Revenue (Million), by Country 2024 & 2032
- Figure 20: GCC Oral Thin Film Drugs Industry Volume (K Unit), by Country 2024 & 2032
- Figure 21: GCC Oral Thin Film Drugs Industry Revenue Share (%), by Country 2024 & 2032
- Figure 22: GCC Oral Thin Film Drugs Industry Volume Share (%), by Country 2024 & 2032
- Figure 23: South America Oral Thin Film Drugs Industry Revenue (Million), by Country 2024 & 2032
- Figure 24: South America Oral Thin Film Drugs Industry Volume (K Unit), by Country 2024 & 2032
- Figure 25: South America Oral Thin Film Drugs Industry Revenue Share (%), by Country 2024 & 2032
- Figure 26: South America Oral Thin Film Drugs Industry Volume Share (%), by Country 2024 & 2032
- Figure 27: North America Oral Thin Film Drugs Industry Revenue (Million), by Product 2024 & 2032
- Figure 28: North America Oral Thin Film Drugs Industry Volume (K Unit), by Product 2024 & 2032
- Figure 29: North America Oral Thin Film Drugs Industry Revenue Share (%), by Product 2024 & 2032
- Figure 30: North America Oral Thin Film Drugs Industry Volume Share (%), by Product 2024 & 2032
- Figure 31: North America Oral Thin Film Drugs Industry Revenue (Million), by Disease Indication 2024 & 2032
- Figure 32: North America Oral Thin Film Drugs Industry Volume (K Unit), by Disease Indication 2024 & 2032
- Figure 33: North America Oral Thin Film Drugs Industry Revenue Share (%), by Disease Indication 2024 & 2032
- Figure 34: North America Oral Thin Film Drugs Industry Volume Share (%), by Disease Indication 2024 & 2032
- Figure 35: North America Oral Thin Film Drugs Industry Revenue (Million), by Distribution Channel 2024 & 2032
- Figure 36: North America Oral Thin Film Drugs Industry Volume (K Unit), by Distribution Channel 2024 & 2032
- Figure 37: North America Oral Thin Film Drugs Industry Revenue Share (%), by Distribution Channel 2024 & 2032
- Figure 38: North America Oral Thin Film Drugs Industry Volume Share (%), by Distribution Channel 2024 & 2032
- Figure 39: North America Oral Thin Film Drugs Industry Revenue (Million), by Country 2024 & 2032
- Figure 40: North America Oral Thin Film Drugs Industry Volume (K Unit), by Country 2024 & 2032
- Figure 41: North America Oral Thin Film Drugs Industry Revenue Share (%), by Country 2024 & 2032
- Figure 42: North America Oral Thin Film Drugs Industry Volume Share (%), by Country 2024 & 2032
- Figure 43: Europe Oral Thin Film Drugs Industry Revenue (Million), by Product 2024 & 2032
- Figure 44: Europe Oral Thin Film Drugs Industry Volume (K Unit), by Product 2024 & 2032
- Figure 45: Europe Oral Thin Film Drugs Industry Revenue Share (%), by Product 2024 & 2032
- Figure 46: Europe Oral Thin Film Drugs Industry Volume Share (%), by Product 2024 & 2032
- Figure 47: Europe Oral Thin Film Drugs Industry Revenue (Million), by Disease Indication 2024 & 2032
- Figure 48: Europe Oral Thin Film Drugs Industry Volume (K Unit), by Disease Indication 2024 & 2032
- Figure 49: Europe Oral Thin Film Drugs Industry Revenue Share (%), by Disease Indication 2024 & 2032
- Figure 50: Europe Oral Thin Film Drugs Industry Volume Share (%), by Disease Indication 2024 & 2032
- Figure 51: Europe Oral Thin Film Drugs Industry Revenue (Million), by Distribution Channel 2024 & 2032
- Figure 52: Europe Oral Thin Film Drugs Industry Volume (K Unit), by Distribution Channel 2024 & 2032
- Figure 53: Europe Oral Thin Film Drugs Industry Revenue Share (%), by Distribution Channel 2024 & 2032
- Figure 54: Europe Oral Thin Film Drugs Industry Volume Share (%), by Distribution Channel 2024 & 2032
- Figure 55: Europe Oral Thin Film Drugs Industry Revenue (Million), by Country 2024 & 2032
- Figure 56: Europe Oral Thin Film Drugs Industry Volume (K Unit), by Country 2024 & 2032
- Figure 57: Europe Oral Thin Film Drugs Industry Revenue Share (%), by Country 2024 & 2032
- Figure 58: Europe Oral Thin Film Drugs Industry Volume Share (%), by Country 2024 & 2032
- Figure 59: Asia Pacific Oral Thin Film Drugs Industry Revenue (Million), by Product 2024 & 2032
- Figure 60: Asia Pacific Oral Thin Film Drugs Industry Volume (K Unit), by Product 2024 & 2032
- Figure 61: Asia Pacific Oral Thin Film Drugs Industry Revenue Share (%), by Product 2024 & 2032
- Figure 62: Asia Pacific Oral Thin Film Drugs Industry Volume Share (%), by Product 2024 & 2032
- Figure 63: Asia Pacific Oral Thin Film Drugs Industry Revenue (Million), by Disease Indication 2024 & 2032
- Figure 64: Asia Pacific Oral Thin Film Drugs Industry Volume (K Unit), by Disease Indication 2024 & 2032
- Figure 65: Asia Pacific Oral Thin Film Drugs Industry Revenue Share (%), by Disease Indication 2024 & 2032
- Figure 66: Asia Pacific Oral Thin Film Drugs Industry Volume Share (%), by Disease Indication 2024 & 2032
- Figure 67: Asia Pacific Oral Thin Film Drugs Industry Revenue (Million), by Distribution Channel 2024 & 2032
- Figure 68: Asia Pacific Oral Thin Film Drugs Industry Volume (K Unit), by Distribution Channel 2024 & 2032
- Figure 69: Asia Pacific Oral Thin Film Drugs Industry Revenue Share (%), by Distribution Channel 2024 & 2032
- Figure 70: Asia Pacific Oral Thin Film Drugs Industry Volume Share (%), by Distribution Channel 2024 & 2032
- Figure 71: Asia Pacific Oral Thin Film Drugs Industry Revenue (Million), by Country 2024 & 2032
- Figure 72: Asia Pacific Oral Thin Film Drugs Industry Volume (K Unit), by Country 2024 & 2032
- Figure 73: Asia Pacific Oral Thin Film Drugs Industry Revenue Share (%), by Country 2024 & 2032
- Figure 74: Asia Pacific Oral Thin Film Drugs Industry Volume Share (%), by Country 2024 & 2032
- Figure 75: Middle East and Africa Oral Thin Film Drugs Industry Revenue (Million), by Product 2024 & 2032
- Figure 76: Middle East and Africa Oral Thin Film Drugs Industry Volume (K Unit), by Product 2024 & 2032
- Figure 77: Middle East and Africa Oral Thin Film Drugs Industry Revenue Share (%), by Product 2024 & 2032
- Figure 78: Middle East and Africa Oral Thin Film Drugs Industry Volume Share (%), by Product 2024 & 2032
- Figure 79: Middle East and Africa Oral Thin Film Drugs Industry Revenue (Million), by Disease Indication 2024 & 2032
- Figure 80: Middle East and Africa Oral Thin Film Drugs Industry Volume (K Unit), by Disease Indication 2024 & 2032
- Figure 81: Middle East and Africa Oral Thin Film Drugs Industry Revenue Share (%), by Disease Indication 2024 & 2032
- Figure 82: Middle East and Africa Oral Thin Film Drugs Industry Volume Share (%), by Disease Indication 2024 & 2032
- Figure 83: Middle East and Africa Oral Thin Film Drugs Industry Revenue (Million), by Distribution Channel 2024 & 2032
- Figure 84: Middle East and Africa Oral Thin Film Drugs Industry Volume (K Unit), by Distribution Channel 2024 & 2032
- Figure 85: Middle East and Africa Oral Thin Film Drugs Industry Revenue Share (%), by Distribution Channel 2024 & 2032
- Figure 86: Middle East and Africa Oral Thin Film Drugs Industry Volume Share (%), by Distribution Channel 2024 & 2032
- Figure 87: Middle East and Africa Oral Thin Film Drugs Industry Revenue (Million), by Country 2024 & 2032
- Figure 88: Middle East and Africa Oral Thin Film Drugs Industry Volume (K Unit), by Country 2024 & 2032
- Figure 89: Middle East and Africa Oral Thin Film Drugs Industry Revenue Share (%), by Country 2024 & 2032
- Figure 90: Middle East and Africa Oral Thin Film Drugs Industry Volume Share (%), by Country 2024 & 2032
- Figure 91: South America Oral Thin Film Drugs Industry Revenue (Million), by Product 2024 & 2032
- Figure 92: South America Oral Thin Film Drugs Industry Volume (K Unit), by Product 2024 & 2032
- Figure 93: South America Oral Thin Film Drugs Industry Revenue Share (%), by Product 2024 & 2032
- Figure 94: South America Oral Thin Film Drugs Industry Volume Share (%), by Product 2024 & 2032
- Figure 95: South America Oral Thin Film Drugs Industry Revenue (Million), by Disease Indication 2024 & 2032
- Figure 96: South America Oral Thin Film Drugs Industry Volume (K Unit), by Disease Indication 2024 & 2032
- Figure 97: South America Oral Thin Film Drugs Industry Revenue Share (%), by Disease Indication 2024 & 2032
- Figure 98: South America Oral Thin Film Drugs Industry Volume Share (%), by Disease Indication 2024 & 2032
- Figure 99: South America Oral Thin Film Drugs Industry Revenue (Million), by Distribution Channel 2024 & 2032
- Figure 100: South America Oral Thin Film Drugs Industry Volume (K Unit), by Distribution Channel 2024 & 2032
- Figure 101: South America Oral Thin Film Drugs Industry Revenue Share (%), by Distribution Channel 2024 & 2032
- Figure 102: South America Oral Thin Film Drugs Industry Volume Share (%), by Distribution Channel 2024 & 2032
- Figure 103: South America Oral Thin Film Drugs Industry Revenue (Million), by Country 2024 & 2032
- Figure 104: South America Oral Thin Film Drugs Industry Volume (K Unit), by Country 2024 & 2032
- Figure 105: South America Oral Thin Film Drugs Industry Revenue Share (%), by Country 2024 & 2032
- Figure 106: South America Oral Thin Film Drugs Industry Volume Share (%), by Country 2024 & 2032
List of Tables
- Table 1: Global Oral Thin Film Drugs Industry Revenue Million Forecast, by Region 2019 & 2032
- Table 2: Global Oral Thin Film Drugs Industry Volume K Unit Forecast, by Region 2019 & 2032
- Table 3: Global Oral Thin Film Drugs Industry Revenue Million Forecast, by Product 2019 & 2032
- Table 4: Global Oral Thin Film Drugs Industry Volume K Unit Forecast, by Product 2019 & 2032
- Table 5: Global Oral Thin Film Drugs Industry Revenue Million Forecast, by Disease Indication 2019 & 2032
- Table 6: Global Oral Thin Film Drugs Industry Volume K Unit Forecast, by Disease Indication 2019 & 2032
- Table 7: Global Oral Thin Film Drugs Industry Revenue Million Forecast, by Distribution Channel 2019 & 2032
- Table 8: Global Oral Thin Film Drugs Industry Volume K Unit Forecast, by Distribution Channel 2019 & 2032
- Table 9: Global Oral Thin Film Drugs Industry Revenue Million Forecast, by Region 2019 & 2032
- Table 10: Global Oral Thin Film Drugs Industry Volume K Unit Forecast, by Region 2019 & 2032
- Table 11: Global Oral Thin Film Drugs Industry Revenue Million Forecast, by Country 2019 & 2032
- Table 12: Global Oral Thin Film Drugs Industry Volume K Unit Forecast, by Country 2019 & 2032
- Table 13: United States Oral Thin Film Drugs Industry Revenue (Million) Forecast, by Application 2019 & 2032
- Table 14: United States Oral Thin Film Drugs Industry Volume (K Unit) Forecast, by Application 2019 & 2032
- Table 15: Canada Oral Thin Film Drugs Industry Revenue (Million) Forecast, by Application 2019 & 2032
- Table 16: Canada Oral Thin Film Drugs Industry Volume (K Unit) Forecast, by Application 2019 & 2032
- Table 17: Mexico Oral Thin Film Drugs Industry Revenue (Million) Forecast, by Application 2019 & 2032
- Table 18: Mexico Oral Thin Film Drugs Industry Volume (K Unit) Forecast, by Application 2019 & 2032
- Table 19: Global Oral Thin Film Drugs Industry Revenue Million Forecast, by Country 2019 & 2032
- Table 20: Global Oral Thin Film Drugs Industry Volume K Unit Forecast, by Country 2019 & 2032
- Table 21: Germany Oral Thin Film Drugs Industry Revenue (Million) Forecast, by Application 2019 & 2032
- Table 22: Germany Oral Thin Film Drugs Industry Volume (K Unit) Forecast, by Application 2019 & 2032
- Table 23: United Kingdom Oral Thin Film Drugs Industry Revenue (Million) Forecast, by Application 2019 & 2032
- Table 24: United Kingdom Oral Thin Film Drugs Industry Volume (K Unit) Forecast, by Application 2019 & 2032
- Table 25: France Oral Thin Film Drugs Industry Revenue (Million) Forecast, by Application 2019 & 2032
- Table 26: France Oral Thin Film Drugs Industry Volume (K Unit) Forecast, by Application 2019 & 2032
- Table 27: Italy Oral Thin Film Drugs Industry Revenue (Million) Forecast, by Application 2019 & 2032
- Table 28: Italy Oral Thin Film Drugs Industry Volume (K Unit) Forecast, by Application 2019 & 2032
- Table 29: Spain Oral Thin Film Drugs Industry Revenue (Million) Forecast, by Application 2019 & 2032
- Table 30: Spain Oral Thin Film Drugs Industry Volume (K Unit) Forecast, by Application 2019 & 2032
- Table 31: Rest of Europe Oral Thin Film Drugs Industry Revenue (Million) Forecast, by Application 2019 & 2032
- Table 32: Rest of Europe Oral Thin Film Drugs Industry Volume (K Unit) Forecast, by Application 2019 & 2032
- Table 33: Global Oral Thin Film Drugs Industry Revenue Million Forecast, by Country 2019 & 2032
- Table 34: Global Oral Thin Film Drugs Industry Volume K Unit Forecast, by Country 2019 & 2032
- Table 35: China Oral Thin Film Drugs Industry Revenue (Million) Forecast, by Application 2019 & 2032
- Table 36: China Oral Thin Film Drugs Industry Volume (K Unit) Forecast, by Application 2019 & 2032
- Table 37: Japan Oral Thin Film Drugs Industry Revenue (Million) Forecast, by Application 2019 & 2032
- Table 38: Japan Oral Thin Film Drugs Industry Volume (K Unit) Forecast, by Application 2019 & 2032
- Table 39: India Oral Thin Film Drugs Industry Revenue (Million) Forecast, by Application 2019 & 2032
- Table 40: India Oral Thin Film Drugs Industry Volume (K Unit) Forecast, by Application 2019 & 2032
- Table 41: Australia Oral Thin Film Drugs Industry Revenue (Million) Forecast, by Application 2019 & 2032
- Table 42: Australia Oral Thin Film Drugs Industry Volume (K Unit) Forecast, by Application 2019 & 2032
- Table 43: South Korea Oral Thin Film Drugs Industry Revenue (Million) Forecast, by Application 2019 & 2032
- Table 44: South Korea Oral Thin Film Drugs Industry Volume (K Unit) Forecast, by Application 2019 & 2032
- Table 45: Rest of Asia Pacific Oral Thin Film Drugs Industry Revenue (Million) Forecast, by Application 2019 & 2032
- Table 46: Rest of Asia Pacific Oral Thin Film Drugs Industry Volume (K Unit) Forecast, by Application 2019 & 2032
- Table 47: Global Oral Thin Film Drugs Industry Revenue Million Forecast, by Country 2019 & 2032
- Table 48: Global Oral Thin Film Drugs Industry Volume K Unit Forecast, by Country 2019 & 2032
- Table 49: Oral Thin Film Drugs Industry Revenue (Million) Forecast, by Application 2019 & 2032
- Table 50: Oral Thin Film Drugs Industry Volume (K Unit) Forecast, by Application 2019 & 2032
- Table 51: Global Oral Thin Film Drugs Industry Revenue Million Forecast, by Country 2019 & 2032
- Table 52: Global Oral Thin Film Drugs Industry Volume K Unit Forecast, by Country 2019 & 2032
- Table 53: South Africa Oral Thin Film Drugs Industry Revenue (Million) Forecast, by Application 2019 & 2032
- Table 54: South Africa Oral Thin Film Drugs Industry Volume (K Unit) Forecast, by Application 2019 & 2032
- Table 55: Rest of Middle East Oral Thin Film Drugs Industry Revenue (Million) Forecast, by Application 2019 & 2032
- Table 56: Rest of Middle East Oral Thin Film Drugs Industry Volume (K Unit) Forecast, by Application 2019 & 2032
- Table 57: Global Oral Thin Film Drugs Industry Revenue Million Forecast, by Country 2019 & 2032
- Table 58: Global Oral Thin Film Drugs Industry Volume K Unit Forecast, by Country 2019 & 2032
- Table 59: Brazil Oral Thin Film Drugs Industry Revenue (Million) Forecast, by Application 2019 & 2032
- Table 60: Brazil Oral Thin Film Drugs Industry Volume (K Unit) Forecast, by Application 2019 & 2032
- Table 61: Argentina Oral Thin Film Drugs Industry Revenue (Million) Forecast, by Application 2019 & 2032
- Table 62: Argentina Oral Thin Film Drugs Industry Volume (K Unit) Forecast, by Application 2019 & 2032
- Table 63: Rest of South America Oral Thin Film Drugs Industry Revenue (Million) Forecast, by Application 2019 & 2032
- Table 64: Rest of South America Oral Thin Film Drugs Industry Volume (K Unit) Forecast, by Application 2019 & 2032
- Table 65: Global Oral Thin Film Drugs Industry Revenue Million Forecast, by Product 2019 & 2032
- Table 66: Global Oral Thin Film Drugs Industry Volume K Unit Forecast, by Product 2019 & 2032
- Table 67: Global Oral Thin Film Drugs Industry Revenue Million Forecast, by Disease Indication 2019 & 2032
- Table 68: Global Oral Thin Film Drugs Industry Volume K Unit Forecast, by Disease Indication 2019 & 2032
- Table 69: Global Oral Thin Film Drugs Industry Revenue Million Forecast, by Distribution Channel 2019 & 2032
- Table 70: Global Oral Thin Film Drugs Industry Volume K Unit Forecast, by Distribution Channel 2019 & 2032
- Table 71: Global Oral Thin Film Drugs Industry Revenue Million Forecast, by Country 2019 & 2032
- Table 72: Global Oral Thin Film Drugs Industry Volume K Unit Forecast, by Country 2019 & 2032
- Table 73: United States Oral Thin Film Drugs Industry Revenue (Million) Forecast, by Application 2019 & 2032
- Table 74: United States Oral Thin Film Drugs Industry Volume (K Unit) Forecast, by Application 2019 & 2032
- Table 75: Canada Oral Thin Film Drugs Industry Revenue (Million) Forecast, by Application 2019 & 2032
- Table 76: Canada Oral Thin Film Drugs Industry Volume (K Unit) Forecast, by Application 2019 & 2032
- Table 77: Mexico Oral Thin Film Drugs Industry Revenue (Million) Forecast, by Application 2019 & 2032
- Table 78: Mexico Oral Thin Film Drugs Industry Volume (K Unit) Forecast, by Application 2019 & 2032
- Table 79: Global Oral Thin Film Drugs Industry Revenue Million Forecast, by Product 2019 & 2032
- Table 80: Global Oral Thin Film Drugs Industry Volume K Unit Forecast, by Product 2019 & 2032
- Table 81: Global Oral Thin Film Drugs Industry Revenue Million Forecast, by Disease Indication 2019 & 2032
- Table 82: Global Oral Thin Film Drugs Industry Volume K Unit Forecast, by Disease Indication 2019 & 2032
- Table 83: Global Oral Thin Film Drugs Industry Revenue Million Forecast, by Distribution Channel 2019 & 2032
- Table 84: Global Oral Thin Film Drugs Industry Volume K Unit Forecast, by Distribution Channel 2019 & 2032
- Table 85: Global Oral Thin Film Drugs Industry Revenue Million Forecast, by Country 2019 & 2032
- Table 86: Global Oral Thin Film Drugs Industry Volume K Unit Forecast, by Country 2019 & 2032
- Table 87: Germany Oral Thin Film Drugs Industry Revenue (Million) Forecast, by Application 2019 & 2032
- Table 88: Germany Oral Thin Film Drugs Industry Volume (K Unit) Forecast, by Application 2019 & 2032
- Table 89: United Kingdom Oral Thin Film Drugs Industry Revenue (Million) Forecast, by Application 2019 & 2032
- Table 90: United Kingdom Oral Thin Film Drugs Industry Volume (K Unit) Forecast, by Application 2019 & 2032
- Table 91: France Oral Thin Film Drugs Industry Revenue (Million) Forecast, by Application 2019 & 2032
- Table 92: France Oral Thin Film Drugs Industry Volume (K Unit) Forecast, by Application 2019 & 2032
- Table 93: Italy Oral Thin Film Drugs Industry Revenue (Million) Forecast, by Application 2019 & 2032
- Table 94: Italy Oral Thin Film Drugs Industry Volume (K Unit) Forecast, by Application 2019 & 2032
- Table 95: Spain Oral Thin Film Drugs Industry Revenue (Million) Forecast, by Application 2019 & 2032
- Table 96: Spain Oral Thin Film Drugs Industry Volume (K Unit) Forecast, by Application 2019 & 2032
- Table 97: Rest of Europe Oral Thin Film Drugs Industry Revenue (Million) Forecast, by Application 2019 & 2032
- Table 98: Rest of Europe Oral Thin Film Drugs Industry Volume (K Unit) Forecast, by Application 2019 & 2032
- Table 99: Global Oral Thin Film Drugs Industry Revenue Million Forecast, by Product 2019 & 2032
- Table 100: Global Oral Thin Film Drugs Industry Volume K Unit Forecast, by Product 2019 & 2032
- Table 101: Global Oral Thin Film Drugs Industry Revenue Million Forecast, by Disease Indication 2019 & 2032
- Table 102: Global Oral Thin Film Drugs Industry Volume K Unit Forecast, by Disease Indication 2019 & 2032
- Table 103: Global Oral Thin Film Drugs Industry Revenue Million Forecast, by Distribution Channel 2019 & 2032
- Table 104: Global Oral Thin Film Drugs Industry Volume K Unit Forecast, by Distribution Channel 2019 & 2032
- Table 105: Global Oral Thin Film Drugs Industry Revenue Million Forecast, by Country 2019 & 2032
- Table 106: Global Oral Thin Film Drugs Industry Volume K Unit Forecast, by Country 2019 & 2032
- Table 107: China Oral Thin Film Drugs Industry Revenue (Million) Forecast, by Application 2019 & 2032
- Table 108: China Oral Thin Film Drugs Industry Volume (K Unit) Forecast, by Application 2019 & 2032
- Table 109: Japan Oral Thin Film Drugs Industry Revenue (Million) Forecast, by Application 2019 & 2032
- Table 110: Japan Oral Thin Film Drugs Industry Volume (K Unit) Forecast, by Application 2019 & 2032
- Table 111: India Oral Thin Film Drugs Industry Revenue (Million) Forecast, by Application 2019 & 2032
- Table 112: India Oral Thin Film Drugs Industry Volume (K Unit) Forecast, by Application 2019 & 2032
- Table 113: Australia Oral Thin Film Drugs Industry Revenue (Million) Forecast, by Application 2019 & 2032
- Table 114: Australia Oral Thin Film Drugs Industry Volume (K Unit) Forecast, by Application 2019 & 2032
- Table 115: South Korea Oral Thin Film Drugs Industry Revenue (Million) Forecast, by Application 2019 & 2032
- Table 116: South Korea Oral Thin Film Drugs Industry Volume (K Unit) Forecast, by Application 2019 & 2032
- Table 117: Rest of Asia Pacific Oral Thin Film Drugs Industry Revenue (Million) Forecast, by Application 2019 & 2032
- Table 118: Rest of Asia Pacific Oral Thin Film Drugs Industry Volume (K Unit) Forecast, by Application 2019 & 2032
- Table 119: Global Oral Thin Film Drugs Industry Revenue Million Forecast, by Product 2019 & 2032
- Table 120: Global Oral Thin Film Drugs Industry Volume K Unit Forecast, by Product 2019 & 2032
- Table 121: Global Oral Thin Film Drugs Industry Revenue Million Forecast, by Disease Indication 2019 & 2032
- Table 122: Global Oral Thin Film Drugs Industry Volume K Unit Forecast, by Disease Indication 2019 & 2032
- Table 123: Global Oral Thin Film Drugs Industry Revenue Million Forecast, by Distribution Channel 2019 & 2032
- Table 124: Global Oral Thin Film Drugs Industry Volume K Unit Forecast, by Distribution Channel 2019 & 2032
- Table 125: Global Oral Thin Film Drugs Industry Revenue Million Forecast, by Country 2019 & 2032
- Table 126: Global Oral Thin Film Drugs Industry Volume K Unit Forecast, by Country 2019 & 2032
- Table 127: GCC Oral Thin Film Drugs Industry Revenue (Million) Forecast, by Application 2019 & 2032
- Table 128: GCC Oral Thin Film Drugs Industry Volume (K Unit) Forecast, by Application 2019 & 2032
- Table 129: South Africa Oral Thin Film Drugs Industry Revenue (Million) Forecast, by Application 2019 & 2032
- Table 130: South Africa Oral Thin Film Drugs Industry Volume (K Unit) Forecast, by Application 2019 & 2032
- Table 131: Rest of Middle East and Africa Oral Thin Film Drugs Industry Revenue (Million) Forecast, by Application 2019 & 2032
- Table 132: Rest of Middle East and Africa Oral Thin Film Drugs Industry Volume (K Unit) Forecast, by Application 2019 & 2032
- Table 133: Global Oral Thin Film Drugs Industry Revenue Million Forecast, by Product 2019 & 2032
- Table 134: Global Oral Thin Film Drugs Industry Volume K Unit Forecast, by Product 2019 & 2032
- Table 135: Global Oral Thin Film Drugs Industry Revenue Million Forecast, by Disease Indication 2019 & 2032
- Table 136: Global Oral Thin Film Drugs Industry Volume K Unit Forecast, by Disease Indication 2019 & 2032
- Table 137: Global Oral Thin Film Drugs Industry Revenue Million Forecast, by Distribution Channel 2019 & 2032
- Table 138: Global Oral Thin Film Drugs Industry Volume K Unit Forecast, by Distribution Channel 2019 & 2032
- Table 139: Global Oral Thin Film Drugs Industry Revenue Million Forecast, by Country 2019 & 2032
- Table 140: Global Oral Thin Film Drugs Industry Volume K Unit Forecast, by Country 2019 & 2032
- Table 141: Brazil Oral Thin Film Drugs Industry Revenue (Million) Forecast, by Application 2019 & 2032
- Table 142: Brazil Oral Thin Film Drugs Industry Volume (K Unit) Forecast, by Application 2019 & 2032
- Table 143: Argentina Oral Thin Film Drugs Industry Revenue (Million) Forecast, by Application 2019 & 2032
- Table 144: Argentina Oral Thin Film Drugs Industry Volume (K Unit) Forecast, by Application 2019 & 2032
- Table 145: Rest of South America Oral Thin Film Drugs Industry Revenue (Million) Forecast, by Application 2019 & 2032
- Table 146: Rest of South America Oral Thin Film Drugs Industry Volume (K Unit) Forecast, by Application 2019 & 2032
Frequently Asked Questions
1. What is the projected Compound Annual Growth Rate (CAGR) of the Oral Thin Film Drugs Industry?
The projected CAGR is approximately 9.56%.
2. Which companies are prominent players in the Oral Thin Film Drugs Industry?
Key companies in the market include Sunovion Pharmaceuticals Inc, C L Pharm, Aquestive Therapeutics Inc, ZIM Laboratories Limited, LTS Lohmann Therapie-Systeme AG, Viatris, Cure Pharmaceutical, IntelGenx Corp, NAL Pharma.
3. What are the main segments of the Oral Thin Film Drugs Industry?
The market segments include Product, Disease Indication, Distribution Channel.
4. Can you provide details about the market size?
The market size is estimated to be USD 3.01 Million as of 2022.
5. What are some drivers contributing to market growth?
Growing Burden of Target Diseases; Advantages Associated with the Thin Films.
6. What are the notable trends driving market growth?
The Sublingual Film Segment is Expected to Witness Considerable Growth Over the Forecast Period.
7. Are there any restraints impacting market growth?
Technical Limitations of Oral Thin Films.
8. Can you provide examples of recent developments in the market?
In October 2022, IntelGenxCorp. announced that it had received a U.S. FDA Generic Drug User Fee Act ("GDUFA") for its Buprenorphine Buccal Film. Buprenorphine Buccal Film is a generic version of Belbuca, an opioid used to manage severe continuous pain and can be used for long-term treatment.
9. What pricing options are available for accessing the report?
Pricing options include single-user, multi-user, and enterprise licenses priced at USD 4750, USD 5250, and USD 8750 respectively.
10. Is the market size provided in terms of value or volume?
The market size is provided in terms of value, measured in Million and volume, measured in K Unit.
11. Are there any specific market keywords associated with the report?
Yes, the market keyword associated with the report is "Oral Thin Film Drugs Industry," which aids in identifying and referencing the specific market segment covered.
12. How do I determine which pricing option suits my needs best?
The pricing options vary based on user requirements and access needs. Individual users may opt for single-user licenses, while businesses requiring broader access may choose multi-user or enterprise licenses for cost-effective access to the report.
13. Are there any additional resources or data provided in the Oral Thin Film Drugs Industry report?
While the report offers comprehensive insights, it's advisable to review the specific contents or supplementary materials provided to ascertain if additional resources or data are available.
14. How can I stay updated on further developments or reports in the Oral Thin Film Drugs Industry?
To stay informed about further developments, trends, and reports in the Oral Thin Film Drugs Industry, consider subscribing to industry newsletters, following relevant companies and organizations, or regularly checking reputable industry news sources and publications.
Methodology
Step 1 - Identification of Relevant Samples Size from Population Database


Step 2 - Approaches for Defining Global Market Size (Value, Volume* & Price*)

Note*: In applicable scenarios
Step 3 - Data Sources
Primary Research
- Web Analytics
- Survey Reports
- Research Institute
- Latest Research Reports
- Opinion Leaders
Secondary Research
- Annual Reports
- White Paper
- Latest Press Release
- Industry Association
- Paid Database
- Investor Presentations

Step 4 - Data Triangulation
Involves using different sources of information in order to increase the validity of a study
These sources are likely to be stakeholders in a program - participants, other researchers, program staff, other community members, and so on.
Then we put all data in single framework & apply various statistical tools to find out the dynamic on the market.
During the analysis stage, feedback from the stakeholder groups would be compared to determine areas of agreement as well as areas of divergence


