
Key Insights
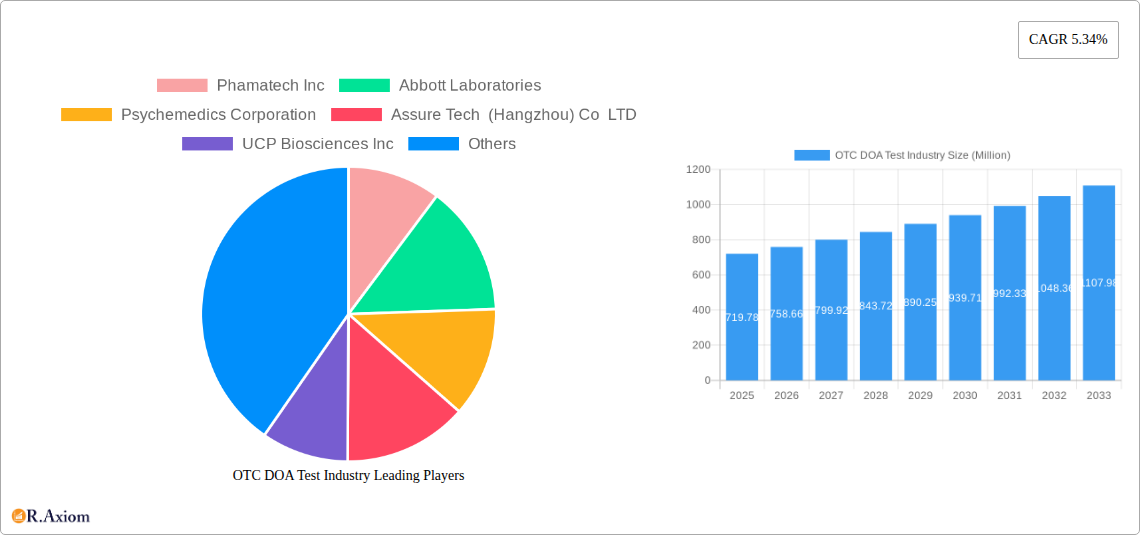
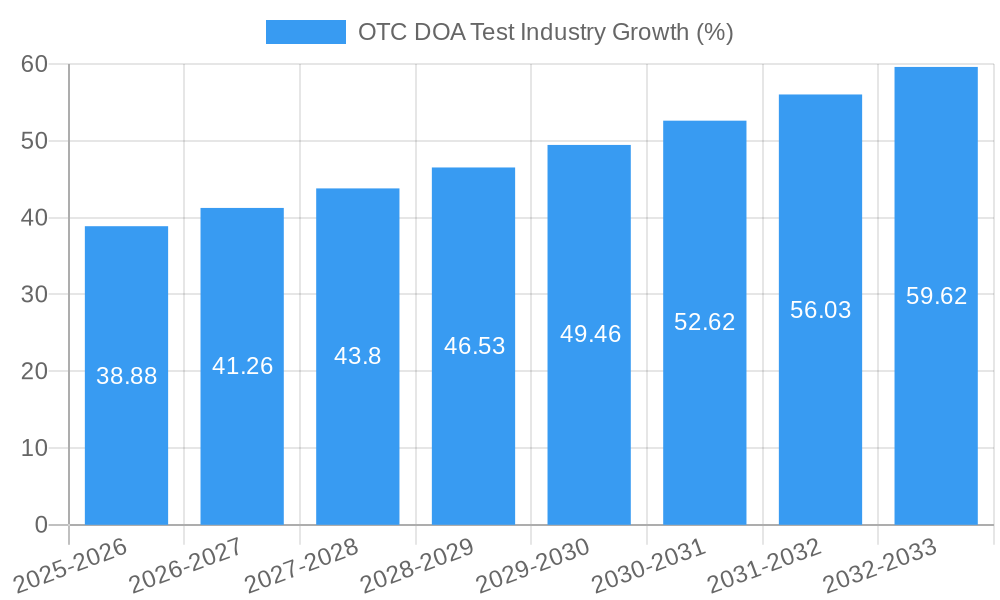
The over-the-counter (OTC) drug of abuse (DOA) testing market, valued at $719.78 million in 2025, is projected to experience robust growth, driven by several key factors. Increased awareness of substance abuse issues, coupled with the rising demand for convenient and readily accessible testing solutions, fuels market expansion. The convenience of at-home testing, eliminating the need for clinic visits, significantly contributes to this growth. Furthermore, technological advancements in DOA testing, leading to more accurate, reliable, and user-friendly products, are further propelling market adoption. Saliva-based tests are gaining popularity due to their non-invasive nature, contributing to a significant segment share within the market. The increasing prevalence of workplace drug testing programs and the growing focus on employee safety and productivity are also major drivers. However, regulatory hurdles and concerns surrounding the accuracy and interpretation of OTC DOA test results pose challenges. The market faces competitive pressures from established players and emerging innovative companies vying for market share. Despite these restraints, the long-term forecast remains positive, indicating substantial market expansion throughout the forecast period (2025-2033).
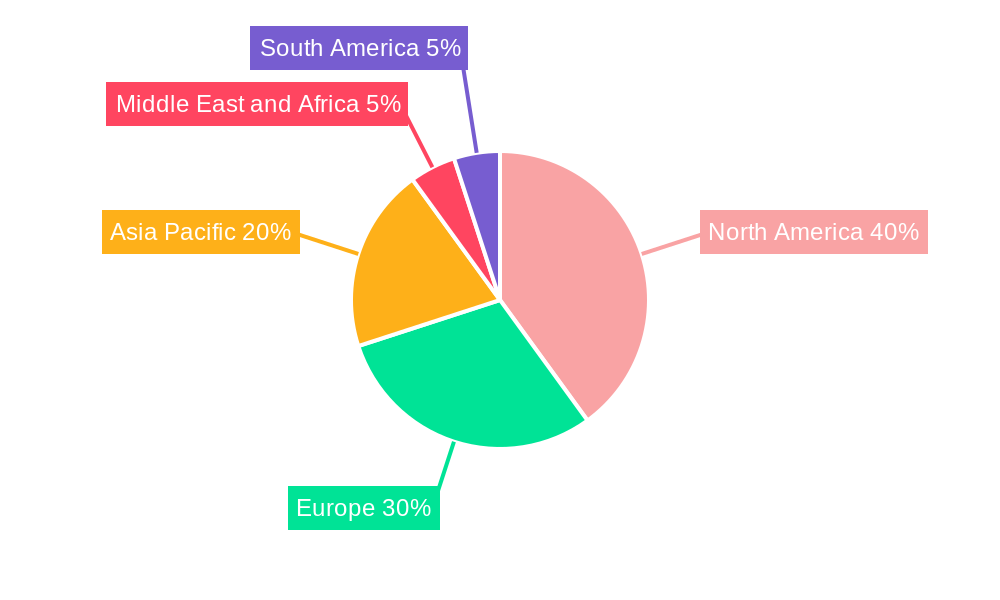
The geographical distribution of the OTC DOA testing market reflects varying levels of awareness and regulatory frameworks across regions. North America, with its established healthcare infrastructure and high awareness of substance abuse, commands a significant market share. However, the Asia-Pacific region is anticipated to witness significant growth driven by rising disposable incomes, increasing urbanization, and a growing understanding of the importance of early detection and intervention in substance abuse issues. Europe is another key market, demonstrating steady growth driven by stringent workplace regulations and increasing government initiatives aimed at curbing substance abuse. The continued expansion into emerging markets in Africa and South America is also expected to contribute to overall market growth, albeit at a slower pace compared to developed regions. The market segmentation by test type (cups, strips, others) and sample type (saliva, urine, blood, others) provides further insights into the diverse needs and preferences of consumers and healthcare professionals, influencing market dynamics and future growth trajectories.
This comprehensive report provides a detailed analysis of the Over-the-Counter (OTC) Drug of Abuse (DOA) testing market, offering valuable insights for industry stakeholders, investors, and researchers. The study period covers 2019-2033, with 2025 as the base and estimated year, and the forecast period spanning 2025-2033. The historical period analyzed is 2019-2024. The report projects a market valued at xx Million USD by 2033, exhibiting a CAGR of xx% during the forecast period.
OTC DOA Test Industry Market Concentration & Innovation
The OTC DOA test market exhibits a moderately concentrated landscape, with key players like Phamatech Inc, Abbott Laboratories, and Psychemedics Corporation holding significant market share. Precise market share figures are unavailable for this report but are estimated to fluctuate between 10-25% for each of these top players, leaving a xx% market share to be claimed by remaining players. Innovation is driven by the need for more accurate, rapid, and user-friendly tests. Regulatory frameworks, such as FDA approvals in the US and equivalent certifications in other regions, play a crucial role. Product substitutes include professional lab testing, which maintains a competitive edge in terms of accuracy and breadth of testing but lacks the convenience of OTC solutions. End-user trends reflect increasing demand for home-based testing solutions, fueled by rising awareness of substance abuse and increased accessibility. M&A activity in the sector has been moderate, with deal values averaging xx Million USD over the past five years. Deal volume is expected to remain relatively constant in the coming years, with a few large acquisitions by prominent companies being anticipated.
OTC DOA Test Industry Industry Trends & Insights
The OTC DOA test market is experiencing robust growth, driven by several key factors. The rising prevalence of substance abuse globally contributes significantly to market expansion. Technological advancements, such as the development of more sensitive and specific testing methods (e.g., improved immunoassay technologies), are enhancing the accuracy and reliability of OTC tests. Consumer preferences increasingly favor convenient, at-home testing options, leading to the high demand for user-friendly test formats. Competitive dynamics are characterized by ongoing innovation, product differentiation, and strategic partnerships. Market penetration of OTC DOA tests remains relatively low in several regions, providing significant opportunities for expansion. The market is predicted to reach xx Million USD by 2033, with a CAGR of xx% from 2025. Increased consumer awareness campaigns and improved healthcare access contribute to the positive growth outlook. The rise of telehealth and online pharmacies further facilitates the accessibility of these tests.
Dominant Markets & Segments in OTC DOA Test Industry
The North American market currently dominates the OTC DOA test industry, driven by high awareness of substance abuse issues, robust healthcare infrastructure, and greater availability of OTC testing options. Within this region, the United States holds the largest market share.
- Key Drivers of North American Dominance:
- High prevalence of substance abuse
- Well-developed healthcare infrastructure
- High consumer disposable income
- Favorable regulatory environment
- Extensive distribution networks
Segment Analysis:
- Type: Test strips currently hold the largest segment share, due to their ease of use and cost-effectiveness. Test cups are expected to show significant growth due to improved accuracy and reliability, while the "Others" category encompasses specialized tests with niche applications.
- Sample Type: Urine-based tests continue to dominate the market due to their established use and widespread acceptance. However, saliva-based tests are gaining traction due to their non-invasive nature and convenience. Blood-based tests are mostly confined to professional settings. The "Others" category includes less common sample types.
Detailed analysis reveals that the North American market is expected to maintain its dominance throughout the forecast period, with significant growth potential in other developed and emerging economies.
OTC DOA Test Industry Product Developments
Recent product innovations focus on improving test accuracy, speed, and user experience. The development of point-of-care devices and digital platforms which improve result interpretation and reporting are gaining momentum. These advancements contribute to greater convenience and reduce the need for laboratory analysis. Manufacturers are focusing on developing tests that can detect a wider range of substances with increased sensitivity, meeting the growing demand for comprehensive testing solutions. Companies are also prioritizing the development of user-friendly formats, incorporating features like easy-to-read results and clear instructions to enhance the overall user experience. This competitive landscape drives continuous improvements in product performance and accessibility.
Report Scope & Segmentation Analysis
This report segments the OTC DOA test market based on test type (Test Cups, Test Strips, Others) and sample type (Saliva, Urine, Blood, Others). Each segment is analyzed based on its historical performance, current market size, and projected growth. Competitive dynamics within each segment are also assessed, considering the presence of major players, technological advancements, and emerging trends. For instance, the Test Strips segment is projected to maintain steady growth fueled by the cost-effectiveness and convenience of its products. The Urine sample type segment is expected to remain dominant but to experience reduced CAGR.
Key Drivers of OTC DOA Test Industry Growth
The OTC DOA test market is primarily driven by a growing awareness of substance abuse problems, leading to increased demand for convenient and accessible testing solutions. Technological advancements in test methodologies contribute to improved accuracy, speed, and ease of use. Favorable regulatory environments in several countries streamline product approvals and market entry. Lastly, increasing healthcare spending and readily available online distribution channels fuel market growth, contributing to improved accessibility of OTC DOA tests.
Challenges in the OTC DOA Test Industry Sector
Significant challenges include maintaining the accuracy and reliability of home-testing solutions, stringent regulatory approvals for new product launches, and ensuring supply chain stability. Competitive pressures from established players and the emergence of new entrants pose challenges to market share retention. Furthermore, concerns about the misuse of these tests and the potential for false-positive or false-negative results present challenges for manufacturers and regulators alike. These factors influence the market dynamics and necessitate continuous improvements in product development and quality assurance.
Emerging Opportunities in OTC DOA Test Industry
Emerging opportunities exist in expanding into new geographic markets, particularly in developing countries with high rates of substance abuse but limited access to testing facilities. The development of multi-analyte tests capable of detecting a wider range of substances simultaneously also presents significant potential for market growth. The integration of digital technologies, such as smartphone applications for result interpretation and data management, is a significant growth area. Furthermore, the growing acceptance and increased adoption of at-home healthcare further fuels the potential growth for OTC DOA tests.
Leading Players in the OTC DOA Test Industry Market
- Phamatech Inc
- Abbott Laboratories
- Psychemedics Corporation
- Assure Tech (Hangzhou) Co LTD
- UCP Biosciences Inc
- Dragerwerk AG & Co KGaA
- Orient New Life Medical Co Ltd
- Confirm BioSciences
- Atlas Medical GmbH
Key Developments in OTC DOA Test Industry Industry
- March 2022: The Department of Health and Human Services (HHS) provided USD 58.5 Million in funding for contingency management tests for stimulant use disorder in California. This highlights increased governmental support for improved access to DOA testing.
- October 2021: VeritequeUSA Inc. launched Verifique, its first consumer brand of narcotics and explosives testing kits, expanding the market beyond professional use. This signifies the movement towards greater accessibility of DOA testing for the general public.
Strategic Outlook for OTC DOA Test Industry Market
The OTC DOA test market is poised for substantial growth driven by several factors, including the rising prevalence of substance abuse, advancements in testing technologies, and increasing consumer demand for convenient home-testing solutions. Expanding into new geographic markets, developing innovative products, and focusing on digital integration strategies will be critical for companies seeking to capitalize on the market's considerable potential. The continued growth in the market hinges upon successful product innovation, targeted marketing strategies, and adapting to evolving regulatory landscape.
OTC DOA Test Industry Segmentation
-
1. Type
- 1.1. Test Cups
- 1.2. Test Strips
- 1.3. Others
-
2. Sample Type
- 2.1. Saliva
- 2.2. Urine
- 2.3. Blood
- 2.4. Others
OTC DOA Test Industry Segmentation By Geography
-
1. North America
- 1.1. United States
- 1.2. Canada
- 1.3. Mexico
-
2. Europe
- 2.1. Germany
- 2.2. United Kingdom
- 2.3. France
- 2.4. Italy
- 2.5. Spain
- 2.6. Rest of Europe
-
3. Asia Pacific
- 3.1. China
- 3.2. Japan
- 3.3. India
- 3.4. Australia
- 3.5. South Korea
- 3.6. Rest of Asia Pacific
-
4. Middle East and Africa
- 4.1. GCC
- 4.2. South Africa
- 4.3. Rest of Middle East and Africa
-
5. South America
- 5.1. Brazil
- 5.2. Argentina
- 5.3. Rest of South America
OTC DOA Test Industry REPORT HIGHLIGHTS
| Aspects | Details |
|---|---|
| Study Period | 2019-2033 |
| Base Year | 2024 |
| Estimated Year | 2025 |
| Forecast Period | 2025-2033 |
| Historical Period | 2019-2024 |
| Growth Rate | CAGR of 5.34% from 2019-2033 |
| Segmentation |
|
Table of Contents
- 1. Introduction
- 1.1. Research Scope
- 1.2. Market Segmentation
- 1.3. Research Methodology
- 1.4. Definitions and Assumptions
- 2. Executive Summary
- 2.1. Introduction
- 3. Market Dynamics
- 3.1. Introduction
- 3.2. Market Drivers
- 3.2.1. Growing Use and Production of Illicit Drugs; Increasing Initiatives by Governemnt Organizations to Reduce Drug Abuse
- 3.3. Market Restrains
- 3.3.1. Lack of Awareness and Consideration of Drug Testing
- 3.4. Market Trends
- 3.4.1. Test Strip Segment is Expected to Hold a Significant Market Share Over the Forecast Period
- 4. Market Factor Analysis
- 4.1. Porters Five Forces
- 4.2. Supply/Value Chain
- 4.3. PESTEL analysis
- 4.4. Market Entropy
- 4.5. Patent/Trademark Analysis
- 5. Global OTC DOA Test Industry Analysis, Insights and Forecast, 2019-2031
- 5.1. Market Analysis, Insights and Forecast - by Type
- 5.1.1. Test Cups
- 5.1.2. Test Strips
- 5.1.3. Others
- 5.2. Market Analysis, Insights and Forecast - by Sample Type
- 5.2.1. Saliva
- 5.2.2. Urine
- 5.2.3. Blood
- 5.2.4. Others
- 5.3. Market Analysis, Insights and Forecast - by Region
- 5.3.1. North America
- 5.3.2. Europe
- 5.3.3. Asia Pacific
- 5.3.4. Middle East and Africa
- 5.3.5. South America
- 5.1. Market Analysis, Insights and Forecast - by Type
- 6. North America OTC DOA Test Industry Analysis, Insights and Forecast, 2019-2031
- 6.1. Market Analysis, Insights and Forecast - by Type
- 6.1.1. Test Cups
- 6.1.2. Test Strips
- 6.1.3. Others
- 6.2. Market Analysis, Insights and Forecast - by Sample Type
- 6.2.1. Saliva
- 6.2.2. Urine
- 6.2.3. Blood
- 6.2.4. Others
- 6.1. Market Analysis, Insights and Forecast - by Type
- 7. Europe OTC DOA Test Industry Analysis, Insights and Forecast, 2019-2031
- 7.1. Market Analysis, Insights and Forecast - by Type
- 7.1.1. Test Cups
- 7.1.2. Test Strips
- 7.1.3. Others
- 7.2. Market Analysis, Insights and Forecast - by Sample Type
- 7.2.1. Saliva
- 7.2.2. Urine
- 7.2.3. Blood
- 7.2.4. Others
- 7.1. Market Analysis, Insights and Forecast - by Type
- 8. Asia Pacific OTC DOA Test Industry Analysis, Insights and Forecast, 2019-2031
- 8.1. Market Analysis, Insights and Forecast - by Type
- 8.1.1. Test Cups
- 8.1.2. Test Strips
- 8.1.3. Others
- 8.2. Market Analysis, Insights and Forecast - by Sample Type
- 8.2.1. Saliva
- 8.2.2. Urine
- 8.2.3. Blood
- 8.2.4. Others
- 8.1. Market Analysis, Insights and Forecast - by Type
- 9. Middle East and Africa OTC DOA Test Industry Analysis, Insights and Forecast, 2019-2031
- 9.1. Market Analysis, Insights and Forecast - by Type
- 9.1.1. Test Cups
- 9.1.2. Test Strips
- 9.1.3. Others
- 9.2. Market Analysis, Insights and Forecast - by Sample Type
- 9.2.1. Saliva
- 9.2.2. Urine
- 9.2.3. Blood
- 9.2.4. Others
- 9.1. Market Analysis, Insights and Forecast - by Type
- 10. South America OTC DOA Test Industry Analysis, Insights and Forecast, 2019-2031
- 10.1. Market Analysis, Insights and Forecast - by Type
- 10.1.1. Test Cups
- 10.1.2. Test Strips
- 10.1.3. Others
- 10.2. Market Analysis, Insights and Forecast - by Sample Type
- 10.2.1. Saliva
- 10.2.2. Urine
- 10.2.3. Blood
- 10.2.4. Others
- 10.1. Market Analysis, Insights and Forecast - by Type
- 11. North America OTC DOA Test Industry Analysis, Insights and Forecast, 2019-2031
- 11.1. Market Analysis, Insights and Forecast - By Country/Sub-region
- 11.1.1 United States
- 11.1.2 Canada
- 11.1.3 Mexico
- 12. Europe OTC DOA Test Industry Analysis, Insights and Forecast, 2019-2031
- 12.1. Market Analysis, Insights and Forecast - By Country/Sub-region
- 12.1.1 Germany
- 12.1.2 United Kingdom
- 12.1.3 France
- 12.1.4 Italy
- 12.1.5 Spain
- 12.1.6 Rest of Europe
- 13. Asia Pacific OTC DOA Test Industry Analysis, Insights and Forecast, 2019-2031
- 13.1. Market Analysis, Insights and Forecast - By Country/Sub-region
- 13.1.1 China
- 13.1.2 Japan
- 13.1.3 India
- 13.1.4 Australia
- 13.1.5 South Korea
- 13.1.6 Rest of Asia Pacific
- 14. Middle East and Africa OTC DOA Test Industry Analysis, Insights and Forecast, 2019-2031
- 14.1. Market Analysis, Insights and Forecast - By Country/Sub-region
- 14.1.1 GCC
- 14.1.2 South Africa
- 14.1.3 Rest of Middle East and Africa
- 15. South America OTC DOA Test Industry Analysis, Insights and Forecast, 2019-2031
- 15.1. Market Analysis, Insights and Forecast - By Country/Sub-region
- 15.1.1 Brazil
- 15.1.2 Argentina
- 15.1.3 Rest of South America
- 16. Competitive Analysis
- 16.1. Global Market Share Analysis 2024
- 16.2. Company Profiles
- 16.2.1 Phamatech Inc
- 16.2.1.1. Overview
- 16.2.1.2. Products
- 16.2.1.3. SWOT Analysis
- 16.2.1.4. Recent Developments
- 16.2.1.5. Financials (Based on Availability)
- 16.2.2 Abbott Laboratories
- 16.2.2.1. Overview
- 16.2.2.2. Products
- 16.2.2.3. SWOT Analysis
- 16.2.2.4. Recent Developments
- 16.2.2.5. Financials (Based on Availability)
- 16.2.3 Psychemedics Corporation
- 16.2.3.1. Overview
- 16.2.3.2. Products
- 16.2.3.3. SWOT Analysis
- 16.2.3.4. Recent Developments
- 16.2.3.5. Financials (Based on Availability)
- 16.2.4 Assure Tech (Hangzhou) Co LTD
- 16.2.4.1. Overview
- 16.2.4.2. Products
- 16.2.4.3. SWOT Analysis
- 16.2.4.4. Recent Developments
- 16.2.4.5. Financials (Based on Availability)
- 16.2.5 UCP Biosciences Inc
- 16.2.5.1. Overview
- 16.2.5.2. Products
- 16.2.5.3. SWOT Analysis
- 16.2.5.4. Recent Developments
- 16.2.5.5. Financials (Based on Availability)
- 16.2.6 Dragerwerk AG & Co KGaA
- 16.2.6.1. Overview
- 16.2.6.2. Products
- 16.2.6.3. SWOT Analysis
- 16.2.6.4. Recent Developments
- 16.2.6.5. Financials (Based on Availability)
- 16.2.7 Orient New Life Medical Co Ltd
- 16.2.7.1. Overview
- 16.2.7.2. Products
- 16.2.7.3. SWOT Analysis
- 16.2.7.4. Recent Developments
- 16.2.7.5. Financials (Based on Availability)
- 16.2.8 Confirm BioSciences
- 16.2.8.1. Overview
- 16.2.8.2. Products
- 16.2.8.3. SWOT Analysis
- 16.2.8.4. Recent Developments
- 16.2.8.5. Financials (Based on Availability)
- 16.2.9 Atlas Medical GmbH
- 16.2.9.1. Overview
- 16.2.9.2. Products
- 16.2.9.3. SWOT Analysis
- 16.2.9.4. Recent Developments
- 16.2.9.5. Financials (Based on Availability)
- 16.2.1 Phamatech Inc
List of Figures
- Figure 1: Global OTC DOA Test Industry Revenue Breakdown (Million, %) by Region 2024 & 2032
- Figure 2: Global OTC DOA Test Industry Volume Breakdown (K Unit, %) by Region 2024 & 2032
- Figure 3: North America OTC DOA Test Industry Revenue (Million), by Country 2024 & 2032
- Figure 4: North America OTC DOA Test Industry Volume (K Unit), by Country 2024 & 2032
- Figure 5: North America OTC DOA Test Industry Revenue Share (%), by Country 2024 & 2032
- Figure 6: North America OTC DOA Test Industry Volume Share (%), by Country 2024 & 2032
- Figure 7: Europe OTC DOA Test Industry Revenue (Million), by Country 2024 & 2032
- Figure 8: Europe OTC DOA Test Industry Volume (K Unit), by Country 2024 & 2032
- Figure 9: Europe OTC DOA Test Industry Revenue Share (%), by Country 2024 & 2032
- Figure 10: Europe OTC DOA Test Industry Volume Share (%), by Country 2024 & 2032
- Figure 11: Asia Pacific OTC DOA Test Industry Revenue (Million), by Country 2024 & 2032
- Figure 12: Asia Pacific OTC DOA Test Industry Volume (K Unit), by Country 2024 & 2032
- Figure 13: Asia Pacific OTC DOA Test Industry Revenue Share (%), by Country 2024 & 2032
- Figure 14: Asia Pacific OTC DOA Test Industry Volume Share (%), by Country 2024 & 2032
- Figure 15: Middle East and Africa OTC DOA Test Industry Revenue (Million), by Country 2024 & 2032
- Figure 16: Middle East and Africa OTC DOA Test Industry Volume (K Unit), by Country 2024 & 2032
- Figure 17: Middle East and Africa OTC DOA Test Industry Revenue Share (%), by Country 2024 & 2032
- Figure 18: Middle East and Africa OTC DOA Test Industry Volume Share (%), by Country 2024 & 2032
- Figure 19: South America OTC DOA Test Industry Revenue (Million), by Country 2024 & 2032
- Figure 20: South America OTC DOA Test Industry Volume (K Unit), by Country 2024 & 2032
- Figure 21: South America OTC DOA Test Industry Revenue Share (%), by Country 2024 & 2032
- Figure 22: South America OTC DOA Test Industry Volume Share (%), by Country 2024 & 2032
- Figure 23: North America OTC DOA Test Industry Revenue (Million), by Type 2024 & 2032
- Figure 24: North America OTC DOA Test Industry Volume (K Unit), by Type 2024 & 2032
- Figure 25: North America OTC DOA Test Industry Revenue Share (%), by Type 2024 & 2032
- Figure 26: North America OTC DOA Test Industry Volume Share (%), by Type 2024 & 2032
- Figure 27: North America OTC DOA Test Industry Revenue (Million), by Sample Type 2024 & 2032
- Figure 28: North America OTC DOA Test Industry Volume (K Unit), by Sample Type 2024 & 2032
- Figure 29: North America OTC DOA Test Industry Revenue Share (%), by Sample Type 2024 & 2032
- Figure 30: North America OTC DOA Test Industry Volume Share (%), by Sample Type 2024 & 2032
- Figure 31: North America OTC DOA Test Industry Revenue (Million), by Country 2024 & 2032
- Figure 32: North America OTC DOA Test Industry Volume (K Unit), by Country 2024 & 2032
- Figure 33: North America OTC DOA Test Industry Revenue Share (%), by Country 2024 & 2032
- Figure 34: North America OTC DOA Test Industry Volume Share (%), by Country 2024 & 2032
- Figure 35: Europe OTC DOA Test Industry Revenue (Million), by Type 2024 & 2032
- Figure 36: Europe OTC DOA Test Industry Volume (K Unit), by Type 2024 & 2032
- Figure 37: Europe OTC DOA Test Industry Revenue Share (%), by Type 2024 & 2032
- Figure 38: Europe OTC DOA Test Industry Volume Share (%), by Type 2024 & 2032
- Figure 39: Europe OTC DOA Test Industry Revenue (Million), by Sample Type 2024 & 2032
- Figure 40: Europe OTC DOA Test Industry Volume (K Unit), by Sample Type 2024 & 2032
- Figure 41: Europe OTC DOA Test Industry Revenue Share (%), by Sample Type 2024 & 2032
- Figure 42: Europe OTC DOA Test Industry Volume Share (%), by Sample Type 2024 & 2032
- Figure 43: Europe OTC DOA Test Industry Revenue (Million), by Country 2024 & 2032
- Figure 44: Europe OTC DOA Test Industry Volume (K Unit), by Country 2024 & 2032
- Figure 45: Europe OTC DOA Test Industry Revenue Share (%), by Country 2024 & 2032
- Figure 46: Europe OTC DOA Test Industry Volume Share (%), by Country 2024 & 2032
- Figure 47: Asia Pacific OTC DOA Test Industry Revenue (Million), by Type 2024 & 2032
- Figure 48: Asia Pacific OTC DOA Test Industry Volume (K Unit), by Type 2024 & 2032
- Figure 49: Asia Pacific OTC DOA Test Industry Revenue Share (%), by Type 2024 & 2032
- Figure 50: Asia Pacific OTC DOA Test Industry Volume Share (%), by Type 2024 & 2032
- Figure 51: Asia Pacific OTC DOA Test Industry Revenue (Million), by Sample Type 2024 & 2032
- Figure 52: Asia Pacific OTC DOA Test Industry Volume (K Unit), by Sample Type 2024 & 2032
- Figure 53: Asia Pacific OTC DOA Test Industry Revenue Share (%), by Sample Type 2024 & 2032
- Figure 54: Asia Pacific OTC DOA Test Industry Volume Share (%), by Sample Type 2024 & 2032
- Figure 55: Asia Pacific OTC DOA Test Industry Revenue (Million), by Country 2024 & 2032
- Figure 56: Asia Pacific OTC DOA Test Industry Volume (K Unit), by Country 2024 & 2032
- Figure 57: Asia Pacific OTC DOA Test Industry Revenue Share (%), by Country 2024 & 2032
- Figure 58: Asia Pacific OTC DOA Test Industry Volume Share (%), by Country 2024 & 2032
- Figure 59: Middle East and Africa OTC DOA Test Industry Revenue (Million), by Type 2024 & 2032
- Figure 60: Middle East and Africa OTC DOA Test Industry Volume (K Unit), by Type 2024 & 2032
- Figure 61: Middle East and Africa OTC DOA Test Industry Revenue Share (%), by Type 2024 & 2032
- Figure 62: Middle East and Africa OTC DOA Test Industry Volume Share (%), by Type 2024 & 2032
- Figure 63: Middle East and Africa OTC DOA Test Industry Revenue (Million), by Sample Type 2024 & 2032
- Figure 64: Middle East and Africa OTC DOA Test Industry Volume (K Unit), by Sample Type 2024 & 2032
- Figure 65: Middle East and Africa OTC DOA Test Industry Revenue Share (%), by Sample Type 2024 & 2032
- Figure 66: Middle East and Africa OTC DOA Test Industry Volume Share (%), by Sample Type 2024 & 2032
- Figure 67: Middle East and Africa OTC DOA Test Industry Revenue (Million), by Country 2024 & 2032
- Figure 68: Middle East and Africa OTC DOA Test Industry Volume (K Unit), by Country 2024 & 2032
- Figure 69: Middle East and Africa OTC DOA Test Industry Revenue Share (%), by Country 2024 & 2032
- Figure 70: Middle East and Africa OTC DOA Test Industry Volume Share (%), by Country 2024 & 2032
- Figure 71: South America OTC DOA Test Industry Revenue (Million), by Type 2024 & 2032
- Figure 72: South America OTC DOA Test Industry Volume (K Unit), by Type 2024 & 2032
- Figure 73: South America OTC DOA Test Industry Revenue Share (%), by Type 2024 & 2032
- Figure 74: South America OTC DOA Test Industry Volume Share (%), by Type 2024 & 2032
- Figure 75: South America OTC DOA Test Industry Revenue (Million), by Sample Type 2024 & 2032
- Figure 76: South America OTC DOA Test Industry Volume (K Unit), by Sample Type 2024 & 2032
- Figure 77: South America OTC DOA Test Industry Revenue Share (%), by Sample Type 2024 & 2032
- Figure 78: South America OTC DOA Test Industry Volume Share (%), by Sample Type 2024 & 2032
- Figure 79: South America OTC DOA Test Industry Revenue (Million), by Country 2024 & 2032
- Figure 80: South America OTC DOA Test Industry Volume (K Unit), by Country 2024 & 2032
- Figure 81: South America OTC DOA Test Industry Revenue Share (%), by Country 2024 & 2032
- Figure 82: South America OTC DOA Test Industry Volume Share (%), by Country 2024 & 2032
List of Tables
- Table 1: Global OTC DOA Test Industry Revenue Million Forecast, by Region 2019 & 2032
- Table 2: Global OTC DOA Test Industry Volume K Unit Forecast, by Region 2019 & 2032
- Table 3: Global OTC DOA Test Industry Revenue Million Forecast, by Type 2019 & 2032
- Table 4: Global OTC DOA Test Industry Volume K Unit Forecast, by Type 2019 & 2032
- Table 5: Global OTC DOA Test Industry Revenue Million Forecast, by Sample Type 2019 & 2032
- Table 6: Global OTC DOA Test Industry Volume K Unit Forecast, by Sample Type 2019 & 2032
- Table 7: Global OTC DOA Test Industry Revenue Million Forecast, by Region 2019 & 2032
- Table 8: Global OTC DOA Test Industry Volume K Unit Forecast, by Region 2019 & 2032
- Table 9: Global OTC DOA Test Industry Revenue Million Forecast, by Country 2019 & 2032
- Table 10: Global OTC DOA Test Industry Volume K Unit Forecast, by Country 2019 & 2032
- Table 11: United States OTC DOA Test Industry Revenue (Million) Forecast, by Application 2019 & 2032
- Table 12: United States OTC DOA Test Industry Volume (K Unit) Forecast, by Application 2019 & 2032
- Table 13: Canada OTC DOA Test Industry Revenue (Million) Forecast, by Application 2019 & 2032
- Table 14: Canada OTC DOA Test Industry Volume (K Unit) Forecast, by Application 2019 & 2032
- Table 15: Mexico OTC DOA Test Industry Revenue (Million) Forecast, by Application 2019 & 2032
- Table 16: Mexico OTC DOA Test Industry Volume (K Unit) Forecast, by Application 2019 & 2032
- Table 17: Global OTC DOA Test Industry Revenue Million Forecast, by Country 2019 & 2032
- Table 18: Global OTC DOA Test Industry Volume K Unit Forecast, by Country 2019 & 2032
- Table 19: Germany OTC DOA Test Industry Revenue (Million) Forecast, by Application 2019 & 2032
- Table 20: Germany OTC DOA Test Industry Volume (K Unit) Forecast, by Application 2019 & 2032
- Table 21: United Kingdom OTC DOA Test Industry Revenue (Million) Forecast, by Application 2019 & 2032
- Table 22: United Kingdom OTC DOA Test Industry Volume (K Unit) Forecast, by Application 2019 & 2032
- Table 23: France OTC DOA Test Industry Revenue (Million) Forecast, by Application 2019 & 2032
- Table 24: France OTC DOA Test Industry Volume (K Unit) Forecast, by Application 2019 & 2032
- Table 25: Italy OTC DOA Test Industry Revenue (Million) Forecast, by Application 2019 & 2032
- Table 26: Italy OTC DOA Test Industry Volume (K Unit) Forecast, by Application 2019 & 2032
- Table 27: Spain OTC DOA Test Industry Revenue (Million) Forecast, by Application 2019 & 2032
- Table 28: Spain OTC DOA Test Industry Volume (K Unit) Forecast, by Application 2019 & 2032
- Table 29: Rest of Europe OTC DOA Test Industry Revenue (Million) Forecast, by Application 2019 & 2032
- Table 30: Rest of Europe OTC DOA Test Industry Volume (K Unit) Forecast, by Application 2019 & 2032
- Table 31: Global OTC DOA Test Industry Revenue Million Forecast, by Country 2019 & 2032
- Table 32: Global OTC DOA Test Industry Volume K Unit Forecast, by Country 2019 & 2032
- Table 33: China OTC DOA Test Industry Revenue (Million) Forecast, by Application 2019 & 2032
- Table 34: China OTC DOA Test Industry Volume (K Unit) Forecast, by Application 2019 & 2032
- Table 35: Japan OTC DOA Test Industry Revenue (Million) Forecast, by Application 2019 & 2032
- Table 36: Japan OTC DOA Test Industry Volume (K Unit) Forecast, by Application 2019 & 2032
- Table 37: India OTC DOA Test Industry Revenue (Million) Forecast, by Application 2019 & 2032
- Table 38: India OTC DOA Test Industry Volume (K Unit) Forecast, by Application 2019 & 2032
- Table 39: Australia OTC DOA Test Industry Revenue (Million) Forecast, by Application 2019 & 2032
- Table 40: Australia OTC DOA Test Industry Volume (K Unit) Forecast, by Application 2019 & 2032
- Table 41: South Korea OTC DOA Test Industry Revenue (Million) Forecast, by Application 2019 & 2032
- Table 42: South Korea OTC DOA Test Industry Volume (K Unit) Forecast, by Application 2019 & 2032
- Table 43: Rest of Asia Pacific OTC DOA Test Industry Revenue (Million) Forecast, by Application 2019 & 2032
- Table 44: Rest of Asia Pacific OTC DOA Test Industry Volume (K Unit) Forecast, by Application 2019 & 2032
- Table 45: Global OTC DOA Test Industry Revenue Million Forecast, by Country 2019 & 2032
- Table 46: Global OTC DOA Test Industry Volume K Unit Forecast, by Country 2019 & 2032
- Table 47: GCC OTC DOA Test Industry Revenue (Million) Forecast, by Application 2019 & 2032
- Table 48: GCC OTC DOA Test Industry Volume (K Unit) Forecast, by Application 2019 & 2032
- Table 49: South Africa OTC DOA Test Industry Revenue (Million) Forecast, by Application 2019 & 2032
- Table 50: South Africa OTC DOA Test Industry Volume (K Unit) Forecast, by Application 2019 & 2032
- Table 51: Rest of Middle East and Africa OTC DOA Test Industry Revenue (Million) Forecast, by Application 2019 & 2032
- Table 52: Rest of Middle East and Africa OTC DOA Test Industry Volume (K Unit) Forecast, by Application 2019 & 2032
- Table 53: Global OTC DOA Test Industry Revenue Million Forecast, by Country 2019 & 2032
- Table 54: Global OTC DOA Test Industry Volume K Unit Forecast, by Country 2019 & 2032
- Table 55: Brazil OTC DOA Test Industry Revenue (Million) Forecast, by Application 2019 & 2032
- Table 56: Brazil OTC DOA Test Industry Volume (K Unit) Forecast, by Application 2019 & 2032
- Table 57: Argentina OTC DOA Test Industry Revenue (Million) Forecast, by Application 2019 & 2032
- Table 58: Argentina OTC DOA Test Industry Volume (K Unit) Forecast, by Application 2019 & 2032
- Table 59: Rest of South America OTC DOA Test Industry Revenue (Million) Forecast, by Application 2019 & 2032
- Table 60: Rest of South America OTC DOA Test Industry Volume (K Unit) Forecast, by Application 2019 & 2032
- Table 61: Global OTC DOA Test Industry Revenue Million Forecast, by Type 2019 & 2032
- Table 62: Global OTC DOA Test Industry Volume K Unit Forecast, by Type 2019 & 2032
- Table 63: Global OTC DOA Test Industry Revenue Million Forecast, by Sample Type 2019 & 2032
- Table 64: Global OTC DOA Test Industry Volume K Unit Forecast, by Sample Type 2019 & 2032
- Table 65: Global OTC DOA Test Industry Revenue Million Forecast, by Country 2019 & 2032
- Table 66: Global OTC DOA Test Industry Volume K Unit Forecast, by Country 2019 & 2032
- Table 67: United States OTC DOA Test Industry Revenue (Million) Forecast, by Application 2019 & 2032
- Table 68: United States OTC DOA Test Industry Volume (K Unit) Forecast, by Application 2019 & 2032
- Table 69: Canada OTC DOA Test Industry Revenue (Million) Forecast, by Application 2019 & 2032
- Table 70: Canada OTC DOA Test Industry Volume (K Unit) Forecast, by Application 2019 & 2032
- Table 71: Mexico OTC DOA Test Industry Revenue (Million) Forecast, by Application 2019 & 2032
- Table 72: Mexico OTC DOA Test Industry Volume (K Unit) Forecast, by Application 2019 & 2032
- Table 73: Global OTC DOA Test Industry Revenue Million Forecast, by Type 2019 & 2032
- Table 74: Global OTC DOA Test Industry Volume K Unit Forecast, by Type 2019 & 2032
- Table 75: Global OTC DOA Test Industry Revenue Million Forecast, by Sample Type 2019 & 2032
- Table 76: Global OTC DOA Test Industry Volume K Unit Forecast, by Sample Type 2019 & 2032
- Table 77: Global OTC DOA Test Industry Revenue Million Forecast, by Country 2019 & 2032
- Table 78: Global OTC DOA Test Industry Volume K Unit Forecast, by Country 2019 & 2032
- Table 79: Germany OTC DOA Test Industry Revenue (Million) Forecast, by Application 2019 & 2032
- Table 80: Germany OTC DOA Test Industry Volume (K Unit) Forecast, by Application 2019 & 2032
- Table 81: United Kingdom OTC DOA Test Industry Revenue (Million) Forecast, by Application 2019 & 2032
- Table 82: United Kingdom OTC DOA Test Industry Volume (K Unit) Forecast, by Application 2019 & 2032
- Table 83: France OTC DOA Test Industry Revenue (Million) Forecast, by Application 2019 & 2032
- Table 84: France OTC DOA Test Industry Volume (K Unit) Forecast, by Application 2019 & 2032
- Table 85: Italy OTC DOA Test Industry Revenue (Million) Forecast, by Application 2019 & 2032
- Table 86: Italy OTC DOA Test Industry Volume (K Unit) Forecast, by Application 2019 & 2032
- Table 87: Spain OTC DOA Test Industry Revenue (Million) Forecast, by Application 2019 & 2032
- Table 88: Spain OTC DOA Test Industry Volume (K Unit) Forecast, by Application 2019 & 2032
- Table 89: Rest of Europe OTC DOA Test Industry Revenue (Million) Forecast, by Application 2019 & 2032
- Table 90: Rest of Europe OTC DOA Test Industry Volume (K Unit) Forecast, by Application 2019 & 2032
- Table 91: Global OTC DOA Test Industry Revenue Million Forecast, by Type 2019 & 2032
- Table 92: Global OTC DOA Test Industry Volume K Unit Forecast, by Type 2019 & 2032
- Table 93: Global OTC DOA Test Industry Revenue Million Forecast, by Sample Type 2019 & 2032
- Table 94: Global OTC DOA Test Industry Volume K Unit Forecast, by Sample Type 2019 & 2032
- Table 95: Global OTC DOA Test Industry Revenue Million Forecast, by Country 2019 & 2032
- Table 96: Global OTC DOA Test Industry Volume K Unit Forecast, by Country 2019 & 2032
- Table 97: China OTC DOA Test Industry Revenue (Million) Forecast, by Application 2019 & 2032
- Table 98: China OTC DOA Test Industry Volume (K Unit) Forecast, by Application 2019 & 2032
- Table 99: Japan OTC DOA Test Industry Revenue (Million) Forecast, by Application 2019 & 2032
- Table 100: Japan OTC DOA Test Industry Volume (K Unit) Forecast, by Application 2019 & 2032
- Table 101: India OTC DOA Test Industry Revenue (Million) Forecast, by Application 2019 & 2032
- Table 102: India OTC DOA Test Industry Volume (K Unit) Forecast, by Application 2019 & 2032
- Table 103: Australia OTC DOA Test Industry Revenue (Million) Forecast, by Application 2019 & 2032
- Table 104: Australia OTC DOA Test Industry Volume (K Unit) Forecast, by Application 2019 & 2032
- Table 105: South Korea OTC DOA Test Industry Revenue (Million) Forecast, by Application 2019 & 2032
- Table 106: South Korea OTC DOA Test Industry Volume (K Unit) Forecast, by Application 2019 & 2032
- Table 107: Rest of Asia Pacific OTC DOA Test Industry Revenue (Million) Forecast, by Application 2019 & 2032
- Table 108: Rest of Asia Pacific OTC DOA Test Industry Volume (K Unit) Forecast, by Application 2019 & 2032
- Table 109: Global OTC DOA Test Industry Revenue Million Forecast, by Type 2019 & 2032
- Table 110: Global OTC DOA Test Industry Volume K Unit Forecast, by Type 2019 & 2032
- Table 111: Global OTC DOA Test Industry Revenue Million Forecast, by Sample Type 2019 & 2032
- Table 112: Global OTC DOA Test Industry Volume K Unit Forecast, by Sample Type 2019 & 2032
- Table 113: Global OTC DOA Test Industry Revenue Million Forecast, by Country 2019 & 2032
- Table 114: Global OTC DOA Test Industry Volume K Unit Forecast, by Country 2019 & 2032
- Table 115: GCC OTC DOA Test Industry Revenue (Million) Forecast, by Application 2019 & 2032
- Table 116: GCC OTC DOA Test Industry Volume (K Unit) Forecast, by Application 2019 & 2032
- Table 117: South Africa OTC DOA Test Industry Revenue (Million) Forecast, by Application 2019 & 2032
- Table 118: South Africa OTC DOA Test Industry Volume (K Unit) Forecast, by Application 2019 & 2032
- Table 119: Rest of Middle East and Africa OTC DOA Test Industry Revenue (Million) Forecast, by Application 2019 & 2032
- Table 120: Rest of Middle East and Africa OTC DOA Test Industry Volume (K Unit) Forecast, by Application 2019 & 2032
- Table 121: Global OTC DOA Test Industry Revenue Million Forecast, by Type 2019 & 2032
- Table 122: Global OTC DOA Test Industry Volume K Unit Forecast, by Type 2019 & 2032
- Table 123: Global OTC DOA Test Industry Revenue Million Forecast, by Sample Type 2019 & 2032
- Table 124: Global OTC DOA Test Industry Volume K Unit Forecast, by Sample Type 2019 & 2032
- Table 125: Global OTC DOA Test Industry Revenue Million Forecast, by Country 2019 & 2032
- Table 126: Global OTC DOA Test Industry Volume K Unit Forecast, by Country 2019 & 2032
- Table 127: Brazil OTC DOA Test Industry Revenue (Million) Forecast, by Application 2019 & 2032
- Table 128: Brazil OTC DOA Test Industry Volume (K Unit) Forecast, by Application 2019 & 2032
- Table 129: Argentina OTC DOA Test Industry Revenue (Million) Forecast, by Application 2019 & 2032
- Table 130: Argentina OTC DOA Test Industry Volume (K Unit) Forecast, by Application 2019 & 2032
- Table 131: Rest of South America OTC DOA Test Industry Revenue (Million) Forecast, by Application 2019 & 2032
- Table 132: Rest of South America OTC DOA Test Industry Volume (K Unit) Forecast, by Application 2019 & 2032
Frequently Asked Questions
1. What is the projected Compound Annual Growth Rate (CAGR) of the OTC DOA Test Industry?
The projected CAGR is approximately 5.34%.
2. Which companies are prominent players in the OTC DOA Test Industry?
Key companies in the market include Phamatech Inc, Abbott Laboratories, Psychemedics Corporation, Assure Tech (Hangzhou) Co LTD, UCP Biosciences Inc, Dragerwerk AG & Co KGaA, Orient New Life Medical Co Ltd, Confirm BioSciences, Atlas Medical GmbH.
3. What are the main segments of the OTC DOA Test Industry?
The market segments include Type, Sample Type.
4. Can you provide details about the market size?
The market size is estimated to be USD 719.78 Million as of 2022.
5. What are some drivers contributing to market growth?
Growing Use and Production of Illicit Drugs; Increasing Initiatives by Governemnt Organizations to Reduce Drug Abuse.
6. What are the notable trends driving market growth?
Test Strip Segment is Expected to Hold a Significant Market Share Over the Forecast Period.
7. Are there any restraints impacting market growth?
Lack of Awareness and Consideration of Drug Testing.
8. Can you provide examples of recent developments in the market?
In March 2022, the Department of Health and Human Services (HHS) offered funding of USD 58.5 million in contingency management tests for people with stimulant use disorder in California.
9. What pricing options are available for accessing the report?
Pricing options include single-user, multi-user, and enterprise licenses priced at USD 4750, USD 5250, and USD 8750 respectively.
10. Is the market size provided in terms of value or volume?
The market size is provided in terms of value, measured in Million and volume, measured in K Unit.
11. Are there any specific market keywords associated with the report?
Yes, the market keyword associated with the report is "OTC DOA Test Industry," which aids in identifying and referencing the specific market segment covered.
12. How do I determine which pricing option suits my needs best?
The pricing options vary based on user requirements and access needs. Individual users may opt for single-user licenses, while businesses requiring broader access may choose multi-user or enterprise licenses for cost-effective access to the report.
13. Are there any additional resources or data provided in the OTC DOA Test Industry report?
While the report offers comprehensive insights, it's advisable to review the specific contents or supplementary materials provided to ascertain if additional resources or data are available.
14. How can I stay updated on further developments or reports in the OTC DOA Test Industry?
To stay informed about further developments, trends, and reports in the OTC DOA Test Industry, consider subscribing to industry newsletters, following relevant companies and organizations, or regularly checking reputable industry news sources and publications.
Methodology
Step 1 - Identification of Relevant Samples Size from Population Database


Step 2 - Approaches for Defining Global Market Size (Value, Volume* & Price*)

Note*: In applicable scenarios
Step 3 - Data Sources
Primary Research
- Web Analytics
- Survey Reports
- Research Institute
- Latest Research Reports
- Opinion Leaders
Secondary Research
- Annual Reports
- White Paper
- Latest Press Release
- Industry Association
- Paid Database
- Investor Presentations

Step 4 - Data Triangulation
Involves using different sources of information in order to increase the validity of a study
These sources are likely to be stakeholders in a program - participants, other researchers, program staff, other community members, and so on.
Then we put all data in single framework & apply various statistical tools to find out the dynamic on the market.
During the analysis stage, feedback from the stakeholder groups would be compared to determine areas of agreement as well as areas of divergence


