
Key Insights
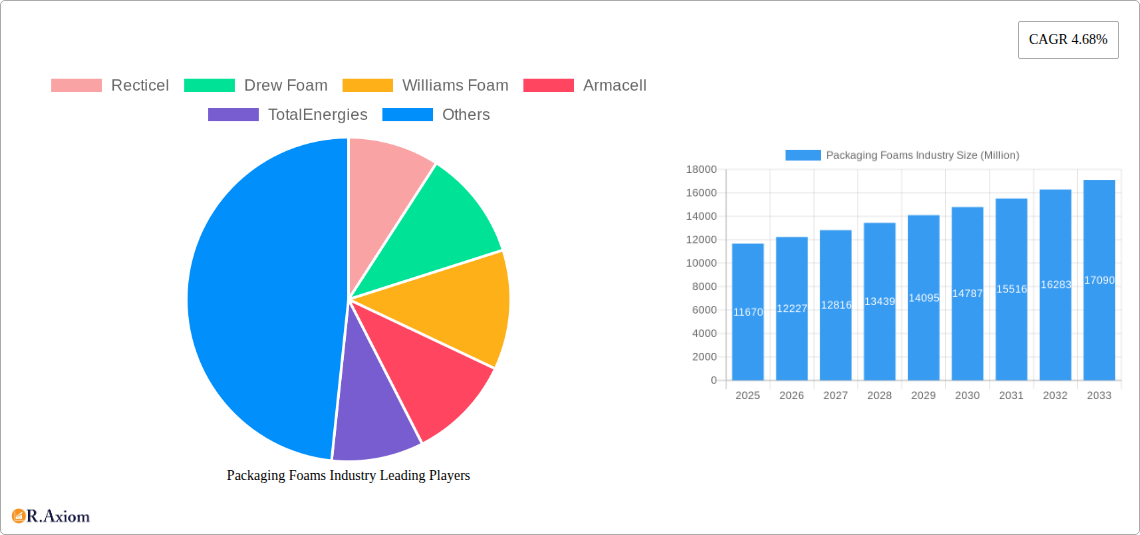
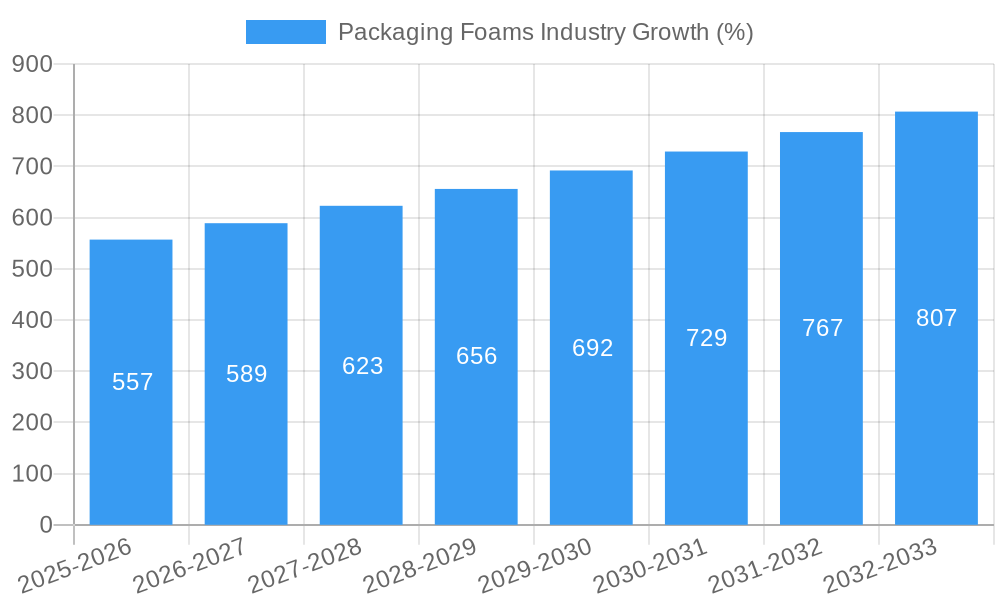
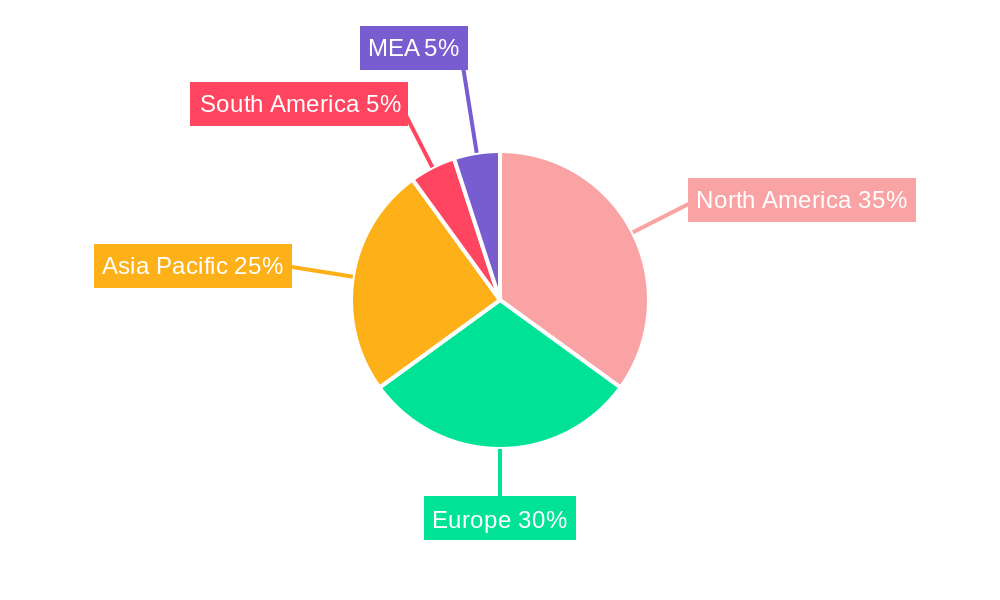
The global packaging foams market, valued at $11.67 billion in 2025, is projected to experience robust growth, driven by a compound annual growth rate (CAGR) of 4.68% from 2025 to 2033. This expansion is fueled by several key factors. The rising demand for lightweight and protective packaging across diverse sectors, including food and beverage, e-commerce, and pharmaceuticals, is a primary driver. Increased consumer awareness of sustainable packaging solutions is also propelling the market, leading to greater adoption of biodegradable and recyclable foam alternatives. Furthermore, advancements in foam technology, such as the development of high-performance materials with improved insulation and cushioning properties, are contributing to market growth. The flexible foam segment currently holds a significant market share due to its versatility and adaptability in various applications, while rigid foams are gaining traction in industrial packaging owing to their strength and durability. Geographically, North America and Europe currently dominate the market, but the Asia-Pacific region is expected to witness the fastest growth in the coming years, driven by rapid industrialization and urbanization. However, fluctuating raw material prices and environmental concerns regarding the disposal of certain foam types pose significant challenges to market expansion.
The competitive landscape of the packaging foams market is characterized by the presence of both established players and emerging companies. Major players like Recticel, Sealed Air, and Borealis AG are investing heavily in research and development to enhance product offerings and expand their market presence. The market is also witnessing increased mergers and acquisitions activity as companies strive to gain a competitive edge and consolidate their market share. Future market growth will likely depend on several factors, including the continued innovation in sustainable foam materials, evolving consumer preferences for eco-friendly packaging, and the overall economic growth in key regional markets. Furthermore, government regulations regarding the use of certain foam types will play a crucial role in shaping the industry's trajectory. The increasing use of polyurethane and polyolefin foams, driven by their versatility, is expected to further fuel market expansion during the forecast period.
This comprehensive report provides an in-depth analysis of the global Packaging Foams industry, covering market size, growth drivers, key players, and future trends. The study period spans from 2019 to 2033, with 2025 serving as the base and estimated year. The report offers actionable insights for industry stakeholders, including manufacturers, distributors, investors, and researchers.
Packaging Foams Industry Market Concentration & Innovation
The global packaging foams market exhibits a moderately concentrated structure, with key players like Recticel, Armacell, and Sealed Air holding significant market share. However, the presence of numerous regional and specialized players contributes to competitive intensity. Innovation is a crucial driver, with ongoing efforts to develop sustainable, high-performance foams. Regulatory frameworks, particularly concerning environmental concerns and material safety, are increasingly shaping industry practices. The rise of biodegradable and recyclable foams represents a key area of innovation. Product substitutes, such as alternative packaging materials (e.g., paper-based solutions), pose a challenge, necessitating continuous improvement in cost-effectiveness and performance. End-user trends towards lightweighting and improved protection are fueling demand for advanced foam solutions. Mergers and acquisitions (M&A) activity, as evidenced by Recticel's acquisition of FoamPartner in March 2021 (estimated deal value: xx Million), play a significant role in market consolidation and technological advancement.
- Market Share (2024 Estimate): Recticel: xx%; Armacell: xx%; Sealed Air: xx%; Others: xx%
- M&A Deal Values (2019-2024): Total value estimated at xx Million.
- Key Innovation Areas: Biodegradable foams, recycled content foams, improved insulation properties, enhanced cushioning capabilities.
Packaging Foams Industry Industry Trends & Insights
The packaging foams market is experiencing robust growth, driven by the expanding e-commerce sector and the increasing need for protective packaging across various industries. The CAGR for the forecast period (2025-2033) is projected to be xx%, driven by factors such as increasing demand for lightweight packaging, enhanced product protection requirements, and stringent environmental regulations. Technological disruptions, including the development of advanced foam formulations and manufacturing processes, are further boosting market growth. Consumer preferences are shifting towards eco-friendly and sustainable packaging solutions. Competitive dynamics are characterized by product differentiation, technological advancements, and strategic partnerships. Market penetration of sustainable foams is steadily increasing, with a projected xx% penetration rate by 2033.
Dominant Markets & Segments in Packaging Foams Industry
The Asia-Pacific region is projected to dominate the packaging foams market due to rapid economic growth, expanding industrial sectors, and increasing e-commerce activities. Within materials, Polyurethane holds the largest market share due to its versatility and superior performance characteristics. Rigid foams dominate the structure segment, primarily driven by applications requiring high-impact protection. Industrial packaging represents the major application segment, driven by robust growth across manufacturing and logistics.
- Key Drivers for Asia-Pacific Dominance: Rapid industrialization, expanding e-commerce, rising disposable incomes.
- Polyurethane Segment Dominance Drivers: Versatility, excellent cushioning and insulation properties, cost-effectiveness for certain applications.
- Rigid Foam Segment Dominance Drivers: High impact resistance, superior protection for goods during transit.
- Industrial Packaging Segment Dominance Drivers: Growth in manufacturing, logistics, and transportation sectors.
Packaging Foams Industry Product Developments
Recent product developments focus on enhancing sustainability, improving performance, and expanding applications. Innovations include the creation of biodegradable foams derived from renewable resources and the development of high-performance foams with improved insulation, cushioning, and impact resistance. These advancements cater to the increasing demand for environmentally friendly packaging and improved product protection. Companies are also focusing on customized foam solutions tailored to specific end-user needs.
Report Scope & Segmentation Analysis
The report segments the packaging foams market based on material (Polystyrene, Polyurethane, Polyolefin, Other Materials), structure (Flexible, Rigid), and application (Food Packaging, Industrial Packaging). Each segment's growth projections, market size, and competitive dynamics are analyzed in detail. For example, the Polyurethane segment exhibits higher growth due to its versatility, while the Industrial Packaging segment shows robust growth due to the expansion of manufacturing and e-commerce.
- Material: Each material segment's market size and growth projections are detailed within the report.
- Structure: Analysis of the market size and growth of flexible and rigid foams.
- Application: Detailed market analysis for food and industrial packaging, including growth projections and competitive dynamics.
Key Drivers of Packaging Foams Industry Growth
Several factors contribute to the Packaging Foams Industry's growth: increasing demand for protective packaging from the e-commerce boom, the need for lightweight and efficient packaging solutions to reduce transportation costs, and the rising adoption of sustainable and eco-friendly packaging materials driven by environmental regulations. Technological advancements in foam formulation and manufacturing processes further enhance market growth.
Challenges in the Packaging Foams Industry Sector
Challenges include fluctuating raw material prices, stringent environmental regulations impacting foam production, competition from alternative packaging materials, and concerns regarding the environmental impact of certain foam types. Supply chain disruptions can also negatively impact production and delivery. These challenges necessitate the adoption of innovative solutions and sustainable practices.
Emerging Opportunities in Packaging Foams Industry
Emerging opportunities include the development of biodegradable and compostable foams, the growing demand for customized packaging solutions, and the expansion into new markets such as medical and healthcare packaging. Advancements in recycling technologies and the increased focus on circular economy models offer significant potential.
Leading Players in the Packaging Foams Industry Market
- Recticel
- Drew Foam
- Williams Foam
- Armacell
- TotalEnergies
- Huntington Solutions
- Atlas Roofing Corporation
- Borealis AG
- Zotefoams PLC
- Sealed Air
- Foamcraft Inc
Key Developments in Packaging Foams Industry Industry
- March 2021: Recticel acquires FoamPartner, expanding its global presence and accelerating sustainable innovation.
- February 2021: Zotefoams opens a new plant in Brzeg, Poland, increasing its production capacity and optimizing European service.
Strategic Outlook for Packaging Foams Industry Market
The packaging foams market is poised for sustained growth, driven by ongoing technological advancements, the rising demand for sustainable packaging, and the expansion of e-commerce. Opportunities lie in developing innovative, eco-friendly foam solutions that meet evolving consumer preferences and stringent environmental regulations. The market's future hinges on players' ability to adapt to these changes and embrace sustainable practices.
Packaging Foams Industry Segmentation
-
1. Material
- 1.1. Polystyrene
- 1.2. Polyurethane
- 1.3. Polyolefin
- 1.4. Other Materials
-
2. Structure
- 2.1. Flexible
- 2.2. Rigid
-
3. Application
- 3.1. Food Packaging
-
3.2. Industrial Packaging
- 3.2.1. Transportation
- 3.2.2. Electrical and Electronics
- 3.2.3. Personal Care
- 3.2.4. Pharmaceutical
- 3.2.5. Other Industrial Packaging
Packaging Foams Industry Segmentation By Geography
-
1. Asia Pacific
- 1.1. China
- 1.2. India
- 1.3. Japan
- 1.4. South Korea
- 1.5. Rest of Asia Pacific
-
2. North America
- 2.1. United States
- 2.2. Canada
- 2.3. Mexico
-
3. Europe
- 3.1. Germany
- 3.2. United Kingdom
- 3.3. Italy
- 3.4. France
- 3.5. Rest of Europe
-
4. South America
- 4.1. Brazil
- 4.2. Argentina
- 4.3. Rest of South America
- 5. Middle East
-
6. Saudi Arabia
- 6.1. South Africa
- 6.2. Rest of Middle East and Africa
Packaging Foams Industry REPORT HIGHLIGHTS
| Aspects | Details |
|---|---|
| Study Period | 2019-2033 |
| Base Year | 2024 |
| Estimated Year | 2025 |
| Forecast Period | 2025-2033 |
| Historical Period | 2019-2024 |
| Growth Rate | CAGR of 4.68% from 2019-2033 |
| Segmentation |
|
Table of Contents
- 1. Introduction
- 1.1. Research Scope
- 1.2. Market Segmentation
- 1.3. Research Methodology
- 1.4. Definitions and Assumptions
- 2. Executive Summary
- 2.1. Introduction
- 3. Market Dynamics
- 3.1. Introduction
- 3.2. Market Drivers
- 3.2.1. Rising Demand from the Packaging Industry
- 3.3. Market Restrains
- 3.3.1. Molded Pulp as a Green Alternative
- 3.4. Market Trends
- 3.4.1. Increasing Demand from the Industrial Packaging Sector
- 4. Market Factor Analysis
- 4.1. Porters Five Forces
- 4.2. Supply/Value Chain
- 4.3. PESTEL analysis
- 4.4. Market Entropy
- 4.5. Patent/Trademark Analysis
- 5. Global Packaging Foams Industry Analysis, Insights and Forecast, 2019-2031
- 5.1. Market Analysis, Insights and Forecast - by Material
- 5.1.1. Polystyrene
- 5.1.2. Polyurethane
- 5.1.3. Polyolefin
- 5.1.4. Other Materials
- 5.2. Market Analysis, Insights and Forecast - by Structure
- 5.2.1. Flexible
- 5.2.2. Rigid
- 5.3. Market Analysis, Insights and Forecast - by Application
- 5.3.1. Food Packaging
- 5.3.2. Industrial Packaging
- 5.3.2.1. Transportation
- 5.3.2.2. Electrical and Electronics
- 5.3.2.3. Personal Care
- 5.3.2.4. Pharmaceutical
- 5.3.2.5. Other Industrial Packaging
- 5.4. Market Analysis, Insights and Forecast - by Region
- 5.4.1. Asia Pacific
- 5.4.2. North America
- 5.4.3. Europe
- 5.4.4. South America
- 5.4.5. Middle East
- 5.4.6. Saudi Arabia
- 5.1. Market Analysis, Insights and Forecast - by Material
- 6. Asia Pacific Packaging Foams Industry Analysis, Insights and Forecast, 2019-2031
- 6.1. Market Analysis, Insights and Forecast - by Material
- 6.1.1. Polystyrene
- 6.1.2. Polyurethane
- 6.1.3. Polyolefin
- 6.1.4. Other Materials
- 6.2. Market Analysis, Insights and Forecast - by Structure
- 6.2.1. Flexible
- 6.2.2. Rigid
- 6.3. Market Analysis, Insights and Forecast - by Application
- 6.3.1. Food Packaging
- 6.3.2. Industrial Packaging
- 6.3.2.1. Transportation
- 6.3.2.2. Electrical and Electronics
- 6.3.2.3. Personal Care
- 6.3.2.4. Pharmaceutical
- 6.3.2.5. Other Industrial Packaging
- 6.1. Market Analysis, Insights and Forecast - by Material
- 7. North America Packaging Foams Industry Analysis, Insights and Forecast, 2019-2031
- 7.1. Market Analysis, Insights and Forecast - by Material
- 7.1.1. Polystyrene
- 7.1.2. Polyurethane
- 7.1.3. Polyolefin
- 7.1.4. Other Materials
- 7.2. Market Analysis, Insights and Forecast - by Structure
- 7.2.1. Flexible
- 7.2.2. Rigid
- 7.3. Market Analysis, Insights and Forecast - by Application
- 7.3.1. Food Packaging
- 7.3.2. Industrial Packaging
- 7.3.2.1. Transportation
- 7.3.2.2. Electrical and Electronics
- 7.3.2.3. Personal Care
- 7.3.2.4. Pharmaceutical
- 7.3.2.5. Other Industrial Packaging
- 7.1. Market Analysis, Insights and Forecast - by Material
- 8. Europe Packaging Foams Industry Analysis, Insights and Forecast, 2019-2031
- 8.1. Market Analysis, Insights and Forecast - by Material
- 8.1.1. Polystyrene
- 8.1.2. Polyurethane
- 8.1.3. Polyolefin
- 8.1.4. Other Materials
- 8.2. Market Analysis, Insights and Forecast - by Structure
- 8.2.1. Flexible
- 8.2.2. Rigid
- 8.3. Market Analysis, Insights and Forecast - by Application
- 8.3.1. Food Packaging
- 8.3.2. Industrial Packaging
- 8.3.2.1. Transportation
- 8.3.2.2. Electrical and Electronics
- 8.3.2.3. Personal Care
- 8.3.2.4. Pharmaceutical
- 8.3.2.5. Other Industrial Packaging
- 8.1. Market Analysis, Insights and Forecast - by Material
- 9. South America Packaging Foams Industry Analysis, Insights and Forecast, 2019-2031
- 9.1. Market Analysis, Insights and Forecast - by Material
- 9.1.1. Polystyrene
- 9.1.2. Polyurethane
- 9.1.3. Polyolefin
- 9.1.4. Other Materials
- 9.2. Market Analysis, Insights and Forecast - by Structure
- 9.2.1. Flexible
- 9.2.2. Rigid
- 9.3. Market Analysis, Insights and Forecast - by Application
- 9.3.1. Food Packaging
- 9.3.2. Industrial Packaging
- 9.3.2.1. Transportation
- 9.3.2.2. Electrical and Electronics
- 9.3.2.3. Personal Care
- 9.3.2.4. Pharmaceutical
- 9.3.2.5. Other Industrial Packaging
- 9.1. Market Analysis, Insights and Forecast - by Material
- 10. Middle East Packaging Foams Industry Analysis, Insights and Forecast, 2019-2031
- 10.1. Market Analysis, Insights and Forecast - by Material
- 10.1.1. Polystyrene
- 10.1.2. Polyurethane
- 10.1.3. Polyolefin
- 10.1.4. Other Materials
- 10.2. Market Analysis, Insights and Forecast - by Structure
- 10.2.1. Flexible
- 10.2.2. Rigid
- 10.3. Market Analysis, Insights and Forecast - by Application
- 10.3.1. Food Packaging
- 10.3.2. Industrial Packaging
- 10.3.2.1. Transportation
- 10.3.2.2. Electrical and Electronics
- 10.3.2.3. Personal Care
- 10.3.2.4. Pharmaceutical
- 10.3.2.5. Other Industrial Packaging
- 10.1. Market Analysis, Insights and Forecast - by Material
- 11. Saudi Arabia Packaging Foams Industry Analysis, Insights and Forecast, 2019-2031
- 11.1. Market Analysis, Insights and Forecast - by Material
- 11.1.1. Polystyrene
- 11.1.2. Polyurethane
- 11.1.3. Polyolefin
- 11.1.4. Other Materials
- 11.2. Market Analysis, Insights and Forecast - by Structure
- 11.2.1. Flexible
- 11.2.2. Rigid
- 11.3. Market Analysis, Insights and Forecast - by Application
- 11.3.1. Food Packaging
- 11.3.2. Industrial Packaging
- 11.3.2.1. Transportation
- 11.3.2.2. Electrical and Electronics
- 11.3.2.3. Personal Care
- 11.3.2.4. Pharmaceutical
- 11.3.2.5. Other Industrial Packaging
- 11.1. Market Analysis, Insights and Forecast - by Material
- 12. North America Packaging Foams Industry Analysis, Insights and Forecast, 2019-2031
- 12.1. Market Analysis, Insights and Forecast - By Country/Sub-region
- 12.1.1 United States
- 12.1.2 Canada
- 12.1.3 Mexico
- 13. Europe Packaging Foams Industry Analysis, Insights and Forecast, 2019-2031
- 13.1. Market Analysis, Insights and Forecast - By Country/Sub-region
- 13.1.1 Germany
- 13.1.2 France
- 13.1.3 Italy
- 13.1.4 United Kingdom
- 13.1.5 Netherlands
- 13.1.6 Rest of Europe
- 14. Asia Pacific Packaging Foams Industry Analysis, Insights and Forecast, 2019-2031
- 14.1. Market Analysis, Insights and Forecast - By Country/Sub-region
- 14.1.1 China
- 14.1.2 Japan
- 14.1.3 India
- 14.1.4 South Korea
- 14.1.5 Taiwan
- 14.1.6 Australia
- 14.1.7 Rest of Asia-Pacific
- 15. South America Packaging Foams Industry Analysis, Insights and Forecast, 2019-2031
- 15.1. Market Analysis, Insights and Forecast - By Country/Sub-region
- 15.1.1 Brazil
- 15.1.2 Argentina
- 15.1.3 Rest of South America
- 16. MEA Packaging Foams Industry Analysis, Insights and Forecast, 2019-2031
- 16.1. Market Analysis, Insights and Forecast - By Country/Sub-region
- 16.1.1 Middle East
- 16.1.2 Africa
- 17. Competitive Analysis
- 17.1. Global Market Share Analysis 2024
- 17.2. Company Profiles
- 17.2.1 Recticel
- 17.2.1.1. Overview
- 17.2.1.2. Products
- 17.2.1.3. SWOT Analysis
- 17.2.1.4. Recent Developments
- 17.2.1.5. Financials (Based on Availability)
- 17.2.2 Drew Foam
- 17.2.2.1. Overview
- 17.2.2.2. Products
- 17.2.2.3. SWOT Analysis
- 17.2.2.4. Recent Developments
- 17.2.2.5. Financials (Based on Availability)
- 17.2.3 Williams Foam
- 17.2.3.1. Overview
- 17.2.3.2. Products
- 17.2.3.3. SWOT Analysis
- 17.2.3.4. Recent Developments
- 17.2.3.5. Financials (Based on Availability)
- 17.2.4 Armacell
- 17.2.4.1. Overview
- 17.2.4.2. Products
- 17.2.4.3. SWOT Analysis
- 17.2.4.4. Recent Developments
- 17.2.4.5. Financials (Based on Availability)
- 17.2.5 TotalEnergies
- 17.2.5.1. Overview
- 17.2.5.2. Products
- 17.2.5.3. SWOT Analysis
- 17.2.5.4. Recent Developments
- 17.2.5.5. Financials (Based on Availability)
- 17.2.6 Huntington Solutions
- 17.2.6.1. Overview
- 17.2.6.2. Products
- 17.2.6.3. SWOT Analysis
- 17.2.6.4. Recent Developments
- 17.2.6.5. Financials (Based on Availability)
- 17.2.7 Atlas Roofing Corporation
- 17.2.7.1. Overview
- 17.2.7.2. Products
- 17.2.7.3. SWOT Analysis
- 17.2.7.4. Recent Developments
- 17.2.7.5. Financials (Based on Availability)
- 17.2.8 Borealis AG
- 17.2.8.1. Overview
- 17.2.8.2. Products
- 17.2.8.3. SWOT Analysis
- 17.2.8.4. Recent Developments
- 17.2.8.5. Financials (Based on Availability)
- 17.2.9 Zotefoams PLC
- 17.2.9.1. Overview
- 17.2.9.2. Products
- 17.2.9.3. SWOT Analysis
- 17.2.9.4. Recent Developments
- 17.2.9.5. Financials (Based on Availability)
- 17.2.10 Sealed Air
- 17.2.10.1. Overview
- 17.2.10.2. Products
- 17.2.10.3. SWOT Analysis
- 17.2.10.4. Recent Developments
- 17.2.10.5. Financials (Based on Availability)
- 17.2.11 Foamcraft Inc
- 17.2.11.1. Overview
- 17.2.11.2. Products
- 17.2.11.3. SWOT Analysis
- 17.2.11.4. Recent Developments
- 17.2.11.5. Financials (Based on Availability)
- 17.2.1 Recticel
List of Figures
- Figure 1: Global Packaging Foams Industry Revenue Breakdown (Million, %) by Region 2024 & 2032
- Figure 2: Global Packaging Foams Industry Volume Breakdown (K Tons, %) by Region 2024 & 2032
- Figure 3: North America Packaging Foams Industry Revenue (Million), by Country 2024 & 2032
- Figure 4: North America Packaging Foams Industry Volume (K Tons), by Country 2024 & 2032
- Figure 5: North America Packaging Foams Industry Revenue Share (%), by Country 2024 & 2032
- Figure 6: North America Packaging Foams Industry Volume Share (%), by Country 2024 & 2032
- Figure 7: Europe Packaging Foams Industry Revenue (Million), by Country 2024 & 2032
- Figure 8: Europe Packaging Foams Industry Volume (K Tons), by Country 2024 & 2032
- Figure 9: Europe Packaging Foams Industry Revenue Share (%), by Country 2024 & 2032
- Figure 10: Europe Packaging Foams Industry Volume Share (%), by Country 2024 & 2032
- Figure 11: Asia Pacific Packaging Foams Industry Revenue (Million), by Country 2024 & 2032
- Figure 12: Asia Pacific Packaging Foams Industry Volume (K Tons), by Country 2024 & 2032
- Figure 13: Asia Pacific Packaging Foams Industry Revenue Share (%), by Country 2024 & 2032
- Figure 14: Asia Pacific Packaging Foams Industry Volume Share (%), by Country 2024 & 2032
- Figure 15: South America Packaging Foams Industry Revenue (Million), by Country 2024 & 2032
- Figure 16: South America Packaging Foams Industry Volume (K Tons), by Country 2024 & 2032
- Figure 17: South America Packaging Foams Industry Revenue Share (%), by Country 2024 & 2032
- Figure 18: South America Packaging Foams Industry Volume Share (%), by Country 2024 & 2032
- Figure 19: MEA Packaging Foams Industry Revenue (Million), by Country 2024 & 2032
- Figure 20: MEA Packaging Foams Industry Volume (K Tons), by Country 2024 & 2032
- Figure 21: MEA Packaging Foams Industry Revenue Share (%), by Country 2024 & 2032
- Figure 22: MEA Packaging Foams Industry Volume Share (%), by Country 2024 & 2032
- Figure 23: Asia Pacific Packaging Foams Industry Revenue (Million), by Material 2024 & 2032
- Figure 24: Asia Pacific Packaging Foams Industry Volume (K Tons), by Material 2024 & 2032
- Figure 25: Asia Pacific Packaging Foams Industry Revenue Share (%), by Material 2024 & 2032
- Figure 26: Asia Pacific Packaging Foams Industry Volume Share (%), by Material 2024 & 2032
- Figure 27: Asia Pacific Packaging Foams Industry Revenue (Million), by Structure 2024 & 2032
- Figure 28: Asia Pacific Packaging Foams Industry Volume (K Tons), by Structure 2024 & 2032
- Figure 29: Asia Pacific Packaging Foams Industry Revenue Share (%), by Structure 2024 & 2032
- Figure 30: Asia Pacific Packaging Foams Industry Volume Share (%), by Structure 2024 & 2032
- Figure 31: Asia Pacific Packaging Foams Industry Revenue (Million), by Application 2024 & 2032
- Figure 32: Asia Pacific Packaging Foams Industry Volume (K Tons), by Application 2024 & 2032
- Figure 33: Asia Pacific Packaging Foams Industry Revenue Share (%), by Application 2024 & 2032
- Figure 34: Asia Pacific Packaging Foams Industry Volume Share (%), by Application 2024 & 2032
- Figure 35: Asia Pacific Packaging Foams Industry Revenue (Million), by Country 2024 & 2032
- Figure 36: Asia Pacific Packaging Foams Industry Volume (K Tons), by Country 2024 & 2032
- Figure 37: Asia Pacific Packaging Foams Industry Revenue Share (%), by Country 2024 & 2032
- Figure 38: Asia Pacific Packaging Foams Industry Volume Share (%), by Country 2024 & 2032
- Figure 39: North America Packaging Foams Industry Revenue (Million), by Material 2024 & 2032
- Figure 40: North America Packaging Foams Industry Volume (K Tons), by Material 2024 & 2032
- Figure 41: North America Packaging Foams Industry Revenue Share (%), by Material 2024 & 2032
- Figure 42: North America Packaging Foams Industry Volume Share (%), by Material 2024 & 2032
- Figure 43: North America Packaging Foams Industry Revenue (Million), by Structure 2024 & 2032
- Figure 44: North America Packaging Foams Industry Volume (K Tons), by Structure 2024 & 2032
- Figure 45: North America Packaging Foams Industry Revenue Share (%), by Structure 2024 & 2032
- Figure 46: North America Packaging Foams Industry Volume Share (%), by Structure 2024 & 2032
- Figure 47: North America Packaging Foams Industry Revenue (Million), by Application 2024 & 2032
- Figure 48: North America Packaging Foams Industry Volume (K Tons), by Application 2024 & 2032
- Figure 49: North America Packaging Foams Industry Revenue Share (%), by Application 2024 & 2032
- Figure 50: North America Packaging Foams Industry Volume Share (%), by Application 2024 & 2032
- Figure 51: North America Packaging Foams Industry Revenue (Million), by Country 2024 & 2032
- Figure 52: North America Packaging Foams Industry Volume (K Tons), by Country 2024 & 2032
- Figure 53: North America Packaging Foams Industry Revenue Share (%), by Country 2024 & 2032
- Figure 54: North America Packaging Foams Industry Volume Share (%), by Country 2024 & 2032
- Figure 55: Europe Packaging Foams Industry Revenue (Million), by Material 2024 & 2032
- Figure 56: Europe Packaging Foams Industry Volume (K Tons), by Material 2024 & 2032
- Figure 57: Europe Packaging Foams Industry Revenue Share (%), by Material 2024 & 2032
- Figure 58: Europe Packaging Foams Industry Volume Share (%), by Material 2024 & 2032
- Figure 59: Europe Packaging Foams Industry Revenue (Million), by Structure 2024 & 2032
- Figure 60: Europe Packaging Foams Industry Volume (K Tons), by Structure 2024 & 2032
- Figure 61: Europe Packaging Foams Industry Revenue Share (%), by Structure 2024 & 2032
- Figure 62: Europe Packaging Foams Industry Volume Share (%), by Structure 2024 & 2032
- Figure 63: Europe Packaging Foams Industry Revenue (Million), by Application 2024 & 2032
- Figure 64: Europe Packaging Foams Industry Volume (K Tons), by Application 2024 & 2032
- Figure 65: Europe Packaging Foams Industry Revenue Share (%), by Application 2024 & 2032
- Figure 66: Europe Packaging Foams Industry Volume Share (%), by Application 2024 & 2032
- Figure 67: Europe Packaging Foams Industry Revenue (Million), by Country 2024 & 2032
- Figure 68: Europe Packaging Foams Industry Volume (K Tons), by Country 2024 & 2032
- Figure 69: Europe Packaging Foams Industry Revenue Share (%), by Country 2024 & 2032
- Figure 70: Europe Packaging Foams Industry Volume Share (%), by Country 2024 & 2032
- Figure 71: South America Packaging Foams Industry Revenue (Million), by Material 2024 & 2032
- Figure 72: South America Packaging Foams Industry Volume (K Tons), by Material 2024 & 2032
- Figure 73: South America Packaging Foams Industry Revenue Share (%), by Material 2024 & 2032
- Figure 74: South America Packaging Foams Industry Volume Share (%), by Material 2024 & 2032
- Figure 75: South America Packaging Foams Industry Revenue (Million), by Structure 2024 & 2032
- Figure 76: South America Packaging Foams Industry Volume (K Tons), by Structure 2024 & 2032
- Figure 77: South America Packaging Foams Industry Revenue Share (%), by Structure 2024 & 2032
- Figure 78: South America Packaging Foams Industry Volume Share (%), by Structure 2024 & 2032
- Figure 79: South America Packaging Foams Industry Revenue (Million), by Application 2024 & 2032
- Figure 80: South America Packaging Foams Industry Volume (K Tons), by Application 2024 & 2032
- Figure 81: South America Packaging Foams Industry Revenue Share (%), by Application 2024 & 2032
- Figure 82: South America Packaging Foams Industry Volume Share (%), by Application 2024 & 2032
- Figure 83: South America Packaging Foams Industry Revenue (Million), by Country 2024 & 2032
- Figure 84: South America Packaging Foams Industry Volume (K Tons), by Country 2024 & 2032
- Figure 85: South America Packaging Foams Industry Revenue Share (%), by Country 2024 & 2032
- Figure 86: South America Packaging Foams Industry Volume Share (%), by Country 2024 & 2032
- Figure 87: Middle East Packaging Foams Industry Revenue (Million), by Material 2024 & 2032
- Figure 88: Middle East Packaging Foams Industry Volume (K Tons), by Material 2024 & 2032
- Figure 89: Middle East Packaging Foams Industry Revenue Share (%), by Material 2024 & 2032
- Figure 90: Middle East Packaging Foams Industry Volume Share (%), by Material 2024 & 2032
- Figure 91: Middle East Packaging Foams Industry Revenue (Million), by Structure 2024 & 2032
- Figure 92: Middle East Packaging Foams Industry Volume (K Tons), by Structure 2024 & 2032
- Figure 93: Middle East Packaging Foams Industry Revenue Share (%), by Structure 2024 & 2032
- Figure 94: Middle East Packaging Foams Industry Volume Share (%), by Structure 2024 & 2032
- Figure 95: Middle East Packaging Foams Industry Revenue (Million), by Application 2024 & 2032
- Figure 96: Middle East Packaging Foams Industry Volume (K Tons), by Application 2024 & 2032
- Figure 97: Middle East Packaging Foams Industry Revenue Share (%), by Application 2024 & 2032
- Figure 98: Middle East Packaging Foams Industry Volume Share (%), by Application 2024 & 2032
- Figure 99: Middle East Packaging Foams Industry Revenue (Million), by Country 2024 & 2032
- Figure 100: Middle East Packaging Foams Industry Volume (K Tons), by Country 2024 & 2032
- Figure 101: Middle East Packaging Foams Industry Revenue Share (%), by Country 2024 & 2032
- Figure 102: Middle East Packaging Foams Industry Volume Share (%), by Country 2024 & 2032
- Figure 103: Saudi Arabia Packaging Foams Industry Revenue (Million), by Material 2024 & 2032
- Figure 104: Saudi Arabia Packaging Foams Industry Volume (K Tons), by Material 2024 & 2032
- Figure 105: Saudi Arabia Packaging Foams Industry Revenue Share (%), by Material 2024 & 2032
- Figure 106: Saudi Arabia Packaging Foams Industry Volume Share (%), by Material 2024 & 2032
- Figure 107: Saudi Arabia Packaging Foams Industry Revenue (Million), by Structure 2024 & 2032
- Figure 108: Saudi Arabia Packaging Foams Industry Volume (K Tons), by Structure 2024 & 2032
- Figure 109: Saudi Arabia Packaging Foams Industry Revenue Share (%), by Structure 2024 & 2032
- Figure 110: Saudi Arabia Packaging Foams Industry Volume Share (%), by Structure 2024 & 2032
- Figure 111: Saudi Arabia Packaging Foams Industry Revenue (Million), by Application 2024 & 2032
- Figure 112: Saudi Arabia Packaging Foams Industry Volume (K Tons), by Application 2024 & 2032
- Figure 113: Saudi Arabia Packaging Foams Industry Revenue Share (%), by Application 2024 & 2032
- Figure 114: Saudi Arabia Packaging Foams Industry Volume Share (%), by Application 2024 & 2032
- Figure 115: Saudi Arabia Packaging Foams Industry Revenue (Million), by Country 2024 & 2032
- Figure 116: Saudi Arabia Packaging Foams Industry Volume (K Tons), by Country 2024 & 2032
- Figure 117: Saudi Arabia Packaging Foams Industry Revenue Share (%), by Country 2024 & 2032
- Figure 118: Saudi Arabia Packaging Foams Industry Volume Share (%), by Country 2024 & 2032
List of Tables
- Table 1: Global Packaging Foams Industry Revenue Million Forecast, by Region 2019 & 2032
- Table 2: Global Packaging Foams Industry Volume K Tons Forecast, by Region 2019 & 2032
- Table 3: Global Packaging Foams Industry Revenue Million Forecast, by Material 2019 & 2032
- Table 4: Global Packaging Foams Industry Volume K Tons Forecast, by Material 2019 & 2032
- Table 5: Global Packaging Foams Industry Revenue Million Forecast, by Structure 2019 & 2032
- Table 6: Global Packaging Foams Industry Volume K Tons Forecast, by Structure 2019 & 2032
- Table 7: Global Packaging Foams Industry Revenue Million Forecast, by Application 2019 & 2032
- Table 8: Global Packaging Foams Industry Volume K Tons Forecast, by Application 2019 & 2032
- Table 9: Global Packaging Foams Industry Revenue Million Forecast, by Region 2019 & 2032
- Table 10: Global Packaging Foams Industry Volume K Tons Forecast, by Region 2019 & 2032
- Table 11: Global Packaging Foams Industry Revenue Million Forecast, by Country 2019 & 2032
- Table 12: Global Packaging Foams Industry Volume K Tons Forecast, by Country 2019 & 2032
- Table 13: United States Packaging Foams Industry Revenue (Million) Forecast, by Application 2019 & 2032
- Table 14: United States Packaging Foams Industry Volume (K Tons) Forecast, by Application 2019 & 2032
- Table 15: Canada Packaging Foams Industry Revenue (Million) Forecast, by Application 2019 & 2032
- Table 16: Canada Packaging Foams Industry Volume (K Tons) Forecast, by Application 2019 & 2032
- Table 17: Mexico Packaging Foams Industry Revenue (Million) Forecast, by Application 2019 & 2032
- Table 18: Mexico Packaging Foams Industry Volume (K Tons) Forecast, by Application 2019 & 2032
- Table 19: Global Packaging Foams Industry Revenue Million Forecast, by Country 2019 & 2032
- Table 20: Global Packaging Foams Industry Volume K Tons Forecast, by Country 2019 & 2032
- Table 21: Germany Packaging Foams Industry Revenue (Million) Forecast, by Application 2019 & 2032
- Table 22: Germany Packaging Foams Industry Volume (K Tons) Forecast, by Application 2019 & 2032
- Table 23: France Packaging Foams Industry Revenue (Million) Forecast, by Application 2019 & 2032
- Table 24: France Packaging Foams Industry Volume (K Tons) Forecast, by Application 2019 & 2032
- Table 25: Italy Packaging Foams Industry Revenue (Million) Forecast, by Application 2019 & 2032
- Table 26: Italy Packaging Foams Industry Volume (K Tons) Forecast, by Application 2019 & 2032
- Table 27: United Kingdom Packaging Foams Industry Revenue (Million) Forecast, by Application 2019 & 2032
- Table 28: United Kingdom Packaging Foams Industry Volume (K Tons) Forecast, by Application 2019 & 2032
- Table 29: Netherlands Packaging Foams Industry Revenue (Million) Forecast, by Application 2019 & 2032
- Table 30: Netherlands Packaging Foams Industry Volume (K Tons) Forecast, by Application 2019 & 2032
- Table 31: Rest of Europe Packaging Foams Industry Revenue (Million) Forecast, by Application 2019 & 2032
- Table 32: Rest of Europe Packaging Foams Industry Volume (K Tons) Forecast, by Application 2019 & 2032
- Table 33: Global Packaging Foams Industry Revenue Million Forecast, by Country 2019 & 2032
- Table 34: Global Packaging Foams Industry Volume K Tons Forecast, by Country 2019 & 2032
- Table 35: China Packaging Foams Industry Revenue (Million) Forecast, by Application 2019 & 2032
- Table 36: China Packaging Foams Industry Volume (K Tons) Forecast, by Application 2019 & 2032
- Table 37: Japan Packaging Foams Industry Revenue (Million) Forecast, by Application 2019 & 2032
- Table 38: Japan Packaging Foams Industry Volume (K Tons) Forecast, by Application 2019 & 2032
- Table 39: India Packaging Foams Industry Revenue (Million) Forecast, by Application 2019 & 2032
- Table 40: India Packaging Foams Industry Volume (K Tons) Forecast, by Application 2019 & 2032
- Table 41: South Korea Packaging Foams Industry Revenue (Million) Forecast, by Application 2019 & 2032
- Table 42: South Korea Packaging Foams Industry Volume (K Tons) Forecast, by Application 2019 & 2032
- Table 43: Taiwan Packaging Foams Industry Revenue (Million) Forecast, by Application 2019 & 2032
- Table 44: Taiwan Packaging Foams Industry Volume (K Tons) Forecast, by Application 2019 & 2032
- Table 45: Australia Packaging Foams Industry Revenue (Million) Forecast, by Application 2019 & 2032
- Table 46: Australia Packaging Foams Industry Volume (K Tons) Forecast, by Application 2019 & 2032
- Table 47: Rest of Asia-Pacific Packaging Foams Industry Revenue (Million) Forecast, by Application 2019 & 2032
- Table 48: Rest of Asia-Pacific Packaging Foams Industry Volume (K Tons) Forecast, by Application 2019 & 2032
- Table 49: Global Packaging Foams Industry Revenue Million Forecast, by Country 2019 & 2032
- Table 50: Global Packaging Foams Industry Volume K Tons Forecast, by Country 2019 & 2032
- Table 51: Brazil Packaging Foams Industry Revenue (Million) Forecast, by Application 2019 & 2032
- Table 52: Brazil Packaging Foams Industry Volume (K Tons) Forecast, by Application 2019 & 2032
- Table 53: Argentina Packaging Foams Industry Revenue (Million) Forecast, by Application 2019 & 2032
- Table 54: Argentina Packaging Foams Industry Volume (K Tons) Forecast, by Application 2019 & 2032
- Table 55: Rest of South America Packaging Foams Industry Revenue (Million) Forecast, by Application 2019 & 2032
- Table 56: Rest of South America Packaging Foams Industry Volume (K Tons) Forecast, by Application 2019 & 2032
- Table 57: Global Packaging Foams Industry Revenue Million Forecast, by Country 2019 & 2032
- Table 58: Global Packaging Foams Industry Volume K Tons Forecast, by Country 2019 & 2032
- Table 59: Middle East Packaging Foams Industry Revenue (Million) Forecast, by Application 2019 & 2032
- Table 60: Middle East Packaging Foams Industry Volume (K Tons) Forecast, by Application 2019 & 2032
- Table 61: Africa Packaging Foams Industry Revenue (Million) Forecast, by Application 2019 & 2032
- Table 62: Africa Packaging Foams Industry Volume (K Tons) Forecast, by Application 2019 & 2032
- Table 63: Global Packaging Foams Industry Revenue Million Forecast, by Material 2019 & 2032
- Table 64: Global Packaging Foams Industry Volume K Tons Forecast, by Material 2019 & 2032
- Table 65: Global Packaging Foams Industry Revenue Million Forecast, by Structure 2019 & 2032
- Table 66: Global Packaging Foams Industry Volume K Tons Forecast, by Structure 2019 & 2032
- Table 67: Global Packaging Foams Industry Revenue Million Forecast, by Application 2019 & 2032
- Table 68: Global Packaging Foams Industry Volume K Tons Forecast, by Application 2019 & 2032
- Table 69: Global Packaging Foams Industry Revenue Million Forecast, by Country 2019 & 2032
- Table 70: Global Packaging Foams Industry Volume K Tons Forecast, by Country 2019 & 2032
- Table 71: China Packaging Foams Industry Revenue (Million) Forecast, by Application 2019 & 2032
- Table 72: China Packaging Foams Industry Volume (K Tons) Forecast, by Application 2019 & 2032
- Table 73: India Packaging Foams Industry Revenue (Million) Forecast, by Application 2019 & 2032
- Table 74: India Packaging Foams Industry Volume (K Tons) Forecast, by Application 2019 & 2032
- Table 75: Japan Packaging Foams Industry Revenue (Million) Forecast, by Application 2019 & 2032
- Table 76: Japan Packaging Foams Industry Volume (K Tons) Forecast, by Application 2019 & 2032
- Table 77: South Korea Packaging Foams Industry Revenue (Million) Forecast, by Application 2019 & 2032
- Table 78: South Korea Packaging Foams Industry Volume (K Tons) Forecast, by Application 2019 & 2032
- Table 79: Rest of Asia Pacific Packaging Foams Industry Revenue (Million) Forecast, by Application 2019 & 2032
- Table 80: Rest of Asia Pacific Packaging Foams Industry Volume (K Tons) Forecast, by Application 2019 & 2032
- Table 81: Global Packaging Foams Industry Revenue Million Forecast, by Material 2019 & 2032
- Table 82: Global Packaging Foams Industry Volume K Tons Forecast, by Material 2019 & 2032
- Table 83: Global Packaging Foams Industry Revenue Million Forecast, by Structure 2019 & 2032
- Table 84: Global Packaging Foams Industry Volume K Tons Forecast, by Structure 2019 & 2032
- Table 85: Global Packaging Foams Industry Revenue Million Forecast, by Application 2019 & 2032
- Table 86: Global Packaging Foams Industry Volume K Tons Forecast, by Application 2019 & 2032
- Table 87: Global Packaging Foams Industry Revenue Million Forecast, by Country 2019 & 2032
- Table 88: Global Packaging Foams Industry Volume K Tons Forecast, by Country 2019 & 2032
- Table 89: United States Packaging Foams Industry Revenue (Million) Forecast, by Application 2019 & 2032
- Table 90: United States Packaging Foams Industry Volume (K Tons) Forecast, by Application 2019 & 2032
- Table 91: Canada Packaging Foams Industry Revenue (Million) Forecast, by Application 2019 & 2032
- Table 92: Canada Packaging Foams Industry Volume (K Tons) Forecast, by Application 2019 & 2032
- Table 93: Mexico Packaging Foams Industry Revenue (Million) Forecast, by Application 2019 & 2032
- Table 94: Mexico Packaging Foams Industry Volume (K Tons) Forecast, by Application 2019 & 2032
- Table 95: Global Packaging Foams Industry Revenue Million Forecast, by Material 2019 & 2032
- Table 96: Global Packaging Foams Industry Volume K Tons Forecast, by Material 2019 & 2032
- Table 97: Global Packaging Foams Industry Revenue Million Forecast, by Structure 2019 & 2032
- Table 98: Global Packaging Foams Industry Volume K Tons Forecast, by Structure 2019 & 2032
- Table 99: Global Packaging Foams Industry Revenue Million Forecast, by Application 2019 & 2032
- Table 100: Global Packaging Foams Industry Volume K Tons Forecast, by Application 2019 & 2032
- Table 101: Global Packaging Foams Industry Revenue Million Forecast, by Country 2019 & 2032
- Table 102: Global Packaging Foams Industry Volume K Tons Forecast, by Country 2019 & 2032
- Table 103: Germany Packaging Foams Industry Revenue (Million) Forecast, by Application 2019 & 2032
- Table 104: Germany Packaging Foams Industry Volume (K Tons) Forecast, by Application 2019 & 2032
- Table 105: United Kingdom Packaging Foams Industry Revenue (Million) Forecast, by Application 2019 & 2032
- Table 106: United Kingdom Packaging Foams Industry Volume (K Tons) Forecast, by Application 2019 & 2032
- Table 107: Italy Packaging Foams Industry Revenue (Million) Forecast, by Application 2019 & 2032
- Table 108: Italy Packaging Foams Industry Volume (K Tons) Forecast, by Application 2019 & 2032
- Table 109: France Packaging Foams Industry Revenue (Million) Forecast, by Application 2019 & 2032
- Table 110: France Packaging Foams Industry Volume (K Tons) Forecast, by Application 2019 & 2032
- Table 111: Rest of Europe Packaging Foams Industry Revenue (Million) Forecast, by Application 2019 & 2032
- Table 112: Rest of Europe Packaging Foams Industry Volume (K Tons) Forecast, by Application 2019 & 2032
- Table 113: Global Packaging Foams Industry Revenue Million Forecast, by Material 2019 & 2032
- Table 114: Global Packaging Foams Industry Volume K Tons Forecast, by Material 2019 & 2032
- Table 115: Global Packaging Foams Industry Revenue Million Forecast, by Structure 2019 & 2032
- Table 116: Global Packaging Foams Industry Volume K Tons Forecast, by Structure 2019 & 2032
- Table 117: Global Packaging Foams Industry Revenue Million Forecast, by Application 2019 & 2032
- Table 118: Global Packaging Foams Industry Volume K Tons Forecast, by Application 2019 & 2032
- Table 119: Global Packaging Foams Industry Revenue Million Forecast, by Country 2019 & 2032
- Table 120: Global Packaging Foams Industry Volume K Tons Forecast, by Country 2019 & 2032
- Table 121: Brazil Packaging Foams Industry Revenue (Million) Forecast, by Application 2019 & 2032
- Table 122: Brazil Packaging Foams Industry Volume (K Tons) Forecast, by Application 2019 & 2032
- Table 123: Argentina Packaging Foams Industry Revenue (Million) Forecast, by Application 2019 & 2032
- Table 124: Argentina Packaging Foams Industry Volume (K Tons) Forecast, by Application 2019 & 2032
- Table 125: Rest of South America Packaging Foams Industry Revenue (Million) Forecast, by Application 2019 & 2032
- Table 126: Rest of South America Packaging Foams Industry Volume (K Tons) Forecast, by Application 2019 & 2032
- Table 127: Global Packaging Foams Industry Revenue Million Forecast, by Material 2019 & 2032
- Table 128: Global Packaging Foams Industry Volume K Tons Forecast, by Material 2019 & 2032
- Table 129: Global Packaging Foams Industry Revenue Million Forecast, by Structure 2019 & 2032
- Table 130: Global Packaging Foams Industry Volume K Tons Forecast, by Structure 2019 & 2032
- Table 131: Global Packaging Foams Industry Revenue Million Forecast, by Application 2019 & 2032
- Table 132: Global Packaging Foams Industry Volume K Tons Forecast, by Application 2019 & 2032
- Table 133: Global Packaging Foams Industry Revenue Million Forecast, by Country 2019 & 2032
- Table 134: Global Packaging Foams Industry Volume K Tons Forecast, by Country 2019 & 2032
- Table 135: Global Packaging Foams Industry Revenue Million Forecast, by Material 2019 & 2032
- Table 136: Global Packaging Foams Industry Volume K Tons Forecast, by Material 2019 & 2032
- Table 137: Global Packaging Foams Industry Revenue Million Forecast, by Structure 2019 & 2032
- Table 138: Global Packaging Foams Industry Volume K Tons Forecast, by Structure 2019 & 2032
- Table 139: Global Packaging Foams Industry Revenue Million Forecast, by Application 2019 & 2032
- Table 140: Global Packaging Foams Industry Volume K Tons Forecast, by Application 2019 & 2032
- Table 141: Global Packaging Foams Industry Revenue Million Forecast, by Country 2019 & 2032
- Table 142: Global Packaging Foams Industry Volume K Tons Forecast, by Country 2019 & 2032
- Table 143: South Africa Packaging Foams Industry Revenue (Million) Forecast, by Application 2019 & 2032
- Table 144: South Africa Packaging Foams Industry Volume (K Tons) Forecast, by Application 2019 & 2032
- Table 145: Rest of Middle East and Africa Packaging Foams Industry Revenue (Million) Forecast, by Application 2019 & 2032
- Table 146: Rest of Middle East and Africa Packaging Foams Industry Volume (K Tons) Forecast, by Application 2019 & 2032
Frequently Asked Questions
1. What is the projected Compound Annual Growth Rate (CAGR) of the Packaging Foams Industry?
The projected CAGR is approximately 4.68%.
2. Which companies are prominent players in the Packaging Foams Industry?
Key companies in the market include Recticel, Drew Foam, Williams Foam, Armacell, TotalEnergies, Huntington Solutions, Atlas Roofing Corporation, Borealis AG, Zotefoams PLC, Sealed Air, Foamcraft Inc.
3. What are the main segments of the Packaging Foams Industry?
The market segments include Material, Structure, Application.
4. Can you provide details about the market size?
The market size is estimated to be USD 11.67 Million as of 2022.
5. What are some drivers contributing to market growth?
Rising Demand from the Packaging Industry.
6. What are the notable trends driving market growth?
Increasing Demand from the Industrial Packaging Sector.
7. Are there any restraints impacting market growth?
Molded Pulp as a Green Alternative.
8. Can you provide examples of recent developments in the market?
In March 2021, Recticel announced that it successfully acquired FoamPartner, the Swiss-based global provider of high-added-value technical foams. Recticel Flexible Foams and FoamPartner are merged to form the Recticel Engineered Foams business line. The new organization will leverage numerous synergies in resources and talents to promote excellence, grow its global presence, and accelerate the commercialization of sustainable innovations and leading-edge solutions to global markets.
9. What pricing options are available for accessing the report?
Pricing options include single-user, multi-user, and enterprise licenses priced at USD 4750, USD 5250, and USD 8750 respectively.
10. Is the market size provided in terms of value or volume?
The market size is provided in terms of value, measured in Million and volume, measured in K Tons.
11. Are there any specific market keywords associated with the report?
Yes, the market keyword associated with the report is "Packaging Foams Industry," which aids in identifying and referencing the specific market segment covered.
12. How do I determine which pricing option suits my needs best?
The pricing options vary based on user requirements and access needs. Individual users may opt for single-user licenses, while businesses requiring broader access may choose multi-user or enterprise licenses for cost-effective access to the report.
13. Are there any additional resources or data provided in the Packaging Foams Industry report?
While the report offers comprehensive insights, it's advisable to review the specific contents or supplementary materials provided to ascertain if additional resources or data are available.
14. How can I stay updated on further developments or reports in the Packaging Foams Industry?
To stay informed about further developments, trends, and reports in the Packaging Foams Industry, consider subscribing to industry newsletters, following relevant companies and organizations, or regularly checking reputable industry news sources and publications.
Methodology
Step 1 - Identification of Relevant Samples Size from Population Database


Step 2 - Approaches for Defining Global Market Size (Value, Volume* & Price*)

Note*: In applicable scenarios
Step 3 - Data Sources
Primary Research
- Web Analytics
- Survey Reports
- Research Institute
- Latest Research Reports
- Opinion Leaders
Secondary Research
- Annual Reports
- White Paper
- Latest Press Release
- Industry Association
- Paid Database
- Investor Presentations

Step 4 - Data Triangulation
Involves using different sources of information in order to increase the validity of a study
These sources are likely to be stakeholders in a program - participants, other researchers, program staff, other community members, and so on.
Then we put all data in single framework & apply various statistical tools to find out the dynamic on the market.
During the analysis stage, feedback from the stakeholder groups would be compared to determine areas of agreement as well as areas of divergence


