
Key Insights
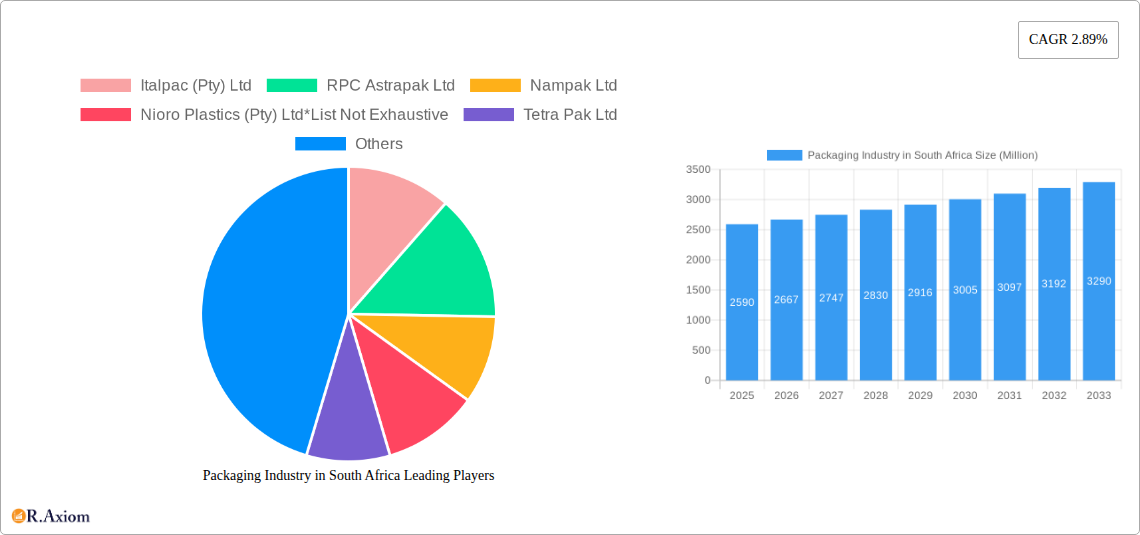
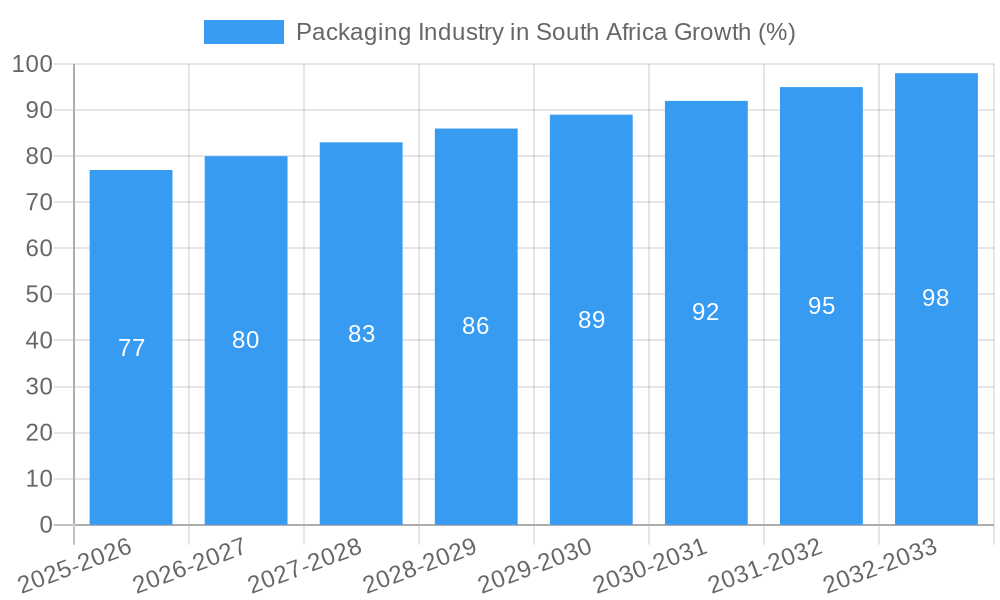
The South African packaging industry, valued at approximately $2.59 billion in 2025, is projected to experience steady growth, with a Compound Annual Growth Rate (CAGR) of 2.89% from 2025 to 2033. This growth is driven by several factors. The expanding food and beverage sector, fueled by population growth and increasing urbanization, necessitates a higher demand for packaging solutions. Furthermore, the healthcare and pharmaceuticals industries, particularly within South Africa's burgeoning pharmaceutical manufacturing capabilities, contribute significantly to market expansion. The increasing adoption of sustainable and eco-friendly packaging materials, such as recycled plastics and biodegradable alternatives, represents a prominent trend, driven by both consumer preference and stringent environmental regulations. However, challenges persist. Fluctuations in raw material prices, particularly petroleum-based plastics, pose a significant restraint on profitability. Furthermore, economic instability and potential infrastructure limitations may impact the industry's overall growth trajectory. The market is segmented across product types (bottles and jars, pouches, bags, films, etc.), plastic types (rigid and flexible), materials (PE, PP, PVC, PS, PET), and end-user industries. Leading players like Italpac, RPC Astrapak, Nampak, and Amcor hold significant market share, demonstrating a competitive landscape marked by both established players and emerging local businesses.
Significant opportunities exist for growth within specialized packaging segments, such as those designed for temperature-sensitive products or e-commerce applications. Innovation in packaging technology, focused on improved barrier properties, extended shelf life, and enhanced convenience, will also shape the future. The regional distribution within South Africa is likely uneven, with larger metropolitan areas exhibiting higher demand and potentially attracting more investment. The growth trajectory forecast will likely depend on several factors, including government policies promoting sustainable practices, investment in infrastructure, and economic stability. Understanding these dynamics is key for businesses operating within or seeking entry into this dynamic market.
Packaging Industry in South Africa: A Comprehensive Market Report (2019-2033)
This detailed report provides a comprehensive analysis of the South African packaging industry, covering market size, segmentation, key players, industry trends, and future growth prospects from 2019 to 2033. The study period spans from 2019-2024 (historical period), with 2025 serving as both the base year and estimated year. The forecast period covers 2025-2033, providing a long-term outlook for investors and industry stakeholders. The report uses the latest available data and incorporates expert insights to deliver actionable intelligence. Key segments analyzed include product type, plastic type, material, and end-user industry. Market values are expressed in millions.
Packaging Industry in South Africa Market Concentration & Innovation
The South African packaging industry exhibits a moderately concentrated market structure, with several large multinational and domestic players holding significant market share. Nampak Ltd, for example, commands a substantial portion of the market, followed by players like RPC Astrapak Ltd, Tetra Pak Ltd, and Mondi PLC. Smaller players, including Italpac (Pty) Ltd and Nioro Plastics (Pty) Ltd, cater to niche markets or regional demands. The exact market share for each company is unavailable (xx%) but competitive analysis shows a dynamic landscape with increasing M&A activity, primarily driven by consolidation and expansion strategies. Recent M&A deal values are not publicly available for all transactions (xx Million).
Innovation within the industry is primarily driven by:
- Sustainability: Growing consumer demand for eco-friendly packaging solutions is pushing innovation towards biodegradable, recyclable, and compostable materials.
- E-commerce Growth: The rise of e-commerce necessitates packaging solutions that ensure product safety during transit and enhance the unboxing experience.
- Technological Advancements: Advancements in materials science, automation, and printing technologies are leading to innovative packaging designs and improved efficiency.
Regulatory frameworks, such as the Extended Producer Responsibility (EPR) fee introduced in 2021, significantly influence innovation by incentivizing sustainable packaging practices. The substitution of traditional materials with more sustainable alternatives is an ongoing trend, driven both by regulatory pressure and changing consumer preferences.
Packaging Industry in South Africa Industry Trends & Insights
The South African packaging market is experiencing robust growth, driven by several factors. The CAGR for the forecast period (2025-2033) is projected to be xx%, fueled by factors like a growing population, rising disposable incomes, and increasing demand for packaged goods across various sectors. Market penetration of advanced packaging technologies is also increasing, reflecting a shift toward sophisticated solutions, including smart packaging. The country’s food and beverage sector acts as a major driver, given the prominence of processed foods and beverages in the consumer landscape.
Technological disruptions, including the adoption of automation and digital printing technologies, are streamlining production processes and enhancing efficiency. Consumer preferences are leaning toward sustainable packaging, driving demand for eco-friendly options and influencing packaging designs. The competitive dynamics are intensifying, with both established players and new entrants vying for market share through innovation, cost optimization, and strategic partnerships. The market penetration of sustainable packaging options is projected to increase significantly in the next decade reaching xx% by 2033.
Dominant Markets & Segments in Packaging Industry in South Africa
Dominant segments within the South African packaging market vary depending on the categorization:
- By Product Type: Bottles and jars, pouches, and bags maintain dominant market share, driven by their widespread use across various industries. Films and wraps are also significant, benefiting from the increased demand in food, retail, and e-commerce.
- By Type of Plastic: Flexible plastic packaging holds a larger market share than rigid plastic due to its versatility and cost-effectiveness in many applications.
- By Material: Polyethylene (PE) and polypropylene (PP) represent the most commonly used materials due to their properties and cost-effectiveness. PET is also significant, mainly in beverage packaging.
- By End-User Industry: The food and beverage industry remains the largest consumer of packaging solutions in South Africa, followed by the healthcare and personal care sectors.
Key drivers contributing to segment dominance include economic policies that support local manufacturing, the robust growth of the retail sector, and the evolving consumer preferences favoring convenience and hygiene.
Packaging Industry in South Africa Product Developments
Recent product innovations focus on sustainable materials, enhanced functionality, and improved aesthetics. The incorporation of biodegradable materials and compostable options is prominent. Smart packaging technologies with features like tamper evidence and integrated sensors are gaining traction, enhancing product security and consumer experience. The market is seeing the increased use of flexible packaging solutions designed to optimize transportation and storage costs. These advancements address consumer demands for eco-friendly packaging, product safety, and brand differentiation.
Report Scope & Segmentation Analysis
This report segments the South African packaging market comprehensively:
By Product Type: Bottles & Jars, Pouches, Bags, Films & Wraps, Other Product Types (each with projected growth rates and market sizes in Million).
By Type of Plastic: Rigid, Flexible (each with projected growth rates and market sizes in Million, Competitive landscape analysis for each segment is included).
By Material: PE, PP, PVC, PS, PET, Other Materials (each with projected growth rates and market sizes in Million, detailing market share and competitive dynamics).
By End-User Industry: Food, Beverages, Healthcare & Pharmaceuticals, Personal & Homecare, Other End-user Industries (each with projected growth rates and market sizes in Million). Each segment includes its specific competitive analysis
Key Drivers of Packaging Industry in South Africa Growth
Several factors drive the growth of the South African packaging industry:
- Growing Population and Economy: The expanding population and rising disposable incomes fuel demand for packaged goods.
- Increased Consumption of Processed Foods and Beverages: A shift towards convenient, processed products boosts demand for packaging solutions.
- Technological Advancements: Automation, improved materials, and innovative packaging designs improve efficiency and product appeal.
- Government Initiatives Promoting a Circular Economy: Policies supporting recycling and sustainable packaging practices create positive momentum.
Challenges in the Packaging Industry in South Africa Sector
The South African packaging industry faces challenges:
- Fluctuating Raw Material Prices: Dependence on imported materials leads to price volatility impacting production costs.
- Stringent Environmental Regulations: Compliance with sustainability standards requires investment and adaptation.
- Intense Competition: The market's competitive nature pressures profit margins and demands continuous innovation. These challenges affect all segments of the industry, though their impact varies based on the specific material and packaging type. The quantifiable impact on profitability is difficult to estimate without granular company data, however, it is estimated to decrease profit margins by an average of xx% across the industry.
Emerging Opportunities in Packaging Industry in South Africa
Opportunities lie in:
- Sustainable Packaging Solutions: Growing consumer demand for eco-friendly options opens market potential.
- E-commerce Packaging: The rise of online retail creates demand for specialized packaging solutions for safe shipping.
- Innovation in Materials Science: Development of novel materials with improved properties expands possibilities.
- Automation and Digitization: Implementing efficient technologies optimizes production and reduces costs. These opportunities hold significant potential for market expansion and increased profitability.
Leading Players in the Packaging Industry in South Africa Market
- Italpac (Pty) Ltd
- RPC Astrapak Ltd
- Nampak Ltd
- Nioro Plastics (Pty) Ltd
- Tetra Pak Ltd
- Mondi PLC
- Mpact Ltd
- Amcor Limited
- Sealed Air Corporation
- Constantia Flexibles Corporation
Key Developments in Packaging Industry in South Africa Industry
- May 2021: Introduction of the Extended Producer Responsibility (EPR) fee, impacting cost structures and incentivizing sustainable practices.
- January 2020: Launch of the South African Plastics Pact, promoting a circular economy for plastics through collaboration between businesses, government, and NGOs. This development fundamentally reshapes the industry's sustainability efforts and drives innovation towards recyclable and reusable packaging options.
Strategic Outlook for Packaging Industry in South Africa Market
The South African packaging industry's future is bright, driven by sustained economic growth, a rising population, and a growing focus on sustainability. The increasing demand for convenient, safe, and environmentally friendly packaging solutions presents significant growth opportunities. Innovation in materials, automation, and design will be key to success in this dynamic market. The industry's ability to adapt to evolving consumer preferences and regulatory changes will determine its long-term success. The market is set for substantial expansion in the next decade, with significant gains expected in sustainable packaging segments.
Packaging Industry in South Africa Segmentation
-
1. Product Type
- 1.1. Bottles and Jars
- 1.2. Pouches
- 1.3. Bags
- 1.4. Films and Wraps
- 1.5. Other Product Types
-
2. Type of Plastic
- 2.1. Rigid
- 2.2. Flexible
-
3. Material
- 3.1. Polyethylene (PE)
- 3.2. Polypropylene (PP)
- 3.3. Polyvinyl Chloride (PVC)
- 3.4. Polyethylene Terephthalate (PET)
- 3.5. Other Materials
-
4. End-user Industry
- 4.1. Food
- 4.2. Beverages
- 4.3. Healthcare and Pharmaceuticals
- 4.4. Personal and Home Care
- 4.5. Other End-user Industries
Packaging Industry in South Africa Segmentation By Geography
-
1. North America
- 1.1. United States
- 1.2. Canada
- 1.3. Mexico
-
2. South America
- 2.1. Brazil
- 2.2. Argentina
- 2.3. Rest of South America
-
3. Europe
- 3.1. United Kingdom
- 3.2. Germany
- 3.3. France
- 3.4. Italy
- 3.5. Spain
- 3.6. Russia
- 3.7. Benelux
- 3.8. Nordics
- 3.9. Rest of Europe
-
4. Middle East & Africa
- 4.1. Turkey
- 4.2. Israel
- 4.3. GCC
- 4.4. North Africa
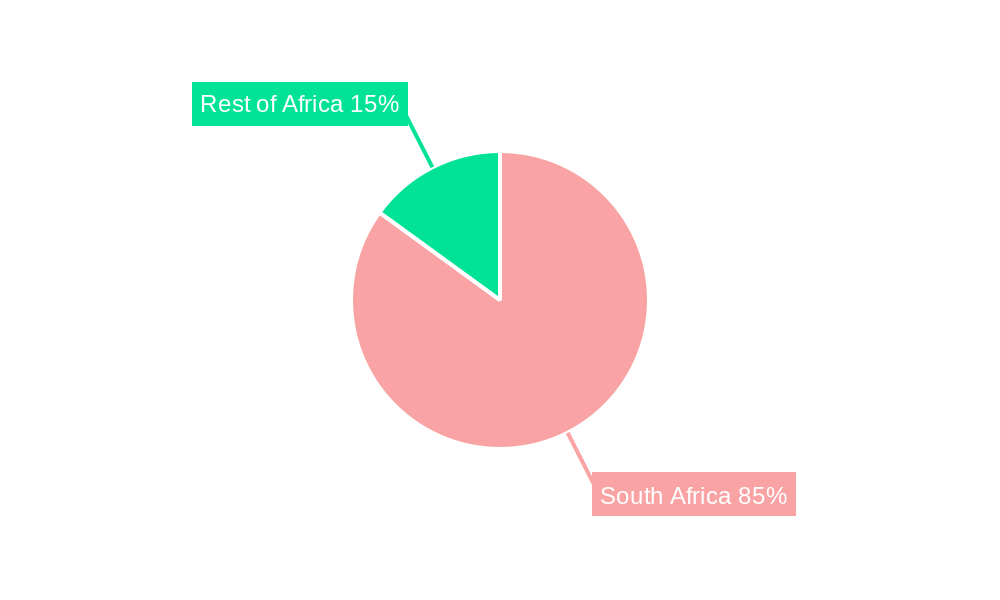
- 4.5. South Africa
- 4.6. Rest of Middle East & Africa
-
5. Asia Pacific
- 5.1. China
- 5.2. India
- 5.3. Japan
- 5.4. South Korea
- 5.5. ASEAN
- 5.6. Oceania
- 5.7. Rest of Asia Pacific
Packaging Industry in South Africa REPORT HIGHLIGHTS
| Aspects | Details |
|---|---|
| Study Period | 2019-2033 |
| Base Year | 2024 |
| Estimated Year | 2025 |
| Forecast Period | 2025-2033 |
| Historical Period | 2019-2024 |
| Growth Rate | CAGR of 2.89% from 2019-2033 |
| Segmentation |
|
Table of Contents
- 1. Introduction
- 1.1. Research Scope
- 1.2. Market Segmentation
- 1.3. Research Methodology
- 1.4. Definitions and Assumptions
- 2. Executive Summary
- 2.1. Introduction
- 3. Market Dynamics
- 3.1. Introduction
- 3.2. Market Drivers
- 3.2.1. Growing Demand for Consumer Goods; Favorable Packaging Properties Possessed by Plastic
- 3.3. Market Restrains
- 3.3.1. Fluctuating Raw Material Prices
- 3.4. Market Trends
- 3.4.1. Aggressive Recycling Rates of Plastic Products within the Country and an increase in Waste Generation
- 4. Market Factor Analysis
- 4.1. Porters Five Forces
- 4.2. Supply/Value Chain
- 4.3. PESTEL analysis
- 4.4. Market Entropy
- 4.5. Patent/Trademark Analysis
- 5. Global Packaging Industry in South Africa Analysis, Insights and Forecast, 2019-2031
- 5.1. Market Analysis, Insights and Forecast - by Product Type
- 5.1.1. Bottles and Jars
- 5.1.2. Pouches
- 5.1.3. Bags
- 5.1.4. Films and Wraps
- 5.1.5. Other Product Types
- 5.2. Market Analysis, Insights and Forecast - by Type of Plastic
- 5.2.1. Rigid
- 5.2.2. Flexible
- 5.3. Market Analysis, Insights and Forecast - by Material
- 5.3.1. Polyethylene (PE)
- 5.3.2. Polypropylene (PP)
- 5.3.3. Polyvinyl Chloride (PVC)
- 5.3.4. Polyethylene Terephthalate (PET)
- 5.3.5. Other Materials
- 5.4. Market Analysis, Insights and Forecast - by End-user Industry
- 5.4.1. Food
- 5.4.2. Beverages
- 5.4.3. Healthcare and Pharmaceuticals
- 5.4.4. Personal and Home Care
- 5.4.5. Other End-user Industries
- 5.5. Market Analysis, Insights and Forecast - by Region
- 5.5.1. North America
- 5.5.2. South America
- 5.5.3. Europe
- 5.5.4. Middle East & Africa
- 5.5.5. Asia Pacific
- 5.1. Market Analysis, Insights and Forecast - by Product Type
- 6. North America Packaging Industry in South Africa Analysis, Insights and Forecast, 2019-2031
- 6.1. Market Analysis, Insights and Forecast - by Product Type
- 6.1.1. Bottles and Jars
- 6.1.2. Pouches
- 6.1.3. Bags
- 6.1.4. Films and Wraps
- 6.1.5. Other Product Types
- 6.2. Market Analysis, Insights and Forecast - by Type of Plastic
- 6.2.1. Rigid
- 6.2.2. Flexible
- 6.3. Market Analysis, Insights and Forecast - by Material
- 6.3.1. Polyethylene (PE)
- 6.3.2. Polypropylene (PP)
- 6.3.3. Polyvinyl Chloride (PVC)
- 6.3.4. Polyethylene Terephthalate (PET)
- 6.3.5. Other Materials
- 6.4. Market Analysis, Insights and Forecast - by End-user Industry
- 6.4.1. Food
- 6.4.2. Beverages
- 6.4.3. Healthcare and Pharmaceuticals
- 6.4.4. Personal and Home Care
- 6.4.5. Other End-user Industries
- 6.1. Market Analysis, Insights and Forecast - by Product Type
- 7. South America Packaging Industry in South Africa Analysis, Insights and Forecast, 2019-2031
- 7.1. Market Analysis, Insights and Forecast - by Product Type
- 7.1.1. Bottles and Jars
- 7.1.2. Pouches
- 7.1.3. Bags
- 7.1.4. Films and Wraps
- 7.1.5. Other Product Types
- 7.2. Market Analysis, Insights and Forecast - by Type of Plastic
- 7.2.1. Rigid
- 7.2.2. Flexible
- 7.3. Market Analysis, Insights and Forecast - by Material
- 7.3.1. Polyethylene (PE)
- 7.3.2. Polypropylene (PP)
- 7.3.3. Polyvinyl Chloride (PVC)
- 7.3.4. Polyethylene Terephthalate (PET)
- 7.3.5. Other Materials
- 7.4. Market Analysis, Insights and Forecast - by End-user Industry
- 7.4.1. Food
- 7.4.2. Beverages
- 7.4.3. Healthcare and Pharmaceuticals
- 7.4.4. Personal and Home Care
- 7.4.5. Other End-user Industries
- 7.1. Market Analysis, Insights and Forecast - by Product Type
- 8. Europe Packaging Industry in South Africa Analysis, Insights and Forecast, 2019-2031
- 8.1. Market Analysis, Insights and Forecast - by Product Type
- 8.1.1. Bottles and Jars
- 8.1.2. Pouches
- 8.1.3. Bags
- 8.1.4. Films and Wraps
- 8.1.5. Other Product Types
- 8.2. Market Analysis, Insights and Forecast - by Type of Plastic
- 8.2.1. Rigid
- 8.2.2. Flexible
- 8.3. Market Analysis, Insights and Forecast - by Material
- 8.3.1. Polyethylene (PE)
- 8.3.2. Polypropylene (PP)
- 8.3.3. Polyvinyl Chloride (PVC)
- 8.3.4. Polyethylene Terephthalate (PET)
- 8.3.5. Other Materials
- 8.4. Market Analysis, Insights and Forecast - by End-user Industry
- 8.4.1. Food
- 8.4.2. Beverages
- 8.4.3. Healthcare and Pharmaceuticals
- 8.4.4. Personal and Home Care
- 8.4.5. Other End-user Industries
- 8.1. Market Analysis, Insights and Forecast - by Product Type
- 9. Middle East & Africa Packaging Industry in South Africa Analysis, Insights and Forecast, 2019-2031
- 9.1. Market Analysis, Insights and Forecast - by Product Type
- 9.1.1. Bottles and Jars
- 9.1.2. Pouches
- 9.1.3. Bags
- 9.1.4. Films and Wraps
- 9.1.5. Other Product Types
- 9.2. Market Analysis, Insights and Forecast - by Type of Plastic
- 9.2.1. Rigid
- 9.2.2. Flexible
- 9.3. Market Analysis, Insights and Forecast - by Material
- 9.3.1. Polyethylene (PE)
- 9.3.2. Polypropylene (PP)
- 9.3.3. Polyvinyl Chloride (PVC)
- 9.3.4. Polyethylene Terephthalate (PET)
- 9.3.5. Other Materials
- 9.4. Market Analysis, Insights and Forecast - by End-user Industry
- 9.4.1. Food
- 9.4.2. Beverages
- 9.4.3. Healthcare and Pharmaceuticals
- 9.4.4. Personal and Home Care
- 9.4.5. Other End-user Industries
- 9.1. Market Analysis, Insights and Forecast - by Product Type
- 10. Asia Pacific Packaging Industry in South Africa Analysis, Insights and Forecast, 2019-2031
- 10.1. Market Analysis, Insights and Forecast - by Product Type
- 10.1.1. Bottles and Jars
- 10.1.2. Pouches
- 10.1.3. Bags
- 10.1.4. Films and Wraps
- 10.1.5. Other Product Types
- 10.2. Market Analysis, Insights and Forecast - by Type of Plastic
- 10.2.1. Rigid
- 10.2.2. Flexible
- 10.3. Market Analysis, Insights and Forecast - by Material
- 10.3.1. Polyethylene (PE)
- 10.3.2. Polypropylene (PP)
- 10.3.3. Polyvinyl Chloride (PVC)
- 10.3.4. Polyethylene Terephthalate (PET)
- 10.3.5. Other Materials
- 10.4. Market Analysis, Insights and Forecast - by End-user Industry
- 10.4.1. Food
- 10.4.2. Beverages
- 10.4.3. Healthcare and Pharmaceuticals
- 10.4.4. Personal and Home Care
- 10.4.5. Other End-user Industries
- 10.1. Market Analysis, Insights and Forecast - by Product Type
- 11. South Africa Packaging Industry in South Africa Analysis, Insights and Forecast, 2019-2031
- 12. Sudan Packaging Industry in South Africa Analysis, Insights and Forecast, 2019-2031
- 13. Uganda Packaging Industry in South Africa Analysis, Insights and Forecast, 2019-2031
- 14. Tanzania Packaging Industry in South Africa Analysis, Insights and Forecast, 2019-2031
- 15. Kenya Packaging Industry in South Africa Analysis, Insights and Forecast, 2019-2031
- 16. Rest of Africa Packaging Industry in South Africa Analysis, Insights and Forecast, 2019-2031
- 17. Competitive Analysis
- 17.1. Global Market Share Analysis 2024
- 17.2. Company Profiles
- 17.2.1 Italpac (Pty) Ltd
- 17.2.1.1. Overview
- 17.2.1.2. Products
- 17.2.1.3. SWOT Analysis
- 17.2.1.4. Recent Developments
- 17.2.1.5. Financials (Based on Availability)
- 17.2.2 RPC Astrapak Ltd
- 17.2.2.1. Overview
- 17.2.2.2. Products
- 17.2.2.3. SWOT Analysis
- 17.2.2.4. Recent Developments
- 17.2.2.5. Financials (Based on Availability)
- 17.2.3 Nampak Ltd
- 17.2.3.1. Overview
- 17.2.3.2. Products
- 17.2.3.3. SWOT Analysis
- 17.2.3.4. Recent Developments
- 17.2.3.5. Financials (Based on Availability)
- 17.2.4 Nioro Plastics (Pty) Ltd*List Not Exhaustive
- 17.2.4.1. Overview
- 17.2.4.2. Products
- 17.2.4.3. SWOT Analysis
- 17.2.4.4. Recent Developments
- 17.2.4.5. Financials (Based on Availability)
- 17.2.5 Tetra Pak Ltd
- 17.2.5.1. Overview
- 17.2.5.2. Products
- 17.2.5.3. SWOT Analysis
- 17.2.5.4. Recent Developments
- 17.2.5.5. Financials (Based on Availability)
- 17.2.6 Mondi PLC
- 17.2.6.1. Overview
- 17.2.6.2. Products
- 17.2.6.3. SWOT Analysis
- 17.2.6.4. Recent Developments
- 17.2.6.5. Financials (Based on Availability)
- 17.2.7 Mpact Ltd
- 17.2.7.1. Overview
- 17.2.7.2. Products
- 17.2.7.3. SWOT Analysis
- 17.2.7.4. Recent Developments
- 17.2.7.5. Financials (Based on Availability)
- 17.2.8 Amcor Limited
- 17.2.8.1. Overview
- 17.2.8.2. Products
- 17.2.8.3. SWOT Analysis
- 17.2.8.4. Recent Developments
- 17.2.8.5. Financials (Based on Availability)
- 17.2.9 Sealed Air Corporation
- 17.2.9.1. Overview
- 17.2.9.2. Products
- 17.2.9.3. SWOT Analysis
- 17.2.9.4. Recent Developments
- 17.2.9.5. Financials (Based on Availability)
- 17.2.10 Constantia Flexibles Corporation
- 17.2.10.1. Overview
- 17.2.10.2. Products
- 17.2.10.3. SWOT Analysis
- 17.2.10.4. Recent Developments
- 17.2.10.5. Financials (Based on Availability)
- 17.2.1 Italpac (Pty) Ltd
List of Figures
- Figure 1: Global Packaging Industry in South Africa Revenue Breakdown (Million, %) by Region 2024 & 2032
- Figure 2: Africa Packaging Industry in South Africa Revenue (Million), by Country 2024 & 2032
- Figure 3: Africa Packaging Industry in South Africa Revenue Share (%), by Country 2024 & 2032
- Figure 4: North America Packaging Industry in South Africa Revenue (Million), by Product Type 2024 & 2032
- Figure 5: North America Packaging Industry in South Africa Revenue Share (%), by Product Type 2024 & 2032
- Figure 6: North America Packaging Industry in South Africa Revenue (Million), by Type of Plastic 2024 & 2032
- Figure 7: North America Packaging Industry in South Africa Revenue Share (%), by Type of Plastic 2024 & 2032
- Figure 8: North America Packaging Industry in South Africa Revenue (Million), by Material 2024 & 2032
- Figure 9: North America Packaging Industry in South Africa Revenue Share (%), by Material 2024 & 2032
- Figure 10: North America Packaging Industry in South Africa Revenue (Million), by End-user Industry 2024 & 2032
- Figure 11: North America Packaging Industry in South Africa Revenue Share (%), by End-user Industry 2024 & 2032
- Figure 12: North America Packaging Industry in South Africa Revenue (Million), by Country 2024 & 2032
- Figure 13: North America Packaging Industry in South Africa Revenue Share (%), by Country 2024 & 2032
- Figure 14: South America Packaging Industry in South Africa Revenue (Million), by Product Type 2024 & 2032
- Figure 15: South America Packaging Industry in South Africa Revenue Share (%), by Product Type 2024 & 2032
- Figure 16: South America Packaging Industry in South Africa Revenue (Million), by Type of Plastic 2024 & 2032
- Figure 17: South America Packaging Industry in South Africa Revenue Share (%), by Type of Plastic 2024 & 2032
- Figure 18: South America Packaging Industry in South Africa Revenue (Million), by Material 2024 & 2032
- Figure 19: South America Packaging Industry in South Africa Revenue Share (%), by Material 2024 & 2032
- Figure 20: South America Packaging Industry in South Africa Revenue (Million), by End-user Industry 2024 & 2032
- Figure 21: South America Packaging Industry in South Africa Revenue Share (%), by End-user Industry 2024 & 2032
- Figure 22: South America Packaging Industry in South Africa Revenue (Million), by Country 2024 & 2032
- Figure 23: South America Packaging Industry in South Africa Revenue Share (%), by Country 2024 & 2032
- Figure 24: Europe Packaging Industry in South Africa Revenue (Million), by Product Type 2024 & 2032
- Figure 25: Europe Packaging Industry in South Africa Revenue Share (%), by Product Type 2024 & 2032
- Figure 26: Europe Packaging Industry in South Africa Revenue (Million), by Type of Plastic 2024 & 2032
- Figure 27: Europe Packaging Industry in South Africa Revenue Share (%), by Type of Plastic 2024 & 2032
- Figure 28: Europe Packaging Industry in South Africa Revenue (Million), by Material 2024 & 2032
- Figure 29: Europe Packaging Industry in South Africa Revenue Share (%), by Material 2024 & 2032
- Figure 30: Europe Packaging Industry in South Africa Revenue (Million), by End-user Industry 2024 & 2032
- Figure 31: Europe Packaging Industry in South Africa Revenue Share (%), by End-user Industry 2024 & 2032
- Figure 32: Europe Packaging Industry in South Africa Revenue (Million), by Country 2024 & 2032
- Figure 33: Europe Packaging Industry in South Africa Revenue Share (%), by Country 2024 & 2032
- Figure 34: Middle East & Africa Packaging Industry in South Africa Revenue (Million), by Product Type 2024 & 2032
- Figure 35: Middle East & Africa Packaging Industry in South Africa Revenue Share (%), by Product Type 2024 & 2032
- Figure 36: Middle East & Africa Packaging Industry in South Africa Revenue (Million), by Type of Plastic 2024 & 2032
- Figure 37: Middle East & Africa Packaging Industry in South Africa Revenue Share (%), by Type of Plastic 2024 & 2032
- Figure 38: Middle East & Africa Packaging Industry in South Africa Revenue (Million), by Material 2024 & 2032
- Figure 39: Middle East & Africa Packaging Industry in South Africa Revenue Share (%), by Material 2024 & 2032
- Figure 40: Middle East & Africa Packaging Industry in South Africa Revenue (Million), by End-user Industry 2024 & 2032
- Figure 41: Middle East & Africa Packaging Industry in South Africa Revenue Share (%), by End-user Industry 2024 & 2032
- Figure 42: Middle East & Africa Packaging Industry in South Africa Revenue (Million), by Country 2024 & 2032
- Figure 43: Middle East & Africa Packaging Industry in South Africa Revenue Share (%), by Country 2024 & 2032
- Figure 44: Asia Pacific Packaging Industry in South Africa Revenue (Million), by Product Type 2024 & 2032
- Figure 45: Asia Pacific Packaging Industry in South Africa Revenue Share (%), by Product Type 2024 & 2032
- Figure 46: Asia Pacific Packaging Industry in South Africa Revenue (Million), by Type of Plastic 2024 & 2032
- Figure 47: Asia Pacific Packaging Industry in South Africa Revenue Share (%), by Type of Plastic 2024 & 2032
- Figure 48: Asia Pacific Packaging Industry in South Africa Revenue (Million), by Material 2024 & 2032
- Figure 49: Asia Pacific Packaging Industry in South Africa Revenue Share (%), by Material 2024 & 2032
- Figure 50: Asia Pacific Packaging Industry in South Africa Revenue (Million), by End-user Industry 2024 & 2032
- Figure 51: Asia Pacific Packaging Industry in South Africa Revenue Share (%), by End-user Industry 2024 & 2032
- Figure 52: Asia Pacific Packaging Industry in South Africa Revenue (Million), by Country 2024 & 2032
- Figure 53: Asia Pacific Packaging Industry in South Africa Revenue Share (%), by Country 2024 & 2032
List of Tables
- Table 1: Global Packaging Industry in South Africa Revenue Million Forecast, by Region 2019 & 2032
- Table 2: Global Packaging Industry in South Africa Revenue Million Forecast, by Product Type 2019 & 2032
- Table 3: Global Packaging Industry in South Africa Revenue Million Forecast, by Type of Plastic 2019 & 2032
- Table 4: Global Packaging Industry in South Africa Revenue Million Forecast, by Material 2019 & 2032
- Table 5: Global Packaging Industry in South Africa Revenue Million Forecast, by End-user Industry 2019 & 2032
- Table 6: Global Packaging Industry in South Africa Revenue Million Forecast, by Region 2019 & 2032
- Table 7: Global Packaging Industry in South Africa Revenue Million Forecast, by Country 2019 & 2032
- Table 8: South Africa Packaging Industry in South Africa Revenue (Million) Forecast, by Application 2019 & 2032
- Table 9: Sudan Packaging Industry in South Africa Revenue (Million) Forecast, by Application 2019 & 2032
- Table 10: Uganda Packaging Industry in South Africa Revenue (Million) Forecast, by Application 2019 & 2032
- Table 11: Tanzania Packaging Industry in South Africa Revenue (Million) Forecast, by Application 2019 & 2032
- Table 12: Kenya Packaging Industry in South Africa Revenue (Million) Forecast, by Application 2019 & 2032
- Table 13: Rest of Africa Packaging Industry in South Africa Revenue (Million) Forecast, by Application 2019 & 2032
- Table 14: Global Packaging Industry in South Africa Revenue Million Forecast, by Product Type 2019 & 2032
- Table 15: Global Packaging Industry in South Africa Revenue Million Forecast, by Type of Plastic 2019 & 2032
- Table 16: Global Packaging Industry in South Africa Revenue Million Forecast, by Material 2019 & 2032
- Table 17: Global Packaging Industry in South Africa Revenue Million Forecast, by End-user Industry 2019 & 2032
- Table 18: Global Packaging Industry in South Africa Revenue Million Forecast, by Country 2019 & 2032
- Table 19: United States Packaging Industry in South Africa Revenue (Million) Forecast, by Application 2019 & 2032
- Table 20: Canada Packaging Industry in South Africa Revenue (Million) Forecast, by Application 2019 & 2032
- Table 21: Mexico Packaging Industry in South Africa Revenue (Million) Forecast, by Application 2019 & 2032
- Table 22: Global Packaging Industry in South Africa Revenue Million Forecast, by Product Type 2019 & 2032
- Table 23: Global Packaging Industry in South Africa Revenue Million Forecast, by Type of Plastic 2019 & 2032
- Table 24: Global Packaging Industry in South Africa Revenue Million Forecast, by Material 2019 & 2032
- Table 25: Global Packaging Industry in South Africa Revenue Million Forecast, by End-user Industry 2019 & 2032
- Table 26: Global Packaging Industry in South Africa Revenue Million Forecast, by Country 2019 & 2032
- Table 27: Brazil Packaging Industry in South Africa Revenue (Million) Forecast, by Application 2019 & 2032
- Table 28: Argentina Packaging Industry in South Africa Revenue (Million) Forecast, by Application 2019 & 2032
- Table 29: Rest of South America Packaging Industry in South Africa Revenue (Million) Forecast, by Application 2019 & 2032
- Table 30: Global Packaging Industry in South Africa Revenue Million Forecast, by Product Type 2019 & 2032
- Table 31: Global Packaging Industry in South Africa Revenue Million Forecast, by Type of Plastic 2019 & 2032
- Table 32: Global Packaging Industry in South Africa Revenue Million Forecast, by Material 2019 & 2032
- Table 33: Global Packaging Industry in South Africa Revenue Million Forecast, by End-user Industry 2019 & 2032
- Table 34: Global Packaging Industry in South Africa Revenue Million Forecast, by Country 2019 & 2032
- Table 35: United Kingdom Packaging Industry in South Africa Revenue (Million) Forecast, by Application 2019 & 2032
- Table 36: Germany Packaging Industry in South Africa Revenue (Million) Forecast, by Application 2019 & 2032
- Table 37: France Packaging Industry in South Africa Revenue (Million) Forecast, by Application 2019 & 2032
- Table 38: Italy Packaging Industry in South Africa Revenue (Million) Forecast, by Application 2019 & 2032
- Table 39: Spain Packaging Industry in South Africa Revenue (Million) Forecast, by Application 2019 & 2032
- Table 40: Russia Packaging Industry in South Africa Revenue (Million) Forecast, by Application 2019 & 2032
- Table 41: Benelux Packaging Industry in South Africa Revenue (Million) Forecast, by Application 2019 & 2032
- Table 42: Nordics Packaging Industry in South Africa Revenue (Million) Forecast, by Application 2019 & 2032
- Table 43: Rest of Europe Packaging Industry in South Africa Revenue (Million) Forecast, by Application 2019 & 2032
- Table 44: Global Packaging Industry in South Africa Revenue Million Forecast, by Product Type 2019 & 2032
- Table 45: Global Packaging Industry in South Africa Revenue Million Forecast, by Type of Plastic 2019 & 2032
- Table 46: Global Packaging Industry in South Africa Revenue Million Forecast, by Material 2019 & 2032
- Table 47: Global Packaging Industry in South Africa Revenue Million Forecast, by End-user Industry 2019 & 2032
- Table 48: Global Packaging Industry in South Africa Revenue Million Forecast, by Country 2019 & 2032
- Table 49: Turkey Packaging Industry in South Africa Revenue (Million) Forecast, by Application 2019 & 2032
- Table 50: Israel Packaging Industry in South Africa Revenue (Million) Forecast, by Application 2019 & 2032
- Table 51: GCC Packaging Industry in South Africa Revenue (Million) Forecast, by Application 2019 & 2032
- Table 52: North Africa Packaging Industry in South Africa Revenue (Million) Forecast, by Application 2019 & 2032
- Table 53: South Africa Packaging Industry in South Africa Revenue (Million) Forecast, by Application 2019 & 2032
- Table 54: Rest of Middle East & Africa Packaging Industry in South Africa Revenue (Million) Forecast, by Application 2019 & 2032
- Table 55: Global Packaging Industry in South Africa Revenue Million Forecast, by Product Type 2019 & 2032
- Table 56: Global Packaging Industry in South Africa Revenue Million Forecast, by Type of Plastic 2019 & 2032
- Table 57: Global Packaging Industry in South Africa Revenue Million Forecast, by Material 2019 & 2032
- Table 58: Global Packaging Industry in South Africa Revenue Million Forecast, by End-user Industry 2019 & 2032
- Table 59: Global Packaging Industry in South Africa Revenue Million Forecast, by Country 2019 & 2032
- Table 60: China Packaging Industry in South Africa Revenue (Million) Forecast, by Application 2019 & 2032
- Table 61: India Packaging Industry in South Africa Revenue (Million) Forecast, by Application 2019 & 2032
- Table 62: Japan Packaging Industry in South Africa Revenue (Million) Forecast, by Application 2019 & 2032
- Table 63: South Korea Packaging Industry in South Africa Revenue (Million) Forecast, by Application 2019 & 2032
- Table 64: ASEAN Packaging Industry in South Africa Revenue (Million) Forecast, by Application 2019 & 2032
- Table 65: Oceania Packaging Industry in South Africa Revenue (Million) Forecast, by Application 2019 & 2032
- Table 66: Rest of Asia Pacific Packaging Industry in South Africa Revenue (Million) Forecast, by Application 2019 & 2032
Frequently Asked Questions
1. What is the projected Compound Annual Growth Rate (CAGR) of the Packaging Industry in South Africa?
The projected CAGR is approximately 2.89%.
2. Which companies are prominent players in the Packaging Industry in South Africa?
Key companies in the market include Italpac (Pty) Ltd, RPC Astrapak Ltd, Nampak Ltd, Nioro Plastics (Pty) Ltd*List Not Exhaustive, Tetra Pak Ltd, Mondi PLC, Mpact Ltd, Amcor Limited, Sealed Air Corporation, Constantia Flexibles Corporation.
3. What are the main segments of the Packaging Industry in South Africa?
The market segments include Product Type, Type of Plastic, Material, End-user Industry.
4. Can you provide details about the market size?
The market size is estimated to be USD 2.59 Million as of 2022.
5. What are some drivers contributing to market growth?
Growing Demand for Consumer Goods; Favorable Packaging Properties Possessed by Plastic.
6. What are the notable trends driving market growth?
Aggressive Recycling Rates of Plastic Products within the Country and an increase in Waste Generation.
7. Are there any restraints impacting market growth?
Fluctuating Raw Material Prices.
8. Can you provide examples of recent developments in the market?
May 2021 - The country released a new regulation that requires any company or brand that makes or imports any form of plastic packaging for distribution in South Africa to pay an extended producer responsibility (EPR) fee per tonne from 5 May 2021. Strict government targets have been set for annual collection and recycling over the next five years, and the EPR is positioned to invest in collection infrastructure in the country. Existing producers are expected to register with the Department of Environment, Forestry, and Fisheries by November 2021.
9. What pricing options are available for accessing the report?
Pricing options include single-user, multi-user, and enterprise licenses priced at USD 3800, USD 4500, and USD 5800 respectively.
10. Is the market size provided in terms of value or volume?
The market size is provided in terms of value, measured in Million.
11. Are there any specific market keywords associated with the report?
Yes, the market keyword associated with the report is "Packaging Industry in South Africa," which aids in identifying and referencing the specific market segment covered.
12. How do I determine which pricing option suits my needs best?
The pricing options vary based on user requirements and access needs. Individual users may opt for single-user licenses, while businesses requiring broader access may choose multi-user or enterprise licenses for cost-effective access to the report.
13. Are there any additional resources or data provided in the Packaging Industry in South Africa report?
While the report offers comprehensive insights, it's advisable to review the specific contents or supplementary materials provided to ascertain if additional resources or data are available.
14. How can I stay updated on further developments or reports in the Packaging Industry in South Africa?
To stay informed about further developments, trends, and reports in the Packaging Industry in South Africa, consider subscribing to industry newsletters, following relevant companies and organizations, or regularly checking reputable industry news sources and publications.
Methodology
Step 1 - Identification of Relevant Samples Size from Population Database


Step 2 - Approaches for Defining Global Market Size (Value, Volume* & Price*)

Note*: In applicable scenarios
Step 3 - Data Sources
Primary Research
- Web Analytics
- Survey Reports
- Research Institute
- Latest Research Reports
- Opinion Leaders
Secondary Research
- Annual Reports
- White Paper
- Latest Press Release
- Industry Association
- Paid Database
- Investor Presentations

Step 4 - Data Triangulation
Involves using different sources of information in order to increase the validity of a study
These sources are likely to be stakeholders in a program - participants, other researchers, program staff, other community members, and so on.
Then we put all data in single framework & apply various statistical tools to find out the dynamic on the market.
During the analysis stage, feedback from the stakeholder groups would be compared to determine areas of agreement as well as areas of divergence


