
Key Insights
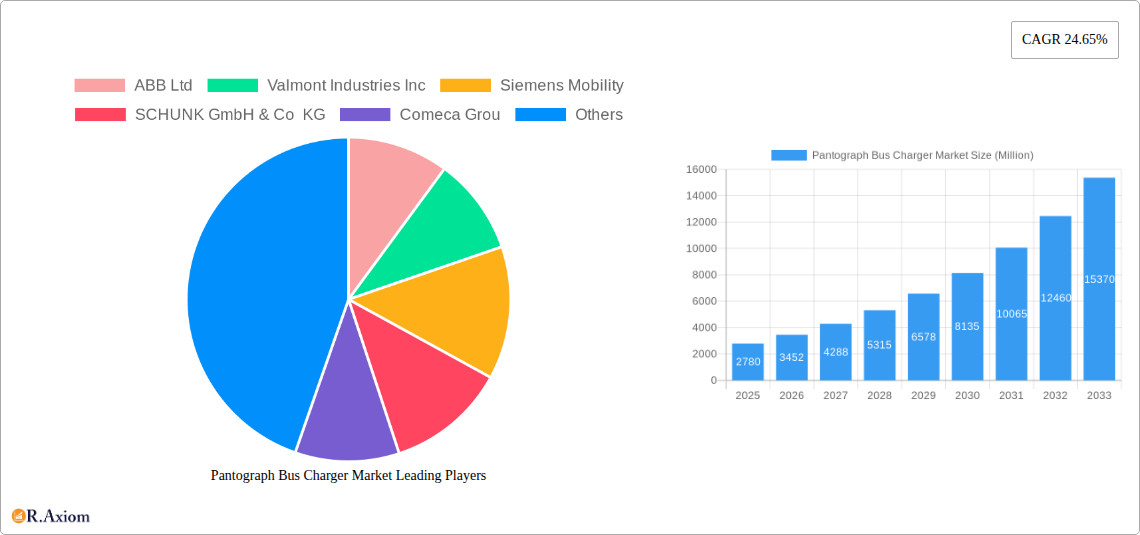
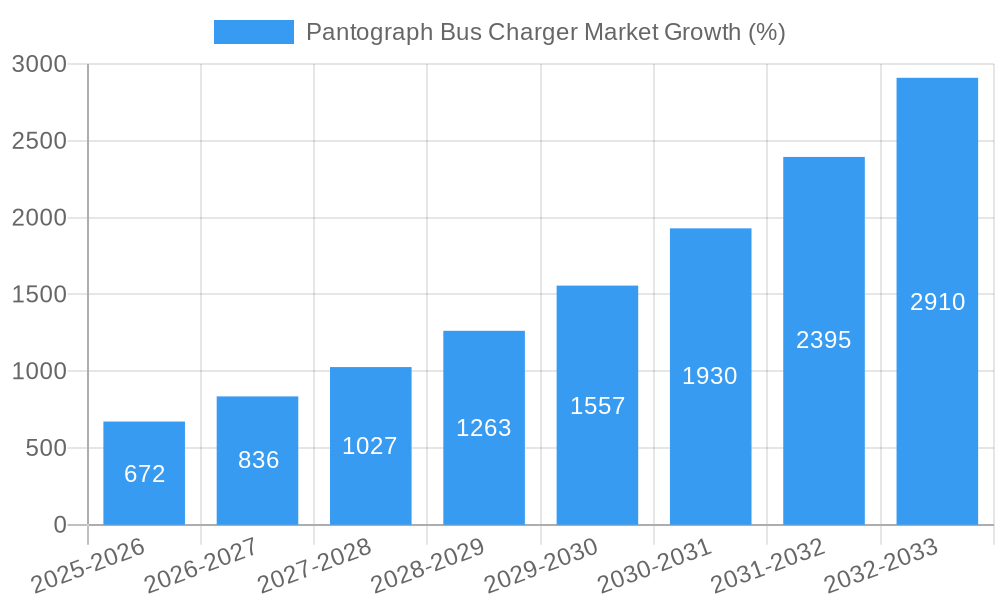
The global Pantograph Bus Charger market is experiencing robust growth, projected to reach a substantial market size driven by the increasing adoption of electric buses and the need for efficient, high-power charging solutions. The market's Compound Annual Growth Rate (CAGR) of 24.65% from 2019 to 2024 indicates a significant upward trajectory. This rapid expansion is fueled by several key factors: growing government initiatives promoting sustainable transportation, the expanding electric bus fleet across major cities globally, and advancements in pantograph technology leading to improved charging speed and reliability. The market segmentation reveals strong demand across different components (hardware and software) and charging infrastructure types (off-board and on-board). While off-board top-down pantographs currently dominate, on-board bottom-up systems are gaining traction due to their space-saving advantages and improved charging efficiency in densely populated urban areas. Direct Current Fast Charging (DCFC) is becoming increasingly prevalent, further accelerating market growth as it significantly reduces charging times compared to slower Level 1 and Level 2 AC charging. Key players like ABB, Siemens Mobility, and others are strategically investing in R&D and expansion to capitalize on this expanding market, fostering healthy competition and technological advancements.
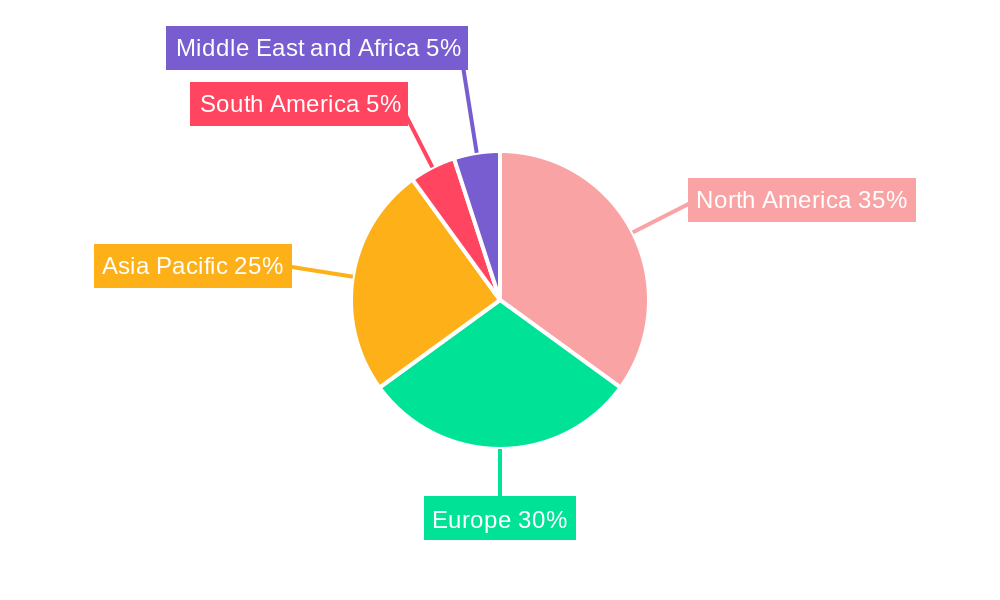
The geographical distribution of the market shows a significant presence across North America, Europe, and the Asia-Pacific region, with these regions driving the majority of market revenue. North America benefits from early adoption and supportive government policies, while Europe exhibits strong growth spurred by the European Union's focus on reducing carbon emissions. The Asia-Pacific region, particularly China and India, is emerging as a key growth area, reflecting the rapid urbanization and increasing investments in public transportation infrastructure. The market is expected to witness continued expansion throughout the forecast period (2025-2033), driven by the factors mentioned above, with further segmentation and specialization within component technologies, charging infrastructure, and geographical markets anticipated. Challenges such as high initial investment costs for infrastructure development and the need for robust grid infrastructure to support increased charging demands remain, but ongoing technological innovation and supportive government policies are mitigating these challenges.
Pantograph Bus Charger Market: A Comprehensive Report (2019-2033)
This detailed report provides a comprehensive analysis of the Pantograph Bus Charger Market, offering actionable insights for industry stakeholders. The study period covers 2019-2033, with 2025 as the base and estimated year. The forecast period spans 2025-2033, encompassing historical data from 2019-2024. The market is segmented by pcomponent type (Hardware, Software), charging infrastructure type (Off-board top-down pantograph, On-Board Bottom-Up Pantograph), and charging type (Level 2, Level 3, Direct Current Fast Charging). Key players include ABB Ltd, Valmont Industries Inc, Siemens Mobility, SCHUNK GmbH & Co KG, Comeca Grou, Schunk Transit Systems GmBH, Wabtech Corporation, Vector Informatik GmbH, and SETEC Power. The report projects a xx Million market value by 2033, driven by the increasing adoption of electric buses globally.
Pantograph Bus Charger Market Market Concentration & Innovation
The Pantograph Bus Charger market exhibits a moderately concentrated landscape, with a few major players holding significant market share. ABB Ltd, Siemens Mobility, and SCHUNK GmbH & Co KG are among the dominant players, leveraging their established technological expertise and global reach. Precise market share figures require further proprietary analysis but preliminary estimations indicate ABB Ltd holds approximately xx% and Siemens Mobility holds approximately xx% of the market in 2025. The market's innovation is driven primarily by advancements in charging technology, aiming for faster charging speeds, enhanced safety features, and improved reliability. Stringent regulatory frameworks promoting electric mobility are key drivers, pushing for higher efficiency and interoperability standards. Product substitutes, such as inductive charging systems, pose a competitive threat, though pantograph charging remains dominant due to its established infrastructure and mature technology. End-user trends favor efficient and convenient charging solutions, necessitating innovations addressing deployment and maintenance costs. Mergers and acquisitions (M&A) activity in this space is moderate. While precise deal values remain confidential, several smaller acquisitions have taken place to enhance product portfolios and geographic reach. For example, a xx Million acquisition in 2024 significantly expanded the presence of a key player in the North American market.
Pantograph Bus Charger Market Industry Trends & Insights
The Pantograph Bus Charger market is experiencing robust growth, fueled by the global shift towards sustainable transportation. The increasing adoption of electric buses, particularly in urban areas, is a major catalyst. Governments worldwide are actively promoting electric bus fleets through subsidies, tax incentives, and emission regulations. This has resulted in a Compound Annual Growth Rate (CAGR) of approximately xx% during the historical period (2019-2024), and projections indicate a CAGR of xx% from 2025-2033. Technological disruptions, such as advancements in battery technology and fast-charging capabilities, further accelerate market expansion. Consumer preferences shift towards environmentally friendly options, fostering demand for efficient and reliable charging solutions. Competitive dynamics are shaping through strategic partnerships, technological innovations, and aggressive pricing strategies. Market penetration is highest in regions with well-established public transport systems and supportive government policies, with Europe and North America leading the way.
Dominant Markets & Segments in Pantograph Bus Charger Market
Leading Region/Country: Europe and North America currently dominate the market, driven by strong government support for electric bus adoption and existing infrastructure. China is rapidly emerging as a significant player.
Dominant Segment Analysis:
- By Pcomponent Type: Hardware accounts for the larger market share due to the significant investment in physical charging infrastructure. Software solutions are growing rapidly, with increased demand for intelligent charging management systems.
- By Charging Infrastructure Type: Off-board top-down pantographs are currently the most prevalent type, owing to their proven technology and compatibility with existing depot infrastructure. On-board bottom-up pantographs are gaining traction, particularly in areas with limited space for overhead infrastructure.
- By Charging Type: Direct Current (DC) fast charging is rapidly gaining popularity due to its ability to quickly recharge electric buses, minimizing downtime. Level 2 and Level 3 AC charging remain significant, particularly for overnight charging scenarios.
Key drivers for regional dominance include supportive government policies (e.g., emission reduction targets, funding for charging infrastructure), established public transportation networks, and strong economic conditions. Europe's robust electric vehicle ecosystem and North America's increasing focus on sustainable transportation are key factors contributing to their dominance. The Asian market shows promising growth, particularly in China and other developing economies, driven by urbanization and increasing environmental concerns.
Pantograph Bus Charger Market Product Developments
Recent product innovations focus on enhancing charging speed, safety, and reliability. Manufacturers are incorporating advanced features such as intelligent power management systems, improved contact mechanisms, and remote diagnostics capabilities. These innovations enhance the efficiency and lifespan of pantograph chargers, while also reducing operational costs. The market is witnessing a push towards standardization and interoperability, ensuring seamless integration with diverse electric bus models and charging networks. Product differentiation focuses on factors such as charging speed, power capacity, ease of installation, and maintenance requirements. The focus is on providing solutions that align with the specific needs of various public transport operators.
Report Scope & Segmentation Analysis
This report comprehensively analyzes the Pantograph Bus Charger Market across various segments:
By Pcomponent Type: The Hardware segment, encompassing physical components of the pantograph charger, is projected to experience xx% CAGR during the forecast period, driven by expanding electric bus fleets. The Software segment, encompassing charging management systems and software solutions, is anticipated to see xx% CAGR due to increasing demand for intelligent and efficient charging operations.
By Charging Infrastructure Type: Off-board top-down pantographs, owing to their established infrastructure and widespread adoption, are anticipated to maintain a larger market share. On-Board Bottom-Up Pantographs will witness a faster CAGR driven by its flexibility.
By Charging Type: The DC fast charging segment is expected to exhibit the highest growth rate, fuelled by the need for rapid recharging solutions. Level 2 and Level 3 charging remain substantial market segments, primarily catering to overnight charging needs. Competitive dynamics in each segment are influenced by technological advancements, pricing strategies, and customer preferences.
Key Drivers of Pantograph Bus Charger Market Growth
Several factors drive the growth of the Pantograph Bus Charger market:
- Increasing Adoption of Electric Buses: Governments worldwide are actively promoting electric buses to reduce emissions and improve air quality.
- Government Incentives and Regulations: Subsidies, tax benefits, and stringent emission regulations incentivize the transition to electric buses.
- Technological Advancements: Improvements in battery technology and fast-charging capabilities enhance the viability of electric buses.
- Growing Urbanization: The increasing population in urban areas necessitates efficient and sustainable public transport solutions.
Challenges in the Pantograph Bus Charger Market Sector
Despite the positive outlook, several challenges hinder market growth:
- High Initial Investment Costs: The cost of installing pantograph charging infrastructure can be substantial, limiting adoption, especially in smaller cities or developing countries. This creates a significant barrier to entry for smaller players.
- Interoperability Issues: Lack of standardization across different charging systems can lead to compatibility issues, hindering efficient operation.
- Maintenance and Repair Costs: Pantograph chargers require regular maintenance and repairs, which can add to operational costs.
- Supply Chain Disruptions: Global supply chain challenges can impact the availability and cost of key components, affecting production and deployment timelines.
Emerging Opportunities in Pantograph Bus Charger Market
- Smart Charging Technologies: Integration of smart charging technologies for optimized energy management and grid integration presents lucrative opportunities.
- Wireless Charging: Development and deployment of wireless charging technologies offer a potential solution to overcome the limitations of physical pantograph connections.
- Expansion in Developing Countries: Significant growth opportunities exist in developing countries with increasing urbanization and a growing need for sustainable public transportation.
- Integration with Renewable Energy Sources: Integrating pantograph charging infrastructure with renewable energy sources such as solar and wind power can significantly improve sustainability.
Leading Players in the Pantograph Bus Charger Market Market
- ABB Ltd
- Valmont Industries Inc
- Siemens Mobility
- SCHUNK GmbH & Co KG
- Comeca Grou
- Schunk Transit Systems GmBH
- Wabtech Corporation
- Vector Informatik GmbH
- SETEC Power
Key Developments in Pantograph Bus Charger Market Industry
August 2022: First Bus's order of 193 electric buses with 150 kW DC and optional 450 kW pantograph charging highlights the growing demand for high-power charging solutions.
May 2022: San Diego Metropolitan Transit System's investment in a Schunk SLS 301 series pantograph charging system demonstrates the increasing adoption of advanced, hands-free charging technologies.
April 2022: TMB's tender for up to 83 electric buses with pantograph charging options underscores the significant investment in electric bus infrastructure in major European cities.
April 2022: The contract for 17 electric buses and pantograph chargers in Grudziądz, Poland, signals the increasing integration of pantograph charging into electric bus procurement packages.
November 2021: Moscow's pilot project testing bus-down pantograph technology represents a key innovation driving advancements in charging infrastructure design.
Strategic Outlook for Pantograph Bus Charger Market Market
The Pantograph Bus Charger Market is poised for significant growth, driven by the continued global transition to electric mobility and supportive government policies. Technological advancements in charging efficiency, safety, and integration with smart grids will further accelerate market expansion. The increasing focus on sustainability and the need for efficient public transportation systems will create substantial demand for pantograph charging solutions in both developed and developing countries. The market presents excellent opportunities for established players and new entrants alike, particularly those focusing on innovation, cost optimization, and strategic partnerships.
Pantograph Bus Charger Market Segmentation
-
1. Charging Type
- 1.1. Level 1
- 1.2. Level 2
- 1.3. Direct Current Fast Charging
-
2. Pcomponent Type
- 2.1. Hardware
- 2.2. Software
-
3. Charging Infrastructure Type
- 3.1. Off-board top-down pantograph
- 3.2. On-Board Bottom-Up Pantograph
Pantograph Bus Charger Market Segmentation By Geography
-
1. North America
- 1.1. United States
- 1.2. Canada
- 1.3. Rest of North America
-
2. Europe
- 2.1. Germany
- 2.2. United Kingdom
- 2.3. France
- 2.4. Italy
- 2.5. Spain
- 2.6. Rest of Europe
-
3. Asia Pacific
- 3.1. India
- 3.2. China
- 3.3. South Korea
- 3.4. Japan
- 3.5. Rest of Asia Pacific
-
4. South America
- 4.1. Brazil
- 4.2. Aegentina
- 4.3. Rest of the South America
-
5. Middle East and Africa
- 5.1. Saudi Arabia
- 5.2. South Africa
- 5.3. Rest of the Middle East and Africa
Pantograph Bus Charger Market REPORT HIGHLIGHTS
| Aspects | Details |
|---|---|
| Study Period | 2019-2033 |
| Base Year | 2024 |
| Estimated Year | 2025 |
| Forecast Period | 2025-2033 |
| Historical Period | 2019-2024 |
| Growth Rate | CAGR of 24.65% from 2019-2033 |
| Segmentation |
|
Table of Contents
- 1. Introduction
- 1.1. Research Scope
- 1.2. Market Segmentation
- 1.3. Research Methodology
- 1.4. Definitions and Assumptions
- 2. Executive Summary
- 2.1. Introduction
- 3. Market Dynamics
- 3.1. Introduction
- 3.2. Market Drivers
- 3.2.1. Rise in Vehicle Sale
- 3.3. Market Restrains
- 3.3.1. Increase in demand for Electric Vehicles
- 3.4. Market Trends
- 3.4.1. Rising Emphasis of Government on Eco-Friendly Buses
- 4. Market Factor Analysis
- 4.1. Porters Five Forces
- 4.2. Supply/Value Chain
- 4.3. PESTEL analysis
- 4.4. Market Entropy
- 4.5. Patent/Trademark Analysis
- 5. Global Pantograph Bus Charger Market Analysis, Insights and Forecast, 2019-2031
- 5.1. Market Analysis, Insights and Forecast - by Charging Type
- 5.1.1. Level 1
- 5.1.2. Level 2
- 5.1.3. Direct Current Fast Charging
- 5.2. Market Analysis, Insights and Forecast - by Pcomponent Type
- 5.2.1. Hardware
- 5.2.2. Software
- 5.3. Market Analysis, Insights and Forecast - by Charging Infrastructure Type
- 5.3.1. Off-board top-down pantograph
- 5.3.2. On-Board Bottom-Up Pantograph
- 5.4. Market Analysis, Insights and Forecast - by Region
- 5.4.1. North America
- 5.4.2. Europe
- 5.4.3. Asia Pacific
- 5.4.4. South America
- 5.4.5. Middle East and Africa
- 5.1. Market Analysis, Insights and Forecast - by Charging Type
- 6. North America Pantograph Bus Charger Market Analysis, Insights and Forecast, 2019-2031
- 6.1. Market Analysis, Insights and Forecast - by Charging Type
- 6.1.1. Level 1
- 6.1.2. Level 2
- 6.1.3. Direct Current Fast Charging
- 6.2. Market Analysis, Insights and Forecast - by Pcomponent Type
- 6.2.1. Hardware
- 6.2.2. Software
- 6.3. Market Analysis, Insights and Forecast - by Charging Infrastructure Type
- 6.3.1. Off-board top-down pantograph
- 6.3.2. On-Board Bottom-Up Pantograph
- 6.1. Market Analysis, Insights and Forecast - by Charging Type
- 7. Europe Pantograph Bus Charger Market Analysis, Insights and Forecast, 2019-2031
- 7.1. Market Analysis, Insights and Forecast - by Charging Type
- 7.1.1. Level 1
- 7.1.2. Level 2
- 7.1.3. Direct Current Fast Charging
- 7.2. Market Analysis, Insights and Forecast - by Pcomponent Type
- 7.2.1. Hardware
- 7.2.2. Software
- 7.3. Market Analysis, Insights and Forecast - by Charging Infrastructure Type
- 7.3.1. Off-board top-down pantograph
- 7.3.2. On-Board Bottom-Up Pantograph
- 7.1. Market Analysis, Insights and Forecast - by Charging Type
- 8. Asia Pacific Pantograph Bus Charger Market Analysis, Insights and Forecast, 2019-2031
- 8.1. Market Analysis, Insights and Forecast - by Charging Type
- 8.1.1. Level 1
- 8.1.2. Level 2
- 8.1.3. Direct Current Fast Charging
- 8.2. Market Analysis, Insights and Forecast - by Pcomponent Type
- 8.2.1. Hardware
- 8.2.2. Software
- 8.3. Market Analysis, Insights and Forecast - by Charging Infrastructure Type
- 8.3.1. Off-board top-down pantograph
- 8.3.2. On-Board Bottom-Up Pantograph
- 8.1. Market Analysis, Insights and Forecast - by Charging Type
- 9. South America Pantograph Bus Charger Market Analysis, Insights and Forecast, 2019-2031
- 9.1. Market Analysis, Insights and Forecast - by Charging Type
- 9.1.1. Level 1
- 9.1.2. Level 2
- 9.1.3. Direct Current Fast Charging
- 9.2. Market Analysis, Insights and Forecast - by Pcomponent Type
- 9.2.1. Hardware
- 9.2.2. Software
- 9.3. Market Analysis, Insights and Forecast - by Charging Infrastructure Type
- 9.3.1. Off-board top-down pantograph
- 9.3.2. On-Board Bottom-Up Pantograph
- 9.1. Market Analysis, Insights and Forecast - by Charging Type
- 10. Middle East and Africa Pantograph Bus Charger Market Analysis, Insights and Forecast, 2019-2031
- 10.1. Market Analysis, Insights and Forecast - by Charging Type
- 10.1.1. Level 1
- 10.1.2. Level 2
- 10.1.3. Direct Current Fast Charging
- 10.2. Market Analysis, Insights and Forecast - by Pcomponent Type
- 10.2.1. Hardware
- 10.2.2. Software
- 10.3. Market Analysis, Insights and Forecast - by Charging Infrastructure Type
- 10.3.1. Off-board top-down pantograph
- 10.3.2. On-Board Bottom-Up Pantograph
- 10.1. Market Analysis, Insights and Forecast - by Charging Type
- 11. North America Pantograph Bus Charger Market Analysis, Insights and Forecast, 2019-2031
- 11.1. Market Analysis, Insights and Forecast - By Country/Sub-region
- 11.1.1 United States
- 11.1.2 Canada
- 11.1.3 Rest of North America
- 12. Europe Pantograph Bus Charger Market Analysis, Insights and Forecast, 2019-2031
- 12.1. Market Analysis, Insights and Forecast - By Country/Sub-region
- 12.1.1 Germany
- 12.1.2 United Kingdom
- 12.1.3 France
- 12.1.4 Italy
- 12.1.5 Spain
- 12.1.6 Rest of Europe
- 13. Asia Pacific Pantograph Bus Charger Market Analysis, Insights and Forecast, 2019-2031
- 13.1. Market Analysis, Insights and Forecast - By Country/Sub-region
- 13.1.1 India
- 13.1.2 China
- 13.1.3 South Korea
- 13.1.4 Japan
- 13.1.5 Rest of Asia Pacific
- 14. South America Pantograph Bus Charger Market Analysis, Insights and Forecast, 2019-2031
- 14.1. Market Analysis, Insights and Forecast - By Country/Sub-region
- 14.1.1 Brazil
- 14.1.2 Aegentina
- 14.1.3 Rest of the South America
- 15. Middle East and Africa Pantograph Bus Charger Market Analysis, Insights and Forecast, 2019-2031
- 15.1. Market Analysis, Insights and Forecast - By Country/Sub-region
- 15.1.1 Saudi Arabia
- 15.1.2 South Africa
- 15.1.3 Rest of the Middle East and Africa
- 16. Competitive Analysis
- 16.1. Global Market Share Analysis 2024
- 16.2. Company Profiles
- 16.2.1 ABB Ltd
- 16.2.1.1. Overview
- 16.2.1.2. Products
- 16.2.1.3. SWOT Analysis
- 16.2.1.4. Recent Developments
- 16.2.1.5. Financials (Based on Availability)
- 16.2.2 Valmont Industries Inc
- 16.2.2.1. Overview
- 16.2.2.2. Products
- 16.2.2.3. SWOT Analysis
- 16.2.2.4. Recent Developments
- 16.2.2.5. Financials (Based on Availability)
- 16.2.3 Siemens Mobility
- 16.2.3.1. Overview
- 16.2.3.2. Products
- 16.2.3.3. SWOT Analysis
- 16.2.3.4. Recent Developments
- 16.2.3.5. Financials (Based on Availability)
- 16.2.4 SCHUNK GmbH & Co KG
- 16.2.4.1. Overview
- 16.2.4.2. Products
- 16.2.4.3. SWOT Analysis
- 16.2.4.4. Recent Developments
- 16.2.4.5. Financials (Based on Availability)
- 16.2.5 Comeca Grou
- 16.2.5.1. Overview
- 16.2.5.2. Products
- 16.2.5.3. SWOT Analysis
- 16.2.5.4. Recent Developments
- 16.2.5.5. Financials (Based on Availability)
- 16.2.6 Schunk Transit Systems GmBH
- 16.2.6.1. Overview
- 16.2.6.2. Products
- 16.2.6.3. SWOT Analysis
- 16.2.6.4. Recent Developments
- 16.2.6.5. Financials (Based on Availability)
- 16.2.7 Wabtech Corporation
- 16.2.7.1. Overview
- 16.2.7.2. Products
- 16.2.7.3. SWOT Analysis
- 16.2.7.4. Recent Developments
- 16.2.7.5. Financials (Based on Availability)
- 16.2.8 Vector Informatik GmbH
- 16.2.8.1. Overview
- 16.2.8.2. Products
- 16.2.8.3. SWOT Analysis
- 16.2.8.4. Recent Developments
- 16.2.8.5. Financials (Based on Availability)
- 16.2.9 SETEC Power
- 16.2.9.1. Overview
- 16.2.9.2. Products
- 16.2.9.3. SWOT Analysis
- 16.2.9.4. Recent Developments
- 16.2.9.5. Financials (Based on Availability)
- 16.2.1 ABB Ltd
List of Figures
- Figure 1: Global Pantograph Bus Charger Market Revenue Breakdown (Million, %) by Region 2024 & 2032
- Figure 2: North America Pantograph Bus Charger Market Revenue (Million), by Country 2024 & 2032
- Figure 3: North America Pantograph Bus Charger Market Revenue Share (%), by Country 2024 & 2032
- Figure 4: Europe Pantograph Bus Charger Market Revenue (Million), by Country 2024 & 2032
- Figure 5: Europe Pantograph Bus Charger Market Revenue Share (%), by Country 2024 & 2032
- Figure 6: Asia Pacific Pantograph Bus Charger Market Revenue (Million), by Country 2024 & 2032
- Figure 7: Asia Pacific Pantograph Bus Charger Market Revenue Share (%), by Country 2024 & 2032
- Figure 8: South America Pantograph Bus Charger Market Revenue (Million), by Country 2024 & 2032
- Figure 9: South America Pantograph Bus Charger Market Revenue Share (%), by Country 2024 & 2032
- Figure 10: Middle East and Africa Pantograph Bus Charger Market Revenue (Million), by Country 2024 & 2032
- Figure 11: Middle East and Africa Pantograph Bus Charger Market Revenue Share (%), by Country 2024 & 2032
- Figure 12: North America Pantograph Bus Charger Market Revenue (Million), by Charging Type 2024 & 2032
- Figure 13: North America Pantograph Bus Charger Market Revenue Share (%), by Charging Type 2024 & 2032
- Figure 14: North America Pantograph Bus Charger Market Revenue (Million), by Pcomponent Type 2024 & 2032
- Figure 15: North America Pantograph Bus Charger Market Revenue Share (%), by Pcomponent Type 2024 & 2032
- Figure 16: North America Pantograph Bus Charger Market Revenue (Million), by Charging Infrastructure Type 2024 & 2032
- Figure 17: North America Pantograph Bus Charger Market Revenue Share (%), by Charging Infrastructure Type 2024 & 2032
- Figure 18: North America Pantograph Bus Charger Market Revenue (Million), by Country 2024 & 2032
- Figure 19: North America Pantograph Bus Charger Market Revenue Share (%), by Country 2024 & 2032
- Figure 20: Europe Pantograph Bus Charger Market Revenue (Million), by Charging Type 2024 & 2032
- Figure 21: Europe Pantograph Bus Charger Market Revenue Share (%), by Charging Type 2024 & 2032
- Figure 22: Europe Pantograph Bus Charger Market Revenue (Million), by Pcomponent Type 2024 & 2032
- Figure 23: Europe Pantograph Bus Charger Market Revenue Share (%), by Pcomponent Type 2024 & 2032
- Figure 24: Europe Pantograph Bus Charger Market Revenue (Million), by Charging Infrastructure Type 2024 & 2032
- Figure 25: Europe Pantograph Bus Charger Market Revenue Share (%), by Charging Infrastructure Type 2024 & 2032
- Figure 26: Europe Pantograph Bus Charger Market Revenue (Million), by Country 2024 & 2032
- Figure 27: Europe Pantograph Bus Charger Market Revenue Share (%), by Country 2024 & 2032
- Figure 28: Asia Pacific Pantograph Bus Charger Market Revenue (Million), by Charging Type 2024 & 2032
- Figure 29: Asia Pacific Pantograph Bus Charger Market Revenue Share (%), by Charging Type 2024 & 2032
- Figure 30: Asia Pacific Pantograph Bus Charger Market Revenue (Million), by Pcomponent Type 2024 & 2032
- Figure 31: Asia Pacific Pantograph Bus Charger Market Revenue Share (%), by Pcomponent Type 2024 & 2032
- Figure 32: Asia Pacific Pantograph Bus Charger Market Revenue (Million), by Charging Infrastructure Type 2024 & 2032
- Figure 33: Asia Pacific Pantograph Bus Charger Market Revenue Share (%), by Charging Infrastructure Type 2024 & 2032
- Figure 34: Asia Pacific Pantograph Bus Charger Market Revenue (Million), by Country 2024 & 2032
- Figure 35: Asia Pacific Pantograph Bus Charger Market Revenue Share (%), by Country 2024 & 2032
- Figure 36: South America Pantograph Bus Charger Market Revenue (Million), by Charging Type 2024 & 2032
- Figure 37: South America Pantograph Bus Charger Market Revenue Share (%), by Charging Type 2024 & 2032
- Figure 38: South America Pantograph Bus Charger Market Revenue (Million), by Pcomponent Type 2024 & 2032
- Figure 39: South America Pantograph Bus Charger Market Revenue Share (%), by Pcomponent Type 2024 & 2032
- Figure 40: South America Pantograph Bus Charger Market Revenue (Million), by Charging Infrastructure Type 2024 & 2032
- Figure 41: South America Pantograph Bus Charger Market Revenue Share (%), by Charging Infrastructure Type 2024 & 2032
- Figure 42: South America Pantograph Bus Charger Market Revenue (Million), by Country 2024 & 2032
- Figure 43: South America Pantograph Bus Charger Market Revenue Share (%), by Country 2024 & 2032
- Figure 44: Middle East and Africa Pantograph Bus Charger Market Revenue (Million), by Charging Type 2024 & 2032
- Figure 45: Middle East and Africa Pantograph Bus Charger Market Revenue Share (%), by Charging Type 2024 & 2032
- Figure 46: Middle East and Africa Pantograph Bus Charger Market Revenue (Million), by Pcomponent Type 2024 & 2032
- Figure 47: Middle East and Africa Pantograph Bus Charger Market Revenue Share (%), by Pcomponent Type 2024 & 2032
- Figure 48: Middle East and Africa Pantograph Bus Charger Market Revenue (Million), by Charging Infrastructure Type 2024 & 2032
- Figure 49: Middle East and Africa Pantograph Bus Charger Market Revenue Share (%), by Charging Infrastructure Type 2024 & 2032
- Figure 50: Middle East and Africa Pantograph Bus Charger Market Revenue (Million), by Country 2024 & 2032
- Figure 51: Middle East and Africa Pantograph Bus Charger Market Revenue Share (%), by Country 2024 & 2032
List of Tables
- Table 1: Global Pantograph Bus Charger Market Revenue Million Forecast, by Region 2019 & 2032
- Table 2: Global Pantograph Bus Charger Market Revenue Million Forecast, by Charging Type 2019 & 2032
- Table 3: Global Pantograph Bus Charger Market Revenue Million Forecast, by Pcomponent Type 2019 & 2032
- Table 4: Global Pantograph Bus Charger Market Revenue Million Forecast, by Charging Infrastructure Type 2019 & 2032
- Table 5: Global Pantograph Bus Charger Market Revenue Million Forecast, by Region 2019 & 2032
- Table 6: Global Pantograph Bus Charger Market Revenue Million Forecast, by Country 2019 & 2032
- Table 7: United States Pantograph Bus Charger Market Revenue (Million) Forecast, by Application 2019 & 2032
- Table 8: Canada Pantograph Bus Charger Market Revenue (Million) Forecast, by Application 2019 & 2032
- Table 9: Rest of North America Pantograph Bus Charger Market Revenue (Million) Forecast, by Application 2019 & 2032
- Table 10: Global Pantograph Bus Charger Market Revenue Million Forecast, by Country 2019 & 2032
- Table 11: Germany Pantograph Bus Charger Market Revenue (Million) Forecast, by Application 2019 & 2032
- Table 12: United Kingdom Pantograph Bus Charger Market Revenue (Million) Forecast, by Application 2019 & 2032
- Table 13: France Pantograph Bus Charger Market Revenue (Million) Forecast, by Application 2019 & 2032
- Table 14: Italy Pantograph Bus Charger Market Revenue (Million) Forecast, by Application 2019 & 2032
- Table 15: Spain Pantograph Bus Charger Market Revenue (Million) Forecast, by Application 2019 & 2032
- Table 16: Rest of Europe Pantograph Bus Charger Market Revenue (Million) Forecast, by Application 2019 & 2032
- Table 17: Global Pantograph Bus Charger Market Revenue Million Forecast, by Country 2019 & 2032
- Table 18: India Pantograph Bus Charger Market Revenue (Million) Forecast, by Application 2019 & 2032
- Table 19: China Pantograph Bus Charger Market Revenue (Million) Forecast, by Application 2019 & 2032
- Table 20: South Korea Pantograph Bus Charger Market Revenue (Million) Forecast, by Application 2019 & 2032
- Table 21: Japan Pantograph Bus Charger Market Revenue (Million) Forecast, by Application 2019 & 2032
- Table 22: Rest of Asia Pacific Pantograph Bus Charger Market Revenue (Million) Forecast, by Application 2019 & 2032
- Table 23: Global Pantograph Bus Charger Market Revenue Million Forecast, by Country 2019 & 2032
- Table 24: Brazil Pantograph Bus Charger Market Revenue (Million) Forecast, by Application 2019 & 2032
- Table 25: Aegentina Pantograph Bus Charger Market Revenue (Million) Forecast, by Application 2019 & 2032
- Table 26: Rest of the South America Pantograph Bus Charger Market Revenue (Million) Forecast, by Application 2019 & 2032
- Table 27: Global Pantograph Bus Charger Market Revenue Million Forecast, by Country 2019 & 2032
- Table 28: Saudi Arabia Pantograph Bus Charger Market Revenue (Million) Forecast, by Application 2019 & 2032
- Table 29: South Africa Pantograph Bus Charger Market Revenue (Million) Forecast, by Application 2019 & 2032
- Table 30: Rest of the Middle East and Africa Pantograph Bus Charger Market Revenue (Million) Forecast, by Application 2019 & 2032
- Table 31: Global Pantograph Bus Charger Market Revenue Million Forecast, by Charging Type 2019 & 2032
- Table 32: Global Pantograph Bus Charger Market Revenue Million Forecast, by Pcomponent Type 2019 & 2032
- Table 33: Global Pantograph Bus Charger Market Revenue Million Forecast, by Charging Infrastructure Type 2019 & 2032
- Table 34: Global Pantograph Bus Charger Market Revenue Million Forecast, by Country 2019 & 2032
- Table 35: United States Pantograph Bus Charger Market Revenue (Million) Forecast, by Application 2019 & 2032
- Table 36: Canada Pantograph Bus Charger Market Revenue (Million) Forecast, by Application 2019 & 2032
- Table 37: Rest of North America Pantograph Bus Charger Market Revenue (Million) Forecast, by Application 2019 & 2032
- Table 38: Global Pantograph Bus Charger Market Revenue Million Forecast, by Charging Type 2019 & 2032
- Table 39: Global Pantograph Bus Charger Market Revenue Million Forecast, by Pcomponent Type 2019 & 2032
- Table 40: Global Pantograph Bus Charger Market Revenue Million Forecast, by Charging Infrastructure Type 2019 & 2032
- Table 41: Global Pantograph Bus Charger Market Revenue Million Forecast, by Country 2019 & 2032
- Table 42: Germany Pantograph Bus Charger Market Revenue (Million) Forecast, by Application 2019 & 2032
- Table 43: United Kingdom Pantograph Bus Charger Market Revenue (Million) Forecast, by Application 2019 & 2032
- Table 44: France Pantograph Bus Charger Market Revenue (Million) Forecast, by Application 2019 & 2032
- Table 45: Italy Pantograph Bus Charger Market Revenue (Million) Forecast, by Application 2019 & 2032
- Table 46: Spain Pantograph Bus Charger Market Revenue (Million) Forecast, by Application 2019 & 2032
- Table 47: Rest of Europe Pantograph Bus Charger Market Revenue (Million) Forecast, by Application 2019 & 2032
- Table 48: Global Pantograph Bus Charger Market Revenue Million Forecast, by Charging Type 2019 & 2032
- Table 49: Global Pantograph Bus Charger Market Revenue Million Forecast, by Pcomponent Type 2019 & 2032
- Table 50: Global Pantograph Bus Charger Market Revenue Million Forecast, by Charging Infrastructure Type 2019 & 2032
- Table 51: Global Pantograph Bus Charger Market Revenue Million Forecast, by Country 2019 & 2032
- Table 52: India Pantograph Bus Charger Market Revenue (Million) Forecast, by Application 2019 & 2032
- Table 53: China Pantograph Bus Charger Market Revenue (Million) Forecast, by Application 2019 & 2032
- Table 54: South Korea Pantograph Bus Charger Market Revenue (Million) Forecast, by Application 2019 & 2032
- Table 55: Japan Pantograph Bus Charger Market Revenue (Million) Forecast, by Application 2019 & 2032
- Table 56: Rest of Asia Pacific Pantograph Bus Charger Market Revenue (Million) Forecast, by Application 2019 & 2032
- Table 57: Global Pantograph Bus Charger Market Revenue Million Forecast, by Charging Type 2019 & 2032
- Table 58: Global Pantograph Bus Charger Market Revenue Million Forecast, by Pcomponent Type 2019 & 2032
- Table 59: Global Pantograph Bus Charger Market Revenue Million Forecast, by Charging Infrastructure Type 2019 & 2032
- Table 60: Global Pantograph Bus Charger Market Revenue Million Forecast, by Country 2019 & 2032
- Table 61: Brazil Pantograph Bus Charger Market Revenue (Million) Forecast, by Application 2019 & 2032
- Table 62: Aegentina Pantograph Bus Charger Market Revenue (Million) Forecast, by Application 2019 & 2032
- Table 63: Rest of the South America Pantograph Bus Charger Market Revenue (Million) Forecast, by Application 2019 & 2032
- Table 64: Global Pantograph Bus Charger Market Revenue Million Forecast, by Charging Type 2019 & 2032
- Table 65: Global Pantograph Bus Charger Market Revenue Million Forecast, by Pcomponent Type 2019 & 2032
- Table 66: Global Pantograph Bus Charger Market Revenue Million Forecast, by Charging Infrastructure Type 2019 & 2032
- Table 67: Global Pantograph Bus Charger Market Revenue Million Forecast, by Country 2019 & 2032
- Table 68: Saudi Arabia Pantograph Bus Charger Market Revenue (Million) Forecast, by Application 2019 & 2032
- Table 69: South Africa Pantograph Bus Charger Market Revenue (Million) Forecast, by Application 2019 & 2032
- Table 70: Rest of the Middle East and Africa Pantograph Bus Charger Market Revenue (Million) Forecast, by Application 2019 & 2032
Frequently Asked Questions
1. What is the projected Compound Annual Growth Rate (CAGR) of the Pantograph Bus Charger Market?
The projected CAGR is approximately 24.65%.
2. Which companies are prominent players in the Pantograph Bus Charger Market?
Key companies in the market include ABB Ltd, Valmont Industries Inc, Siemens Mobility, SCHUNK GmbH & Co KG, Comeca Grou, Schunk Transit Systems GmBH, Wabtech Corporation, Vector Informatik GmbH, SETEC Power.
3. What are the main segments of the Pantograph Bus Charger Market?
The market segments include Charging Type, Pcomponent Type, Charging Infrastructure Type.
4. Can you provide details about the market size?
The market size is estimated to be USD 2.78 Million as of 2022.
5. What are some drivers contributing to market growth?
Rise in Vehicle Sale.
6. What are the notable trends driving market growth?
Rising Emphasis of Government on Eco-Friendly Buses.
7. Are there any restraints impacting market growth?
Increase in demand for Electric Vehicles.
8. Can you provide examples of recent developments in the market?
August 2022: British bus company First Bus ordered 193 electric buses worth GBP 81 million (~USD 96.4 million) from Northern Irish bus manufacturer Wrightbus. Furthermore, the company initially specifies the DC charging power at 150 kW and optional opportunity charging at 450 kW through pantograph options.
9. What pricing options are available for accessing the report?
Pricing options include single-user, multi-user, and enterprise licenses priced at USD 4750, USD 5250, and USD 8750 respectively.
10. Is the market size provided in terms of value or volume?
The market size is provided in terms of value, measured in Million.
11. Are there any specific market keywords associated with the report?
Yes, the market keyword associated with the report is "Pantograph Bus Charger Market," which aids in identifying and referencing the specific market segment covered.
12. How do I determine which pricing option suits my needs best?
The pricing options vary based on user requirements and access needs. Individual users may opt for single-user licenses, while businesses requiring broader access may choose multi-user or enterprise licenses for cost-effective access to the report.
13. Are there any additional resources or data provided in the Pantograph Bus Charger Market report?
While the report offers comprehensive insights, it's advisable to review the specific contents or supplementary materials provided to ascertain if additional resources or data are available.
14. How can I stay updated on further developments or reports in the Pantograph Bus Charger Market?
To stay informed about further developments, trends, and reports in the Pantograph Bus Charger Market, consider subscribing to industry newsletters, following relevant companies and organizations, or regularly checking reputable industry news sources and publications.
Methodology
Step 1 - Identification of Relevant Samples Size from Population Database


Step 2 - Approaches for Defining Global Market Size (Value, Volume* & Price*)

Note*: In applicable scenarios
Step 3 - Data Sources
Primary Research
- Web Analytics
- Survey Reports
- Research Institute
- Latest Research Reports
- Opinion Leaders
Secondary Research
- Annual Reports
- White Paper
- Latest Press Release
- Industry Association
- Paid Database
- Investor Presentations

Step 4 - Data Triangulation
Involves using different sources of information in order to increase the validity of a study
These sources are likely to be stakeholders in a program - participants, other researchers, program staff, other community members, and so on.
Then we put all data in single framework & apply various statistical tools to find out the dynamic on the market.
During the analysis stage, feedback from the stakeholder groups would be compared to determine areas of agreement as well as areas of divergence


