

Key Insights
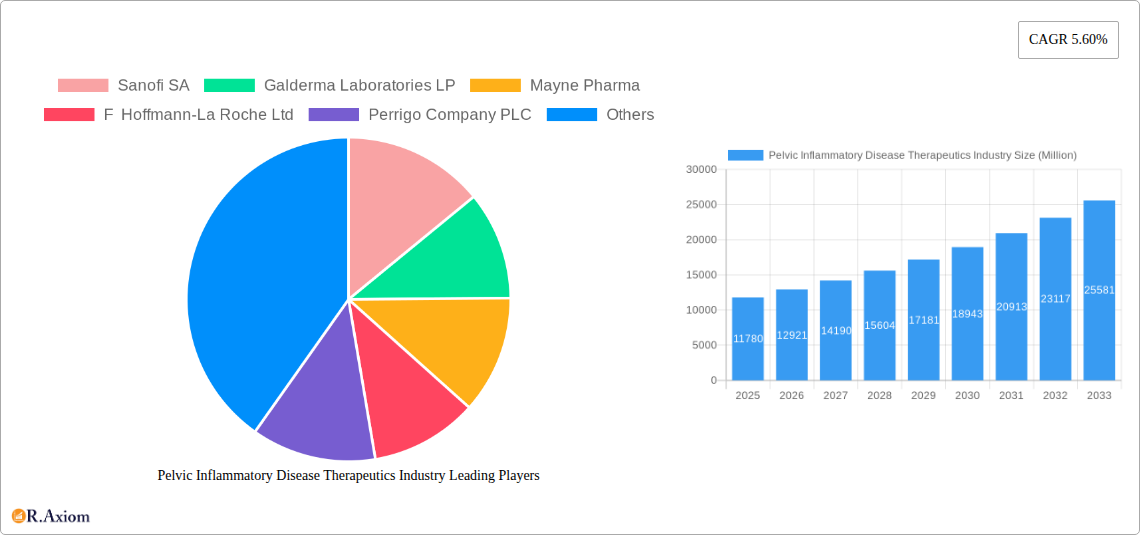
The Pelvic Inflammatory Disease (PID) Therapeutics Market is poised for significant expansion, projected to reach an estimated $11.78 billion by 2025, demonstrating robust growth with a projected Compound Annual Growth Rate (CAGR) of 10.83% through 2033. This dynamic market is primarily driven by the increasing incidence of sexually transmitted infections (STIs) that are the leading cause of PID, coupled with a growing awareness of the long-term health complications associated with untreated infections, such as infertility and ectopic pregnancies. Advances in diagnostic tools and a greater emphasis on early intervention are further bolstering market growth. The pharmaceutical industry's focus on developing more effective and targeted antibiotic treatments, including novel formulations and combination therapies, is a key trend shaping the market landscape. Furthermore, the rising healthcare expenditure in developing economies and improved access to healthcare services are creating new avenues for market penetration and growth.
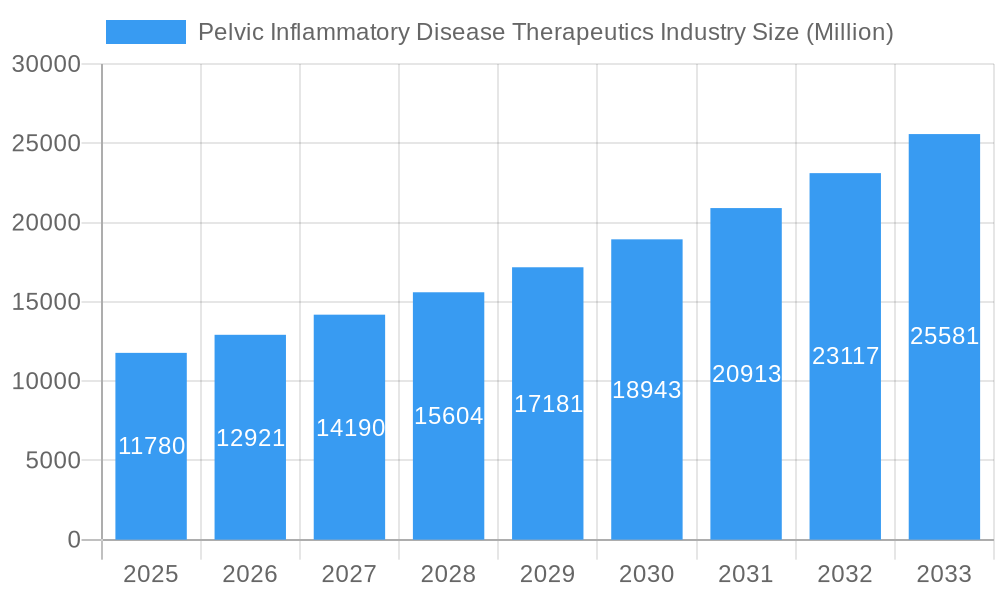
Pelvic Inflammatory Disease Therapeutics Industry Market Size (In Billion)
The market is segmented across various drug classes, including Macrolides, Tetracycline, Beta-lactam, and Nitroimidazoles, each playing a crucial role in treating different types and severities of PID. Oral administration remains the predominant route, though parenteral routes are critical for severe cases. Distribution channels are diverse, with hospital pharmacies serving a significant portion due to the acute nature of some PID cases, alongside retail and online pharmacies catering to broader patient access. Geographically, North America and Europe currently dominate the market, owing to advanced healthcare infrastructures and high prevalence rates. However, the Asia Pacific region is expected to witness substantial growth driven by increasing awareness, improving healthcare access, and a rising incidence of STIs. Despite this positive outlook, challenges such as antibiotic resistance and the potential for drug side effects need to be strategically addressed to ensure sustained market progress and optimal patient outcomes.
Pelvic Inflammatory Disease Therapeutics Industry Company Market Share
Pelvic Inflammatory Disease Therapeutics Industry Market Concentration & Innovation
The Pelvic Inflammatory Disease (PID) therapeutics market is characterized by a moderate level of concentration, with key players like Sanofi SA, Pfizer Inc., and AstraZeneca holding significant market shares, estimated to be over 15% collectively. Innovation within the industry is primarily driven by ongoing research and development into novel antibiotic formulations and combination therapies to combat rising antimicrobial resistance (AMR), a critical concern in PID treatment. Regulatory frameworks, established by bodies such as the USFDA and EMA, play a pivotal role in drug approval processes, influencing the pace of innovation and market entry for new therapeutics. While direct product substitutes are limited, the availability of alternative treatment approaches, including surgical interventions for severe cases and a growing emphasis on preventative measures, influences market dynamics. End-user trends are shifting towards demand for more effective and less invasive treatment options, alongside increased awareness about STIs as a primary cause of PID. Mergers and acquisitions (M&A) activities, while not as prevalent as in other pharmaceutical sectors, have seen strategic partnerships and acquisitions aimed at consolidating portfolios and expanding geographic reach. For instance, past M&A deals in related antimicrobial markets have reached values in the hundreds of billions, signaling potential for significant transactions in the PID space.
Pelvic Inflammatory Disease Therapeutics Industry Industry Trends & Insights
The global Pelvic Inflammatory Disease (PID) therapeutics market is experiencing robust growth, projected to expand at a Compound Annual Growth Rate (CAGR) of approximately 5.8% from 2025 to 2033, reaching an estimated market size of over $12 billion by 2033. This growth is fueled by a confluence of factors, including a rising incidence of STIs globally, increased awareness and diagnosis of PID, and advancements in pharmaceutical research and development. The persistent challenge of antimicrobial resistance (AMR) is a significant driver for innovation, pushing pharmaceutical companies to develop new and more potent antibiotic regimens. Technological disruptions are emerging in diagnostics, enabling earlier and more accurate identification of PID, which in turn stimulates demand for effective treatments. Furthermore, evolving consumer preferences are leaning towards treatments that offer improved efficacy, reduced side effects, and greater convenience.
The competitive landscape is dynamic, with both established pharmaceutical giants and emerging biotech firms vying for market share. Companies are increasingly focusing on developing broad-spectrum antibiotics and targeted therapies to address the diverse range of causative agents of PID. Market penetration is expected to deepen as healthcare infrastructure improves in developing economies, leading to better access to diagnosis and treatment. The integration of digital health solutions and telemedicine is also poised to play a crucial role in enhancing patient access to consultations and prescription management, further driving market expansion. The economic impact of untreated or inadequately treated PID, including long-term complications like infertility and chronic pelvic pain, underscores the critical need for effective therapeutic interventions, thereby reinforcing market growth trajectory. Ongoing clinical trials and a pipeline of promising drug candidates suggest continued innovation and market expansion in the coming years.
Dominant Markets & Segments in Pelvic Inflammatory Disease Therapeutics Industry
The Pelvic Inflammatory Disease (PID) therapeutics market exhibits significant dominance across various segments, driven by distinct regional, demographic, and therapeutic characteristics.
Leading Region & Country: North America, particularly the United States, currently holds the largest market share, estimated to be over 30% of the global market. This dominance is attributed to high healthcare expenditure, advanced diagnostic capabilities, strong regulatory oversight, and a well-established pharmaceutical industry. Favorable reimbursement policies and increasing public awareness regarding sexual health and PID contribute to sustained demand.
Dominant Drug Class: Macrolides are a leading drug class in the PID therapeutics market, often forming the backbone of empirical treatment regimens due to their broad spectrum of activity against common pathogens like Chlamydia trachomatis and Neisseria gonorrhoeae. The projected market share for Macrolides is estimated to be around 25% of the total drug class segment.
- Key Drivers:
- Established efficacy against prevalent PID-causing bacteria.
- Availability of generic formulations, ensuring affordability.
- Recommended first-line treatment by major clinical guidelines.
Dominant Route of Administration: The Oral route of administration is the most prevalent for outpatient management of PID, making it a dominant segment. This preference stems from patient convenience and cost-effectiveness.
- Key Drivers:
- Ease of patient compliance and adherence to treatment.
- Lower treatment costs compared to parenteral administration.
- Suitability for mild to moderate PID cases.
Dominant Distribution Channel: Retail Pharmacies represent the largest distribution channel for PID therapeutics, catering to the widespread outpatient prescriptions.
- Key Drivers:
- Accessibility for the general population.
- Established infrastructure for dispensing prescription medications.
- Integration with primary care physician networks.
Segment Analysis:
- Tetracycline: Another crucial drug class, often used in combination therapy or for patients with macrolide allergies. Its market share is anticipated to be around 20%.
- Beta-lactam: While sometimes used, particularly for certain resistant strains or specific organisms, Beta-lactams are not always the primary choice for empirical PID treatment due to potential resistance patterns. Their market share is estimated at 15%.
- Nitroimidazoles: Essential for covering anaerobic bacteria commonly involved in PID, particularly in more severe or chronic cases. This segment is expected to hold approximately 10% market share.
- Other Drug Classes: This includes clindamycin, metronidazole, and other agents, accounting for the remaining 30% of the drug class segment, often used in specific treatment protocols.
- Parenteral: Primarily utilized for inpatient management of severe PID or when oral administration is not feasible. This segment is projected to be around 35% of the routes of administration market.
- Other Routes of Administration: Encompasses vaginal or topical applications, which are less common for systemic PID treatment. This segment is estimated at 5%.
- Hospital Pharmacies: Crucial for inpatient treatments and management of complicated PID cases. This channel is expected to capture 40% of the distribution market.
- Online Pharmacies: A rapidly growing segment, offering convenience and wider accessibility, especially in regions with limited physical pharmacy access. This channel's market share is projected to reach 15% and is expected to grow significantly.
Pelvic Inflammatory Disease Therapeutics Industry Product Developments
The Pelvic Inflammatory Disease (PID) therapeutics market is witnessing product developments focused on enhanced efficacy against resistant pathogens and improved patient compliance. Innovations include the development of novel antibiotic combinations designed to broaden the spectrum of activity and overcome existing resistance mechanisms. Furthermore, research is exploring alternative drug delivery systems and formulations that could offer more sustained release, potentially reducing dosing frequency and improving adherence. The competitive advantage lies in therapies that demonstrate superior clinical outcomes, reduced side effect profiles, and adaptability to evolving resistance patterns, addressing the unmet needs of clinicians and patients alike.
Report Scope & Segmentation Analysis
This comprehensive report analyzes the Pelvic Inflammatory Disease (PID) therapeutics market across key segments, providing granular insights into market dynamics, growth projections, and competitive landscapes. The segmentation includes:
- Drug Class: Macrolides, Tetracycline, Beta-lactam, Nitroimidazoles, and Other Drug Classes. Each class is analyzed for its current market share, growth drivers, and projected evolution, with Macrolides and Tetracyclines expected to maintain a dominant position.
- Route of Administration: Oral, Parenteral, and Other Routes of Administration. The oral segment is anticipated to lead due to patient convenience, while parenteral administration remains critical for severe cases.
- Distribution Channel: Hospital Pharmacies, Retail Pharmacies, and Online Pharmacies. Retail pharmacies are expected to hold a significant share, with online pharmacies showing robust growth potential.
The analysis includes market sizes for each segment, detailed growth projections from 2025 to 2033, and an assessment of competitive dynamics within each category, offering stakeholders a clear understanding of market opportunities and strategic positioning.
Key Drivers of Pelvic Inflammatory Disease Therapeutics Industry Growth
The growth of the Pelvic Inflammatory Disease (PID) therapeutics market is propelled by several key factors. A primary driver is the escalating global incidence of sexually transmitted infections (STIs) such as Chlamydia and Gonorrhea, which are the leading causes of PID. Increased awareness and improved diagnostic capabilities are leading to earlier detection and consequently, a greater demand for effective antimicrobial treatments. Technological advancements in drug discovery and development are enabling the creation of novel antibiotic formulations with improved efficacy against resistant strains, addressing a critical unmet need. Furthermore, favorable regulatory environments in developed nations expedite the approval process for new therapies. Economic factors, including rising healthcare expenditure and insurance coverage for reproductive health services, also contribute significantly to market expansion.
Challenges in the Pelvic Inflammatory Disease Therapeutics Industry Sector
Despite the promising growth trajectory, the Pelvic Inflammatory Disease (PID) therapeutics industry faces several significant challenges. Antimicrobial resistance (AMR) remains a paramount concern, with existing antibiotics becoming less effective against increasingly resilient pathogens, necessitating the development of novel treatment strategies. The high cost and lengthy duration of antibiotic resistance research and development, coupled with stringent regulatory hurdles for drug approval, can deter investment and slow down the introduction of new therapies. Fluctuating antibiotic stewardship practices and concerns about over-prescription can also impact market dynamics. Furthermore, economic disparities in healthcare access and affordability in certain regions limit the penetration of advanced PID treatments. Intense competition from generic drug manufacturers can also exert downward pressure on pricing and profit margins for innovative products.
Emerging Opportunities in Pelvic Inflammatory Disease Therapeutics Industry
The Pelvic Inflammatory Disease (PID) therapeutics market presents several emerging opportunities for growth and innovation. The development of novel antimicrobial agents and combination therapies that effectively combat resistant strains of bacteria, particularly multi-drug resistant Neisseria gonorrhoeae, represents a significant opportunity. Advances in diagnostics, including rapid point-of-care tests for STIs, can facilitate earlier and more targeted treatment of PID, boosting demand for effective therapeutics. The increasing focus on preventative strategies and public health campaigns aimed at reducing STI transmission can indirectly drive the need for robust treatment protocols for those who do contract infections. Furthermore, the growing adoption of telemedicine and digital health platforms offers opportunities for improved patient monitoring, adherence support, and wider access to specialist consultations, particularly in underserved areas. Expansion into emerging markets with increasing healthcare infrastructure and rising awareness of reproductive health issues also presents substantial growth potential.
Leading Players in the Pelvic Inflammatory Disease Therapeutics Industry Market
- Sanofi SA
- Galderma Laboratories LP
- Mayne Pharma
- F Hoffmann-La Roche Ltd
- Perrigo Company PLC
- Janssen Pharmaceuticals Inc (Johnson and Johnson)
- AstraZeneca
- Teligent Inc
- Viatris
- Bristol-Myers Squibb Company
- Pfizer Inc
Key Developments in Pelvic Inflammatory Disease Therapeutics Industry Industry
- May 2022: Evofem Biosciences Inc. reported new data from the Phase 3 AMPOWER clinical trial of Phexxi (lactic acid, citric acid, and potassium bitartrate), showing women enrolled in the AMPOWER trial had fewer urinary tract infections (UTIs), compared to the general population.
- Jan 2022: The United States Food and Drug Administration (USFDA) accepted Priority Review for the New Drug Application for tebipenem HBr (tebipenem pivoxil hydrobromide) by Spero Therapeutics for the treatment of adults with complicated urinary tract infections (cUTI), including pyelonephritis, caused by susceptible microorganisms.
Strategic Outlook for Pelvic Inflammatory Disease Therapeutics Industry Market
The strategic outlook for the Pelvic Inflammatory Disease (PID) therapeutics market is characterized by continued innovation and expansion, driven by the persistent need for effective treatments against increasingly resistant pathogens. Pharmaceutical companies are expected to focus on developing novel antimicrobial agents and combination therapies, leveraging advancements in drug discovery and biotechnology. The growing emphasis on public health initiatives to curb STI prevalence and rising awareness among women about PID symptoms will further fuel market demand. Strategic partnerships and collaborations between pharmaceutical firms and diagnostic companies are anticipated to accelerate the development and adoption of integrated diagnostic and therapeutic solutions. Furthermore, the increasing adoption of telemedicine and digital health solutions presents a significant opportunity to enhance patient access to care and improve treatment outcomes, particularly in remote or underserved regions, solidifying a positive growth trajectory for the market.
Pelvic Inflammatory Disease Therapeutics Industry Segmentation
-
1. Drug Class
- 1.1. Macrolides
- 1.2. Tetracycline
- 1.3. Beta-lactam
- 1.4. Nitroimidazoles
- 1.5. Other Drug Classes
-
2. Route of Administration
- 2.1. Oral
- 2.2. Parenteral
- 2.3. Other Routes of Administration
-
3. Distribution Channel
- 3.1. Hospital Pharmacies
- 3.2. Retail Pharmacies
- 3.3. Online Pharmacies
Pelvic Inflammatory Disease Therapeutics Industry Segmentation By Geography
-
1. North America
- 1.1. United States
- 1.2. Canada
- 1.3. Mexico
-
2. Europe
- 2.1. Germany
- 2.2. United Kingdom
- 2.3. France
- 2.4. Italy
- 2.5. Spain
- 2.6. Rest of Europe
-
3. Asia Pacific
- 3.1. China
- 3.2. Japan
- 3.3. India
- 3.4. Australia
- 3.5. South Korea
- 3.6. Rest of Asia Pacific
-
4. Middle East and Africa
- 4.1. GCC
- 4.2. South Africa
- 4.3. Rest of Middle East and Africa
-
5. South America
- 5.1. Brazil
- 5.2. Argentina
- 5.3. Rest of South America
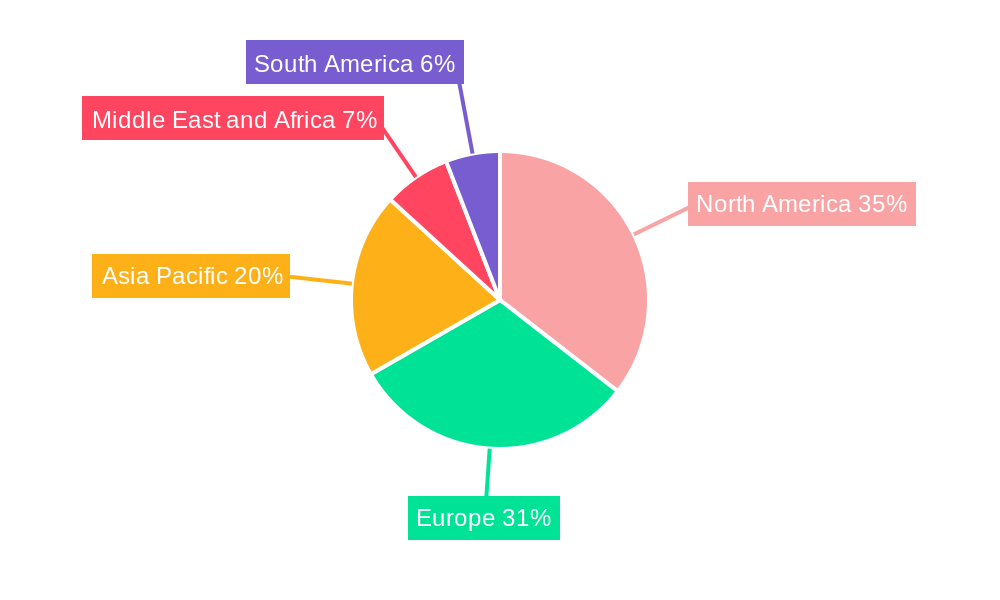
Pelvic Inflammatory Disease Therapeutics Industry Regional Market Share
Geographic Coverage of Pelvic Inflammatory Disease Therapeutics Industry
Pelvic Inflammatory Disease Therapeutics Industry REPORT HIGHLIGHTS
| Aspects | Details |
|---|---|
| Study Period | 2020-2034 |
| Base Year | 2025 |
| Estimated Year | 2026 |
| Forecast Period | 2026-2034 |
| Historical Period | 2020-2025 |
| Growth Rate | CAGR of 3.75% from 2020-2034 |
| Segmentation |
|
Table of Contents
- 1. Introduction
- 1.1. Research Scope
- 1.2. Market Segmentation
- 1.3. Research Objective
- 1.4. Definitions and Assumptions
- 2. Executive Summary
- 2.1. Market Snapshot
- 3. Market Dynamics
- 3.1. Market Drivers
- 3.2. Market Restrains
- 3.3. Market Trends
- 3.4. Market Opportunities
- 4. Market Factor Analysis
- 4.1. Porters Five Forces
- 4.1.1. Bargaining Power of Suppliers
- 4.1.2. Bargaining Power of Buyers
- 4.1.3. Threat of New Entrants
- 4.1.4. Threat of Substitutes
- 4.1.5. Competitive Rivalry
- 4.2. PESTEL analysis
- 4.3. BCG Analysis
- 4.3.1. Stars (High Growth, High Market Share)
- 4.3.2. Cash Cows (Low Growth, High Market Share)
- 4.3.3. Question Mark (High Growth, Low Market Share)
- 4.3.4. Dogs (Low Growth, Low Market Share)
- 4.4. Ansoff Matrix Analysis
- 4.5. Supply Chain Analysis
- 4.6. Regulatory Landscape
- 4.7. Current Market Potential and Opportunity Assessment (TAM–SAM–SOM Framework)
- 4.8. RAX Analyst Note
- 4.1. Porters Five Forces
- 5. Market Analysis, Insights and Forecast 2021-2033
- 5.1. Market Analysis, Insights and Forecast - by Drug Class
- 5.1.1. Macrolides
- 5.1.2. Tetracycline
- 5.1.3. Beta-lactam
- 5.1.4. Nitroimidazoles
- 5.1.5. Other Drug Classes
- 5.2. Market Analysis, Insights and Forecast - by Route of Administration
- 5.2.1. Oral
- 5.2.2. Parenteral
- 5.2.3. Other Routes of Administration
- 5.3. Market Analysis, Insights and Forecast - by Distribution Channel
- 5.3.1. Hospital Pharmacies
- 5.3.2. Retail Pharmacies
- 5.3.3. Online Pharmacies
- 5.4. Market Analysis, Insights and Forecast - by Region
- 5.4.1. North America
- 5.4.2. Europe
- 5.4.3. Asia Pacific
- 5.4.4. Middle East and Africa
- 5.4.5. South America
- 5.1. Market Analysis, Insights and Forecast - by Drug Class
- 6. Global Pelvic Inflammatory Disease Therapeutics Industry Analysis, Insights and Forecast, 2021-2033
- 6.1. Market Analysis, Insights and Forecast - by Drug Class
- 6.1.1. Macrolides
- 6.1.2. Tetracycline
- 6.1.3. Beta-lactam
- 6.1.4. Nitroimidazoles
- 6.1.5. Other Drug Classes
- 6.2. Market Analysis, Insights and Forecast - by Route of Administration
- 6.2.1. Oral
- 6.2.2. Parenteral
- 6.2.3. Other Routes of Administration
- 6.3. Market Analysis, Insights and Forecast - by Distribution Channel
- 6.3.1. Hospital Pharmacies
- 6.3.2. Retail Pharmacies
- 6.3.3. Online Pharmacies
- 6.1. Market Analysis, Insights and Forecast - by Drug Class
- 7. North America Pelvic Inflammatory Disease Therapeutics Industry Analysis, Insights and Forecast, 2020-2032
- 7.1. Market Analysis, Insights and Forecast - by Drug Class
- 7.1.1. Macrolides
- 7.1.2. Tetracycline
- 7.1.3. Beta-lactam
- 7.1.4. Nitroimidazoles
- 7.1.5. Other Drug Classes
- 7.2. Market Analysis, Insights and Forecast - by Route of Administration
- 7.2.1. Oral
- 7.2.2. Parenteral
- 7.2.3. Other Routes of Administration
- 7.3. Market Analysis, Insights and Forecast - by Distribution Channel
- 7.3.1. Hospital Pharmacies
- 7.3.2. Retail Pharmacies
- 7.3.3. Online Pharmacies
- 7.1. Market Analysis, Insights and Forecast - by Drug Class
- 8. Europe Pelvic Inflammatory Disease Therapeutics Industry Analysis, Insights and Forecast, 2020-2032
- 8.1. Market Analysis, Insights and Forecast - by Drug Class
- 8.1.1. Macrolides
- 8.1.2. Tetracycline
- 8.1.3. Beta-lactam
- 8.1.4. Nitroimidazoles
- 8.1.5. Other Drug Classes
- 8.2. Market Analysis, Insights and Forecast - by Route of Administration
- 8.2.1. Oral
- 8.2.2. Parenteral
- 8.2.3. Other Routes of Administration
- 8.3. Market Analysis, Insights and Forecast - by Distribution Channel
- 8.3.1. Hospital Pharmacies
- 8.3.2. Retail Pharmacies
- 8.3.3. Online Pharmacies
- 8.1. Market Analysis, Insights and Forecast - by Drug Class
- 9. Asia Pacific Pelvic Inflammatory Disease Therapeutics Industry Analysis, Insights and Forecast, 2020-2032
- 9.1. Market Analysis, Insights and Forecast - by Drug Class
- 9.1.1. Macrolides
- 9.1.2. Tetracycline
- 9.1.3. Beta-lactam
- 9.1.4. Nitroimidazoles
- 9.1.5. Other Drug Classes
- 9.2. Market Analysis, Insights and Forecast - by Route of Administration
- 9.2.1. Oral
- 9.2.2. Parenteral
- 9.2.3. Other Routes of Administration
- 9.3. Market Analysis, Insights and Forecast - by Distribution Channel
- 9.3.1. Hospital Pharmacies
- 9.3.2. Retail Pharmacies
- 9.3.3. Online Pharmacies
- 9.1. Market Analysis, Insights and Forecast - by Drug Class
- 10. Middle East and Africa Pelvic Inflammatory Disease Therapeutics Industry Analysis, Insights and Forecast, 2020-2032
- 10.1. Market Analysis, Insights and Forecast - by Drug Class
- 10.1.1. Macrolides
- 10.1.2. Tetracycline
- 10.1.3. Beta-lactam
- 10.1.4. Nitroimidazoles
- 10.1.5. Other Drug Classes
- 10.2. Market Analysis, Insights and Forecast - by Route of Administration
- 10.2.1. Oral
- 10.2.2. Parenteral
- 10.2.3. Other Routes of Administration
- 10.3. Market Analysis, Insights and Forecast - by Distribution Channel
- 10.3.1. Hospital Pharmacies
- 10.3.2. Retail Pharmacies
- 10.3.3. Online Pharmacies
- 10.1. Market Analysis, Insights and Forecast - by Drug Class
- 11. South America Pelvic Inflammatory Disease Therapeutics Industry Analysis, Insights and Forecast, 2020-2032
- 11.1. Market Analysis, Insights and Forecast - by Drug Class
- 11.1.1. Macrolides
- 11.1.2. Tetracycline
- 11.1.3. Beta-lactam
- 11.1.4. Nitroimidazoles
- 11.1.5. Other Drug Classes
- 11.2. Market Analysis, Insights and Forecast - by Route of Administration
- 11.2.1. Oral
- 11.2.2. Parenteral
- 11.2.3. Other Routes of Administration
- 11.3. Market Analysis, Insights and Forecast - by Distribution Channel
- 11.3.1. Hospital Pharmacies
- 11.3.2. Retail Pharmacies
- 11.3.3. Online Pharmacies
- 11.1. Market Analysis, Insights and Forecast - by Drug Class
- 12. Competitive Analysis
- 12.1. Company Profiles
- 12.1.1 Sanofi SA
- 12.1.1.1. Company Overview
- 12.1.1.2. Products
- 12.1.1.3. Company Financials
- 12.1.1.4. SWOT Analysis
- 12.1.2 Galderma Laboratories LP
- 12.1.2.1. Company Overview
- 12.1.2.2. Products
- 12.1.2.3. Company Financials
- 12.1.2.4. SWOT Analysis
- 12.1.3 Mayne Pharma
- 12.1.3.1. Company Overview
- 12.1.3.2. Products
- 12.1.3.3. Company Financials
- 12.1.3.4. SWOT Analysis
- 12.1.4 F Hoffmann-La Roche Ltd
- 12.1.4.1. Company Overview
- 12.1.4.2. Products
- 12.1.4.3. Company Financials
- 12.1.4.4. SWOT Analysis
- 12.1.5 Perrigo Company PLC
- 12.1.5.1. Company Overview
- 12.1.5.2. Products
- 12.1.5.3. Company Financials
- 12.1.5.4. SWOT Analysis
- 12.1.6 Janssen Pharmaceuticals Inc (Johnson and Johnson)
- 12.1.6.1. Company Overview
- 12.1.6.2. Products
- 12.1.6.3. Company Financials
- 12.1.6.4. SWOT Analysis
- 12.1.7 AstraZeneca
- 12.1.7.1. Company Overview
- 12.1.7.2. Products
- 12.1.7.3. Company Financials
- 12.1.7.4. SWOT Analysis
- 12.1.8 Teligent Inc
- 12.1.8.1. Company Overview
- 12.1.8.2. Products
- 12.1.8.3. Company Financials
- 12.1.8.4. SWOT Analysis
- 12.1.9 Viatris
- 12.1.9.1. Company Overview
- 12.1.9.2. Products
- 12.1.9.3. Company Financials
- 12.1.9.4. SWOT Analysis
- 12.1.10 Bristol-Myers Squibb Company
- 12.1.10.1. Company Overview
- 12.1.10.2. Products
- 12.1.10.3. Company Financials
- 12.1.10.4. SWOT Analysis
- 12.1.11 Pfizer Inc
- 12.1.11.1. Company Overview
- 12.1.11.2. Products
- 12.1.11.3. Company Financials
- 12.1.11.4. SWOT Analysis
- 12.1.1 Sanofi SA
- 12.2. Market Entropy
- 12.2.1 Company's Key Areas Served
- 12.2.2 Recent Developments
- 12.3. Company Market Share Analysis 2025
- 12.3.1 Top 5 Companies Market Share Analysis
- 12.3.2 Top 3 Companies Market Share Analysis
- 12.4. List of Potential Customers
- 13. Research Methodology
List of Figures
- Figure 1: Global Pelvic Inflammatory Disease Therapeutics Industry Revenue Breakdown (billion, %) by Region 2025 & 2033
- Figure 2: Global Pelvic Inflammatory Disease Therapeutics Industry Volume Breakdown (K Unit, %) by Region 2025 & 2033
- Figure 3: North America Pelvic Inflammatory Disease Therapeutics Industry Revenue (billion), by Drug Class 2025 & 2033
- Figure 4: North America Pelvic Inflammatory Disease Therapeutics Industry Volume (K Unit), by Drug Class 2025 & 2033
- Figure 5: North America Pelvic Inflammatory Disease Therapeutics Industry Revenue Share (%), by Drug Class 2025 & 2033
- Figure 6: North America Pelvic Inflammatory Disease Therapeutics Industry Volume Share (%), by Drug Class 2025 & 2033
- Figure 7: North America Pelvic Inflammatory Disease Therapeutics Industry Revenue (billion), by Route of Administration 2025 & 2033
- Figure 8: North America Pelvic Inflammatory Disease Therapeutics Industry Volume (K Unit), by Route of Administration 2025 & 2033
- Figure 9: North America Pelvic Inflammatory Disease Therapeutics Industry Revenue Share (%), by Route of Administration 2025 & 2033
- Figure 10: North America Pelvic Inflammatory Disease Therapeutics Industry Volume Share (%), by Route of Administration 2025 & 2033
- Figure 11: North America Pelvic Inflammatory Disease Therapeutics Industry Revenue (billion), by Distribution Channel 2025 & 2033
- Figure 12: North America Pelvic Inflammatory Disease Therapeutics Industry Volume (K Unit), by Distribution Channel 2025 & 2033
- Figure 13: North America Pelvic Inflammatory Disease Therapeutics Industry Revenue Share (%), by Distribution Channel 2025 & 2033
- Figure 14: North America Pelvic Inflammatory Disease Therapeutics Industry Volume Share (%), by Distribution Channel 2025 & 2033
- Figure 15: North America Pelvic Inflammatory Disease Therapeutics Industry Revenue (billion), by Country 2025 & 2033
- Figure 16: North America Pelvic Inflammatory Disease Therapeutics Industry Volume (K Unit), by Country 2025 & 2033
- Figure 17: North America Pelvic Inflammatory Disease Therapeutics Industry Revenue Share (%), by Country 2025 & 2033
- Figure 18: North America Pelvic Inflammatory Disease Therapeutics Industry Volume Share (%), by Country 2025 & 2033
- Figure 19: Europe Pelvic Inflammatory Disease Therapeutics Industry Revenue (billion), by Drug Class 2025 & 2033
- Figure 20: Europe Pelvic Inflammatory Disease Therapeutics Industry Volume (K Unit), by Drug Class 2025 & 2033
- Figure 21: Europe Pelvic Inflammatory Disease Therapeutics Industry Revenue Share (%), by Drug Class 2025 & 2033
- Figure 22: Europe Pelvic Inflammatory Disease Therapeutics Industry Volume Share (%), by Drug Class 2025 & 2033
- Figure 23: Europe Pelvic Inflammatory Disease Therapeutics Industry Revenue (billion), by Route of Administration 2025 & 2033
- Figure 24: Europe Pelvic Inflammatory Disease Therapeutics Industry Volume (K Unit), by Route of Administration 2025 & 2033
- Figure 25: Europe Pelvic Inflammatory Disease Therapeutics Industry Revenue Share (%), by Route of Administration 2025 & 2033
- Figure 26: Europe Pelvic Inflammatory Disease Therapeutics Industry Volume Share (%), by Route of Administration 2025 & 2033
- Figure 27: Europe Pelvic Inflammatory Disease Therapeutics Industry Revenue (billion), by Distribution Channel 2025 & 2033
- Figure 28: Europe Pelvic Inflammatory Disease Therapeutics Industry Volume (K Unit), by Distribution Channel 2025 & 2033
- Figure 29: Europe Pelvic Inflammatory Disease Therapeutics Industry Revenue Share (%), by Distribution Channel 2025 & 2033
- Figure 30: Europe Pelvic Inflammatory Disease Therapeutics Industry Volume Share (%), by Distribution Channel 2025 & 2033
- Figure 31: Europe Pelvic Inflammatory Disease Therapeutics Industry Revenue (billion), by Country 2025 & 2033
- Figure 32: Europe Pelvic Inflammatory Disease Therapeutics Industry Volume (K Unit), by Country 2025 & 2033
- Figure 33: Europe Pelvic Inflammatory Disease Therapeutics Industry Revenue Share (%), by Country 2025 & 2033
- Figure 34: Europe Pelvic Inflammatory Disease Therapeutics Industry Volume Share (%), by Country 2025 & 2033
- Figure 35: Asia Pacific Pelvic Inflammatory Disease Therapeutics Industry Revenue (billion), by Drug Class 2025 & 2033
- Figure 36: Asia Pacific Pelvic Inflammatory Disease Therapeutics Industry Volume (K Unit), by Drug Class 2025 & 2033
- Figure 37: Asia Pacific Pelvic Inflammatory Disease Therapeutics Industry Revenue Share (%), by Drug Class 2025 & 2033
- Figure 38: Asia Pacific Pelvic Inflammatory Disease Therapeutics Industry Volume Share (%), by Drug Class 2025 & 2033
- Figure 39: Asia Pacific Pelvic Inflammatory Disease Therapeutics Industry Revenue (billion), by Route of Administration 2025 & 2033
- Figure 40: Asia Pacific Pelvic Inflammatory Disease Therapeutics Industry Volume (K Unit), by Route of Administration 2025 & 2033
- Figure 41: Asia Pacific Pelvic Inflammatory Disease Therapeutics Industry Revenue Share (%), by Route of Administration 2025 & 2033
- Figure 42: Asia Pacific Pelvic Inflammatory Disease Therapeutics Industry Volume Share (%), by Route of Administration 2025 & 2033
- Figure 43: Asia Pacific Pelvic Inflammatory Disease Therapeutics Industry Revenue (billion), by Distribution Channel 2025 & 2033
- Figure 44: Asia Pacific Pelvic Inflammatory Disease Therapeutics Industry Volume (K Unit), by Distribution Channel 2025 & 2033
- Figure 45: Asia Pacific Pelvic Inflammatory Disease Therapeutics Industry Revenue Share (%), by Distribution Channel 2025 & 2033
- Figure 46: Asia Pacific Pelvic Inflammatory Disease Therapeutics Industry Volume Share (%), by Distribution Channel 2025 & 2033
- Figure 47: Asia Pacific Pelvic Inflammatory Disease Therapeutics Industry Revenue (billion), by Country 2025 & 2033
- Figure 48: Asia Pacific Pelvic Inflammatory Disease Therapeutics Industry Volume (K Unit), by Country 2025 & 2033
- Figure 49: Asia Pacific Pelvic Inflammatory Disease Therapeutics Industry Revenue Share (%), by Country 2025 & 2033
- Figure 50: Asia Pacific Pelvic Inflammatory Disease Therapeutics Industry Volume Share (%), by Country 2025 & 2033
- Figure 51: Middle East and Africa Pelvic Inflammatory Disease Therapeutics Industry Revenue (billion), by Drug Class 2025 & 2033
- Figure 52: Middle East and Africa Pelvic Inflammatory Disease Therapeutics Industry Volume (K Unit), by Drug Class 2025 & 2033
- Figure 53: Middle East and Africa Pelvic Inflammatory Disease Therapeutics Industry Revenue Share (%), by Drug Class 2025 & 2033
- Figure 54: Middle East and Africa Pelvic Inflammatory Disease Therapeutics Industry Volume Share (%), by Drug Class 2025 & 2033
- Figure 55: Middle East and Africa Pelvic Inflammatory Disease Therapeutics Industry Revenue (billion), by Route of Administration 2025 & 2033
- Figure 56: Middle East and Africa Pelvic Inflammatory Disease Therapeutics Industry Volume (K Unit), by Route of Administration 2025 & 2033
- Figure 57: Middle East and Africa Pelvic Inflammatory Disease Therapeutics Industry Revenue Share (%), by Route of Administration 2025 & 2033
- Figure 58: Middle East and Africa Pelvic Inflammatory Disease Therapeutics Industry Volume Share (%), by Route of Administration 2025 & 2033
- Figure 59: Middle East and Africa Pelvic Inflammatory Disease Therapeutics Industry Revenue (billion), by Distribution Channel 2025 & 2033
- Figure 60: Middle East and Africa Pelvic Inflammatory Disease Therapeutics Industry Volume (K Unit), by Distribution Channel 2025 & 2033
- Figure 61: Middle East and Africa Pelvic Inflammatory Disease Therapeutics Industry Revenue Share (%), by Distribution Channel 2025 & 2033
- Figure 62: Middle East and Africa Pelvic Inflammatory Disease Therapeutics Industry Volume Share (%), by Distribution Channel 2025 & 2033
- Figure 63: Middle East and Africa Pelvic Inflammatory Disease Therapeutics Industry Revenue (billion), by Country 2025 & 2033
- Figure 64: Middle East and Africa Pelvic Inflammatory Disease Therapeutics Industry Volume (K Unit), by Country 2025 & 2033
- Figure 65: Middle East and Africa Pelvic Inflammatory Disease Therapeutics Industry Revenue Share (%), by Country 2025 & 2033
- Figure 66: Middle East and Africa Pelvic Inflammatory Disease Therapeutics Industry Volume Share (%), by Country 2025 & 2033
- Figure 67: South America Pelvic Inflammatory Disease Therapeutics Industry Revenue (billion), by Drug Class 2025 & 2033
- Figure 68: South America Pelvic Inflammatory Disease Therapeutics Industry Volume (K Unit), by Drug Class 2025 & 2033
- Figure 69: South America Pelvic Inflammatory Disease Therapeutics Industry Revenue Share (%), by Drug Class 2025 & 2033
- Figure 70: South America Pelvic Inflammatory Disease Therapeutics Industry Volume Share (%), by Drug Class 2025 & 2033
- Figure 71: South America Pelvic Inflammatory Disease Therapeutics Industry Revenue (billion), by Route of Administration 2025 & 2033
- Figure 72: South America Pelvic Inflammatory Disease Therapeutics Industry Volume (K Unit), by Route of Administration 2025 & 2033
- Figure 73: South America Pelvic Inflammatory Disease Therapeutics Industry Revenue Share (%), by Route of Administration 2025 & 2033
- Figure 74: South America Pelvic Inflammatory Disease Therapeutics Industry Volume Share (%), by Route of Administration 2025 & 2033
- Figure 75: South America Pelvic Inflammatory Disease Therapeutics Industry Revenue (billion), by Distribution Channel 2025 & 2033
- Figure 76: South America Pelvic Inflammatory Disease Therapeutics Industry Volume (K Unit), by Distribution Channel 2025 & 2033
- Figure 77: South America Pelvic Inflammatory Disease Therapeutics Industry Revenue Share (%), by Distribution Channel 2025 & 2033
- Figure 78: South America Pelvic Inflammatory Disease Therapeutics Industry Volume Share (%), by Distribution Channel 2025 & 2033
- Figure 79: South America Pelvic Inflammatory Disease Therapeutics Industry Revenue (billion), by Country 2025 & 2033
- Figure 80: South America Pelvic Inflammatory Disease Therapeutics Industry Volume (K Unit), by Country 2025 & 2033
- Figure 81: South America Pelvic Inflammatory Disease Therapeutics Industry Revenue Share (%), by Country 2025 & 2033
- Figure 82: South America Pelvic Inflammatory Disease Therapeutics Industry Volume Share (%), by Country 2025 & 2033
List of Tables
- Table 1: Global Pelvic Inflammatory Disease Therapeutics Industry Revenue billion Forecast, by Drug Class 2020 & 2033
- Table 2: Global Pelvic Inflammatory Disease Therapeutics Industry Volume K Unit Forecast, by Drug Class 2020 & 2033
- Table 3: Global Pelvic Inflammatory Disease Therapeutics Industry Revenue billion Forecast, by Route of Administration 2020 & 2033
- Table 4: Global Pelvic Inflammatory Disease Therapeutics Industry Volume K Unit Forecast, by Route of Administration 2020 & 2033
- Table 5: Global Pelvic Inflammatory Disease Therapeutics Industry Revenue billion Forecast, by Distribution Channel 2020 & 2033
- Table 6: Global Pelvic Inflammatory Disease Therapeutics Industry Volume K Unit Forecast, by Distribution Channel 2020 & 2033
- Table 7: Global Pelvic Inflammatory Disease Therapeutics Industry Revenue billion Forecast, by Region 2020 & 2033
- Table 8: Global Pelvic Inflammatory Disease Therapeutics Industry Volume K Unit Forecast, by Region 2020 & 2033
- Table 9: Global Pelvic Inflammatory Disease Therapeutics Industry Revenue billion Forecast, by Drug Class 2020 & 2033
- Table 10: Global Pelvic Inflammatory Disease Therapeutics Industry Volume K Unit Forecast, by Drug Class 2020 & 2033
- Table 11: Global Pelvic Inflammatory Disease Therapeutics Industry Revenue billion Forecast, by Route of Administration 2020 & 2033
- Table 12: Global Pelvic Inflammatory Disease Therapeutics Industry Volume K Unit Forecast, by Route of Administration 2020 & 2033
- Table 13: Global Pelvic Inflammatory Disease Therapeutics Industry Revenue billion Forecast, by Distribution Channel 2020 & 2033
- Table 14: Global Pelvic Inflammatory Disease Therapeutics Industry Volume K Unit Forecast, by Distribution Channel 2020 & 2033
- Table 15: Global Pelvic Inflammatory Disease Therapeutics Industry Revenue billion Forecast, by Country 2020 & 2033
- Table 16: Global Pelvic Inflammatory Disease Therapeutics Industry Volume K Unit Forecast, by Country 2020 & 2033
- Table 17: United States Pelvic Inflammatory Disease Therapeutics Industry Revenue (billion) Forecast, by Application 2020 & 2033
- Table 18: United States Pelvic Inflammatory Disease Therapeutics Industry Volume (K Unit) Forecast, by Application 2020 & 2033
- Table 19: Canada Pelvic Inflammatory Disease Therapeutics Industry Revenue (billion) Forecast, by Application 2020 & 2033
- Table 20: Canada Pelvic Inflammatory Disease Therapeutics Industry Volume (K Unit) Forecast, by Application 2020 & 2033
- Table 21: Mexico Pelvic Inflammatory Disease Therapeutics Industry Revenue (billion) Forecast, by Application 2020 & 2033
- Table 22: Mexico Pelvic Inflammatory Disease Therapeutics Industry Volume (K Unit) Forecast, by Application 2020 & 2033
- Table 23: Global Pelvic Inflammatory Disease Therapeutics Industry Revenue billion Forecast, by Drug Class 2020 & 2033
- Table 24: Global Pelvic Inflammatory Disease Therapeutics Industry Volume K Unit Forecast, by Drug Class 2020 & 2033
- Table 25: Global Pelvic Inflammatory Disease Therapeutics Industry Revenue billion Forecast, by Route of Administration 2020 & 2033
- Table 26: Global Pelvic Inflammatory Disease Therapeutics Industry Volume K Unit Forecast, by Route of Administration 2020 & 2033
- Table 27: Global Pelvic Inflammatory Disease Therapeutics Industry Revenue billion Forecast, by Distribution Channel 2020 & 2033
- Table 28: Global Pelvic Inflammatory Disease Therapeutics Industry Volume K Unit Forecast, by Distribution Channel 2020 & 2033
- Table 29: Global Pelvic Inflammatory Disease Therapeutics Industry Revenue billion Forecast, by Country 2020 & 2033
- Table 30: Global Pelvic Inflammatory Disease Therapeutics Industry Volume K Unit Forecast, by Country 2020 & 2033
- Table 31: Germany Pelvic Inflammatory Disease Therapeutics Industry Revenue (billion) Forecast, by Application 2020 & 2033
- Table 32: Germany Pelvic Inflammatory Disease Therapeutics Industry Volume (K Unit) Forecast, by Application 2020 & 2033
- Table 33: United Kingdom Pelvic Inflammatory Disease Therapeutics Industry Revenue (billion) Forecast, by Application 2020 & 2033
- Table 34: United Kingdom Pelvic Inflammatory Disease Therapeutics Industry Volume (K Unit) Forecast, by Application 2020 & 2033
- Table 35: France Pelvic Inflammatory Disease Therapeutics Industry Revenue (billion) Forecast, by Application 2020 & 2033
- Table 36: France Pelvic Inflammatory Disease Therapeutics Industry Volume (K Unit) Forecast, by Application 2020 & 2033
- Table 37: Italy Pelvic Inflammatory Disease Therapeutics Industry Revenue (billion) Forecast, by Application 2020 & 2033
- Table 38: Italy Pelvic Inflammatory Disease Therapeutics Industry Volume (K Unit) Forecast, by Application 2020 & 2033
- Table 39: Spain Pelvic Inflammatory Disease Therapeutics Industry Revenue (billion) Forecast, by Application 2020 & 2033
- Table 40: Spain Pelvic Inflammatory Disease Therapeutics Industry Volume (K Unit) Forecast, by Application 2020 & 2033
- Table 41: Rest of Europe Pelvic Inflammatory Disease Therapeutics Industry Revenue (billion) Forecast, by Application 2020 & 2033
- Table 42: Rest of Europe Pelvic Inflammatory Disease Therapeutics Industry Volume (K Unit) Forecast, by Application 2020 & 2033
- Table 43: Global Pelvic Inflammatory Disease Therapeutics Industry Revenue billion Forecast, by Drug Class 2020 & 2033
- Table 44: Global Pelvic Inflammatory Disease Therapeutics Industry Volume K Unit Forecast, by Drug Class 2020 & 2033
- Table 45: Global Pelvic Inflammatory Disease Therapeutics Industry Revenue billion Forecast, by Route of Administration 2020 & 2033
- Table 46: Global Pelvic Inflammatory Disease Therapeutics Industry Volume K Unit Forecast, by Route of Administration 2020 & 2033
- Table 47: Global Pelvic Inflammatory Disease Therapeutics Industry Revenue billion Forecast, by Distribution Channel 2020 & 2033
- Table 48: Global Pelvic Inflammatory Disease Therapeutics Industry Volume K Unit Forecast, by Distribution Channel 2020 & 2033
- Table 49: Global Pelvic Inflammatory Disease Therapeutics Industry Revenue billion Forecast, by Country 2020 & 2033
- Table 50: Global Pelvic Inflammatory Disease Therapeutics Industry Volume K Unit Forecast, by Country 2020 & 2033
- Table 51: China Pelvic Inflammatory Disease Therapeutics Industry Revenue (billion) Forecast, by Application 2020 & 2033
- Table 52: China Pelvic Inflammatory Disease Therapeutics Industry Volume (K Unit) Forecast, by Application 2020 & 2033
- Table 53: Japan Pelvic Inflammatory Disease Therapeutics Industry Revenue (billion) Forecast, by Application 2020 & 2033
- Table 54: Japan Pelvic Inflammatory Disease Therapeutics Industry Volume (K Unit) Forecast, by Application 2020 & 2033
- Table 55: India Pelvic Inflammatory Disease Therapeutics Industry Revenue (billion) Forecast, by Application 2020 & 2033
- Table 56: India Pelvic Inflammatory Disease Therapeutics Industry Volume (K Unit) Forecast, by Application 2020 & 2033
- Table 57: Australia Pelvic Inflammatory Disease Therapeutics Industry Revenue (billion) Forecast, by Application 2020 & 2033
- Table 58: Australia Pelvic Inflammatory Disease Therapeutics Industry Volume (K Unit) Forecast, by Application 2020 & 2033
- Table 59: South Korea Pelvic Inflammatory Disease Therapeutics Industry Revenue (billion) Forecast, by Application 2020 & 2033
- Table 60: South Korea Pelvic Inflammatory Disease Therapeutics Industry Volume (K Unit) Forecast, by Application 2020 & 2033
- Table 61: Rest of Asia Pacific Pelvic Inflammatory Disease Therapeutics Industry Revenue (billion) Forecast, by Application 2020 & 2033
- Table 62: Rest of Asia Pacific Pelvic Inflammatory Disease Therapeutics Industry Volume (K Unit) Forecast, by Application 2020 & 2033
- Table 63: Global Pelvic Inflammatory Disease Therapeutics Industry Revenue billion Forecast, by Drug Class 2020 & 2033
- Table 64: Global Pelvic Inflammatory Disease Therapeutics Industry Volume K Unit Forecast, by Drug Class 2020 & 2033
- Table 65: Global Pelvic Inflammatory Disease Therapeutics Industry Revenue billion Forecast, by Route of Administration 2020 & 2033
- Table 66: Global Pelvic Inflammatory Disease Therapeutics Industry Volume K Unit Forecast, by Route of Administration 2020 & 2033
- Table 67: Global Pelvic Inflammatory Disease Therapeutics Industry Revenue billion Forecast, by Distribution Channel 2020 & 2033
- Table 68: Global Pelvic Inflammatory Disease Therapeutics Industry Volume K Unit Forecast, by Distribution Channel 2020 & 2033
- Table 69: Global Pelvic Inflammatory Disease Therapeutics Industry Revenue billion Forecast, by Country 2020 & 2033
- Table 70: Global Pelvic Inflammatory Disease Therapeutics Industry Volume K Unit Forecast, by Country 2020 & 2033
- Table 71: GCC Pelvic Inflammatory Disease Therapeutics Industry Revenue (billion) Forecast, by Application 2020 & 2033
- Table 72: GCC Pelvic Inflammatory Disease Therapeutics Industry Volume (K Unit) Forecast, by Application 2020 & 2033
- Table 73: South Africa Pelvic Inflammatory Disease Therapeutics Industry Revenue (billion) Forecast, by Application 2020 & 2033
- Table 74: South Africa Pelvic Inflammatory Disease Therapeutics Industry Volume (K Unit) Forecast, by Application 2020 & 2033
- Table 75: Rest of Middle East and Africa Pelvic Inflammatory Disease Therapeutics Industry Revenue (billion) Forecast, by Application 2020 & 2033
- Table 76: Rest of Middle East and Africa Pelvic Inflammatory Disease Therapeutics Industry Volume (K Unit) Forecast, by Application 2020 & 2033
- Table 77: Global Pelvic Inflammatory Disease Therapeutics Industry Revenue billion Forecast, by Drug Class 2020 & 2033
- Table 78: Global Pelvic Inflammatory Disease Therapeutics Industry Volume K Unit Forecast, by Drug Class 2020 & 2033
- Table 79: Global Pelvic Inflammatory Disease Therapeutics Industry Revenue billion Forecast, by Route of Administration 2020 & 2033
- Table 80: Global Pelvic Inflammatory Disease Therapeutics Industry Volume K Unit Forecast, by Route of Administration 2020 & 2033
- Table 81: Global Pelvic Inflammatory Disease Therapeutics Industry Revenue billion Forecast, by Distribution Channel 2020 & 2033
- Table 82: Global Pelvic Inflammatory Disease Therapeutics Industry Volume K Unit Forecast, by Distribution Channel 2020 & 2033
- Table 83: Global Pelvic Inflammatory Disease Therapeutics Industry Revenue billion Forecast, by Country 2020 & 2033
- Table 84: Global Pelvic Inflammatory Disease Therapeutics Industry Volume K Unit Forecast, by Country 2020 & 2033
- Table 85: Brazil Pelvic Inflammatory Disease Therapeutics Industry Revenue (billion) Forecast, by Application 2020 & 2033
- Table 86: Brazil Pelvic Inflammatory Disease Therapeutics Industry Volume (K Unit) Forecast, by Application 2020 & 2033
- Table 87: Argentina Pelvic Inflammatory Disease Therapeutics Industry Revenue (billion) Forecast, by Application 2020 & 2033
- Table 88: Argentina Pelvic Inflammatory Disease Therapeutics Industry Volume (K Unit) Forecast, by Application 2020 & 2033
- Table 89: Rest of South America Pelvic Inflammatory Disease Therapeutics Industry Revenue (billion) Forecast, by Application 2020 & 2033
- Table 90: Rest of South America Pelvic Inflammatory Disease Therapeutics Industry Volume (K Unit) Forecast, by Application 2020 & 2033
Frequently Asked Questions
1. What is the projected Compound Annual Growth Rate (CAGR) of the Pelvic Inflammatory Disease Therapeutics Industry?
The projected CAGR is approximately 3.75%.
2. Which companies are prominent players in the Pelvic Inflammatory Disease Therapeutics Industry?
Key companies in the market include Sanofi SA, Galderma Laboratories LP, Mayne Pharma, F Hoffmann-La Roche Ltd, Perrigo Company PLC, Janssen Pharmaceuticals Inc (Johnson and Johnson), AstraZeneca, Teligent Inc, Viatris, Bristol-Myers Squibb Company, Pfizer Inc.
3. What are the main segments of the Pelvic Inflammatory Disease Therapeutics Industry?
The market segments include Drug Class, Route of Administration, Distribution Channel.
4. Can you provide details about the market size?
The market size is estimated to be USD 3.52 billion as of 2022.
5. What are some drivers contributing to market growth?
Increasing Prevalence of STD and Infectious Diseases Across the World; Rise in Healthcare Awareness along with the Increasing Aging Female Population.
6. What are the notable trends driving market growth?
The Tetracyclines Segment is Expected to Hold the Major Share in the Pelvic Inflammatory Disease Therapeutics Market.
7. Are there any restraints impacting market growth?
Stringent Regulatory Framework that Delays the Approval of Products; Expensive Patented Products and Severe Complications Associated with the Medication.
8. Can you provide examples of recent developments in the market?
May 2022: Evofem Biosciences Inc. reported the new data from the Phase 3 AMPOWER clinical trial of Phexxi (lactic acid, citric acid, and potassium bitartrate), showing women enrolled in the AMPOWER trial had fewer urinary tract infections (UTIs), compared to the general population.
9. What pricing options are available for accessing the report?
Pricing options include single-user, multi-user, and enterprise licenses priced at USD 4750, USD 5250, and USD 8750 respectively.
10. Is the market size provided in terms of value or volume?
The market size is provided in terms of value, measured in billion and volume, measured in K Unit.
11. Are there any specific market keywords associated with the report?
Yes, the market keyword associated with the report is "Pelvic Inflammatory Disease Therapeutics Industry," which aids in identifying and referencing the specific market segment covered.
12. How do I determine which pricing option suits my needs best?
The pricing options vary based on user requirements and access needs. Individual users may opt for single-user licenses, while businesses requiring broader access may choose multi-user or enterprise licenses for cost-effective access to the report.
13. Are there any additional resources or data provided in the Pelvic Inflammatory Disease Therapeutics Industry report?
While the report offers comprehensive insights, it's advisable to review the specific contents or supplementary materials provided to ascertain if additional resources or data are available.
14. How can I stay updated on further developments or reports in the Pelvic Inflammatory Disease Therapeutics Industry?
To stay informed about further developments, trends, and reports in the Pelvic Inflammatory Disease Therapeutics Industry, consider subscribing to industry newsletters, following relevant companies and organizations, or regularly checking reputable industry news sources and publications.
Methodology
Step 1 - Identification of Relevant Samples Size from Population Database


Step 2 - Approaches for Defining Global Market Size (Value, Volume* & Price*)

Note*: In applicable scenarios
Step 3 - Data Sources
Primary Research
- Web Analytics
- Survey Reports
- Research Institute
- Latest Research Reports
- Opinion Leaders
Secondary Research
- Annual Reports
- White Paper
- Latest Press Release
- Industry Association
- Paid Database
- Investor Presentations

Step 4 - Data Triangulation
Involves using different sources of information in order to increase the validity of a study
These sources are likely to be stakeholders in a program - participants, other researchers, program staff, other community members, and so on.
Then we put all data in single framework & apply various statistical tools to find out the dynamic on the market.
During the analysis stage, feedback from the stakeholder groups would be compared to determine areas of agreement as well as areas of divergence