

Key Insights
The global pet obesity management market is poised for substantial growth, driven by escalating pet ownership, the increasing humanization of pets, and heightened awareness of the health implications of pet obesity. The market, currently valued at approximately $9.67 billion in 2025, is projected to expand at a Compound Annual Growth Rate (CAGR) of 13.83% from 2025 to 2033. Key growth drivers include the rising adoption of companion animals worldwide, fostering a larger consumer base for obesity management solutions. The trend of pets being considered integral family members further elevates owner investment in their pets' health and well-being, boosting demand for premium offerings such as specialized diets and veterinary care. Moreover, a clearer understanding of the correlation between pet obesity and chronic conditions like diabetes and joint disorders is compelling owners to proactively seek weight management interventions. Market segments encompassing pharmaceuticals, nutritional supplements, and veterinary services are all contributing to this expansion, with significant revenue streams originating from pet specialty retailers and e-commerce platforms. While North America currently dominates the market due to high pet ownership and health consciousness, the Asia-Pacific and other emerging regions present significant growth opportunities.
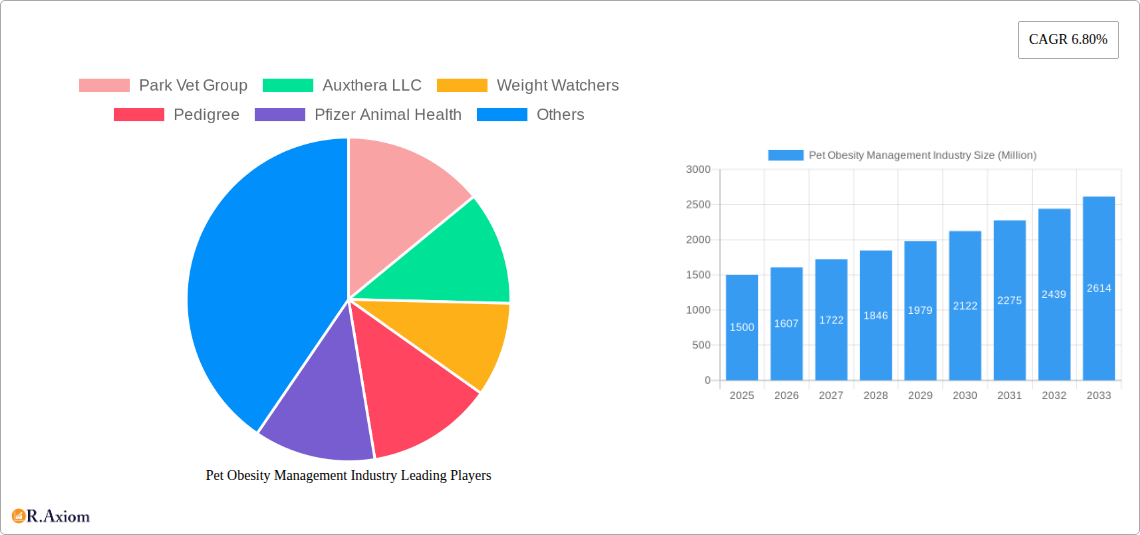
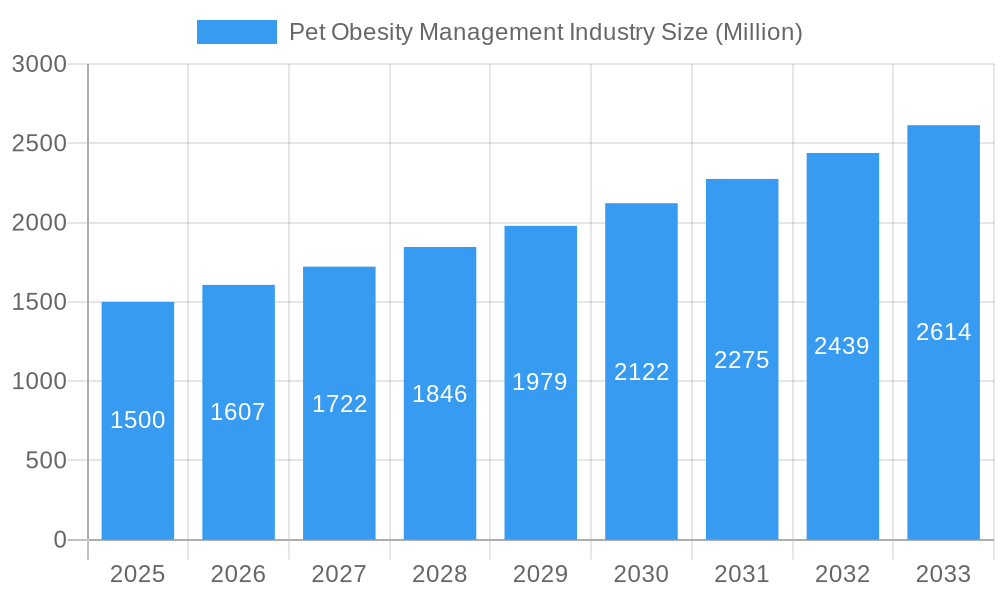
Pet Obesity Management Industry Market Size (In Billion)
The competitive environment features a blend of established industry leaders and agile, specialized firms. The market is anticipated to witness intensified competition as new entrants introduce innovative solutions, including personalized weight management programs and virtual veterinary consultations. Continuous investment in research and development for pet nutrition and weight loss therapeutics is expected to foster market diversification and sustained expansion. While challenges such as consumer education regarding pet obesity and the affordability of specialized solutions persist, the overall market outlook remains highly positive, indicating consistent growth throughout the forecast period.
Pet Obesity Management Industry Company Market Share
Pet Obesity Management Industry: A Comprehensive Market Report (2019-2033)
This detailed report provides a comprehensive analysis of the Pet Obesity Management industry, encompassing market size, growth projections, key players, and emerging trends from 2019 to 2033. The report leverages a robust data-driven approach to offer actionable insights for industry stakeholders, investors, and businesses seeking to navigate this dynamic sector. The study period covers 2019-2033, with 2025 serving as the base and estimated year. The forecast period spans from 2025 to 2033, while the historical period encompasses 2019-2024. The global market value is projected to reach xx Million by 2033.
Pet Obesity Management Industry Market Concentration & Innovation
The Pet Obesity Management industry exhibits a moderately concentrated market structure, with several major players holding significant market share. Key players like Hill's Pet Nutrition Inc, Royal Canin, and Pfizer Animal Health contribute substantially to the overall market value, although precise market share figures for each company remain confidential and are xx for the report. The industry is characterized by ongoing innovation driven by the increasing prevalence of pet obesity and growing consumer demand for effective weight management solutions. This has led to the development of novel products, such as specialized diets, prescription medications, and technological solutions for monitoring pet activity and nutrition. Regulatory frameworks, varying across different geographies, significantly impact market dynamics. Stringent regulations surrounding pet pharmaceuticals and food additives influence product development and market access. The industry also faces competitive pressures from product substitutes, including natural remedies and alternative weight management approaches. Mergers and acquisitions (M&A) activity has been moderate, with deal values ranging from xx Million to xx Million in recent years, reflecting strategic consolidation within the sector. Future M&A activity is expected to focus on expanding product portfolios and geographical reach.
- Innovation Drivers: Development of novel weight-loss drugs, advanced pet nutrition formulations, and digital health technologies for pet obesity management.
- Regulatory Frameworks: Varying regulations concerning pet food and drug approvals across countries.
- Product Substitutes: Natural remedies, lifestyle changes, and alternative therapies.
- End-User Trends: Increasing awareness of pet obesity and its health implications, driving demand for effective solutions.
- M&A Activity: Moderate M&A activity with deal values varying between xx Million and xx Million, primarily focused on expanding product portfolios.
Pet Obesity Management Industry Industry Trends & Insights
The Pet Obesity Management market is experiencing robust growth, driven by a combination of factors. The increasing prevalence of pet obesity worldwide is a primary driver, with a xx% CAGR projected during the forecast period. Technological advancements, particularly in pet nutrition and digital health monitoring, are significantly impacting market trends. The development of personalized nutrition plans, smart feeders, and activity trackers is enhancing the effectiveness of pet weight management solutions. Changing consumer preferences towards premium pet food and health-conscious pet ownership are further fueling market expansion. Increased disposable incomes, particularly in emerging economies, are also driving demand for premium pet products, including weight management solutions. The competitive landscape is characterized by both established players and emerging companies, resulting in intense competition and innovation. Market penetration for specialized pet obesity products is gradually increasing, with xx% market penetration achieved in 2024, expected to reach xx% by 2033.
Dominant Markets & Segments in Pet Obesity Management Industry
The global Pet Obesity Management market is dominated by the Dogs segment within the Animal Type category, followed by the Cats segment. This dominance is primarily driven by the higher ownership rates of dogs and cats globally, combined with a higher incidence of obesity among these animal types. The E-commerce segment is a rapidly growing channel within the End-User category, offering convenience and a wide range of products. Within the Product category, Food Supplements hold a larger market share compared to drugs, due to their wider accessibility and general preference for non-pharmaceutical interventions.
- Key Drivers for Dogs Segment: High pet ownership rates, higher incidence of obesity in dogs, availability of wide-ranging products.
- Key Drivers for E-commerce Segment: Convenience, wider product selection, ease of access, and targeted advertising.
- Key Drivers for Food Supplements Segment: Accessibility, affordability, and consumer preference for non-pharmaceutical solutions.
The United States currently leads the market by region, driven by high pet ownership rates and a strong focus on pet health and well-being. This region benefits from advanced veterinary infrastructure, high consumer spending power, and increased awareness about pet obesity.
Pet Obesity Management Industry Product Developments
Recent product innovations in the Pet Obesity Management industry focus on personalized nutrition plans, incorporating data from activity trackers and genetic testing to tailor dietary recommendations. Smart feeders and connected devices allow for precise portion control and remote monitoring, enabling improved adherence to weight management programs. The development of novel, palatable, and effective weight-loss drugs targeting specific metabolic pathways has added another layer of sophisticated solutions. These advancements are enhancing the efficacy and convenience of pet weight management, promoting greater market fit and adoption.
Report Scope & Segmentation Analysis
This report segments the Pet Obesity Management market based on animal type (dogs, cats, other animals), end-user (pet specialty stores, e-commerce, other end users), and products (drugs, food supplements). Each segment is analyzed in terms of market size, growth projections, and competitive dynamics. For example, the dog segment is expected to maintain its dominance due to higher pet ownership and obesity prevalence. E-commerce is showing rapid growth due to its convenience. The food supplement segment generally holds a larger market share than drugs, though the latter is expected to see increased growth due to novel drug development. Detailed growth projections are provided for each segment in the main report.
Key Drivers of Pet Obesity Management Industry Growth
The Pet Obesity Management industry's growth is propelled by several factors: the rising prevalence of pet obesity globally, increasing consumer awareness of pet health, and growing disposable incomes leading to increased spending on premium pet products. Technological advancements, such as smart feeders and activity trackers, enhance the efficacy of weight management solutions, thus encouraging adoption. Government initiatives and educational campaigns promoting responsible pet ownership further contribute to the growth of this market.
Challenges in the Pet Obesity Management Industry Sector
Challenges facing the industry include the development of cost-effective and highly palatable weight-loss solutions, overcoming regulatory hurdles for novel drugs and food additives, and navigating supply chain disruptions that can impact the availability of key ingredients. The high cost of specialized veterinary care and weight management products, and strong competition from generic or alternative solutions, also poses a challenge for market growth. These challenges account for a xx% reduction in projected market value.
Emerging Opportunities in Pet Obesity Management Industry
Emerging opportunities exist in personalized nutrition solutions tailored to individual pet needs, leveraging data from genomics and other health markers. The integration of artificial intelligence and machine learning to create predictive models for pet obesity risk and treatment optimization offers potential for greater market penetration. Expanding into emerging markets with growing pet ownership rates also presents considerable opportunities. The growth in pet insurance can also drive growth as preventative care becomes more accessible.
Leading Players in the Pet Obesity Management Industry Market
- Park Vet Group
- Auxthera LLC
- Weight Watchers
- Pedigree
- Pfizer Animal Health
- Vivaldis
- KONG Company
- Hills Pet Nutrition Inc
- Royal Canin
Key Developments in Pet Obesity Management Industry Industry
- May 2022: Park Vet Group launched the Veterinary Nursing Awareness campaign to raise awareness regarding the importance of veterinary nursing and pet nutrition balance. This initiative enhanced brand image and reinforced the connection between professional care and obesity management.
- January 2022: Alton Brown joined Hill's Pet Nutrition on a mission to end pet obesity. This celebrity endorsement significantly broadened the campaign’s reach and boosted consumer awareness.
Strategic Outlook for Pet Obesity Management Industry Market
The Pet Obesity Management market is poised for continued growth, driven by technological advancements, increasing consumer awareness, and a greater understanding of the long-term health consequences of pet obesity. Strategic investments in personalized nutrition, digital health solutions, and targeted marketing campaigns will be crucial for success in this evolving landscape. The market holds significant potential for expansion into emerging economies and underserved segments of the pet owner population.
Pet Obesity Management Industry Segmentation
-
1. Products
- 1.1. Drugs
- 1.2. Food Supplements
-
2. Animal Type
- 2.1. Dogs
- 2.2. Cats
- 2.3. Other Animals
-
3. End User
- 3.1. Pet Specialty Stores
- 3.2. E-commerce
- 3.3. Other End Users
Pet Obesity Management Industry Segmentation By Geography
-
1. North America
- 1.1. United States
- 1.2. Canada
- 1.3. Mexico
-
2. Europe
- 2.1. Germany
- 2.2. United Kingdom
- 2.3. France
- 2.4. Italy
- 2.5. Spain
- 2.6. Rest of Europe
-
3. Asia Pacific
- 3.1. China
- 3.2. Japan
- 3.3. India
- 3.4. Australia
- 3.5. South Korea
- 3.6. Rest of Asia Pacific
-
4. Middle East and Africa
- 4.1. GCC
- 4.2. South Africa
- 4.3. Rest of Middle East and Africa
-
5. South America
- 5.1. Brazil
- 5.2. Argentina
- 5.3. Rest of South America
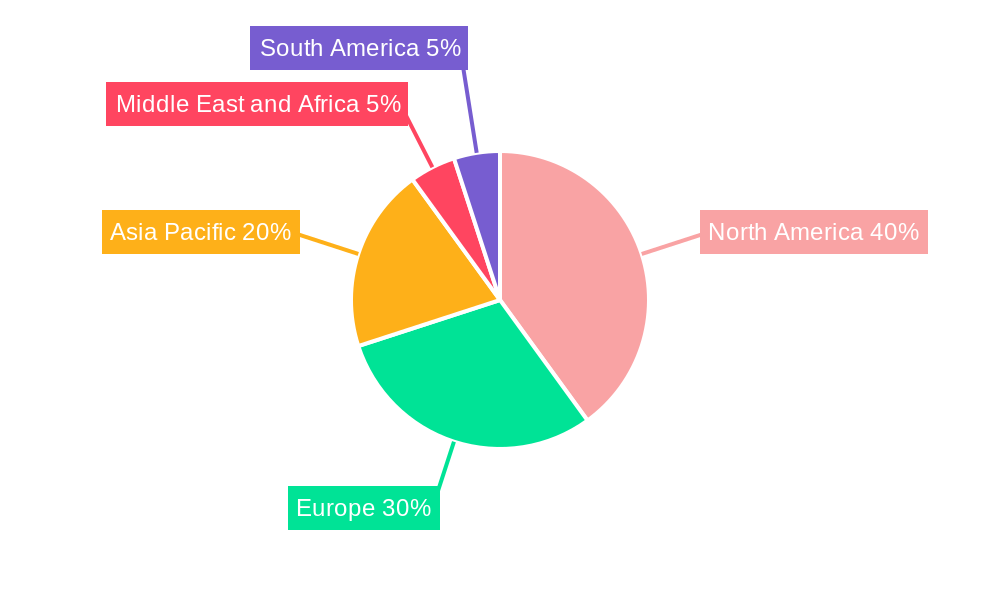
Pet Obesity Management Industry Regional Market Share
Geographic Coverage of Pet Obesity Management Industry
Pet Obesity Management Industry REPORT HIGHLIGHTS
| Aspects | Details |
|---|---|
| Study Period | 2020-2034 |
| Base Year | 2025 |
| Estimated Year | 2026 |
| Forecast Period | 2026-2034 |
| Historical Period | 2020-2025 |
| Growth Rate | CAGR of 13.83% from 2020-2034 |
| Segmentation |
|
Table of Contents
- 1. Introduction
- 1.1. Research Scope
- 1.2. Market Segmentation
- 1.3. Research Objective
- 1.4. Definitions and Assumptions
- 2. Executive Summary
- 2.1. Market Snapshot
- 3. Market Dynamics
- 3.1. Market Drivers
- 3.2. Market Restrains
- 3.3. Market Trends
- 3.4. Market Opportunities
- 4. Market Factor Analysis
- 4.1. Porters Five Forces
- 4.1.1. Bargaining Power of Suppliers
- 4.1.2. Bargaining Power of Buyers
- 4.1.3. Threat of New Entrants
- 4.1.4. Threat of Substitutes
- 4.1.5. Competitive Rivalry
- 4.2. PESTEL analysis
- 4.3. BCG Analysis
- 4.3.1. Stars (High Growth, High Market Share)
- 4.3.2. Cash Cows (Low Growth, High Market Share)
- 4.3.3. Question Mark (High Growth, Low Market Share)
- 4.3.4. Dogs (Low Growth, Low Market Share)
- 4.4. Ansoff Matrix Analysis
- 4.5. Supply Chain Analysis
- 4.6. Regulatory Landscape
- 4.7. Current Market Potential and Opportunity Assessment (TAM–SAM–SOM Framework)
- 4.8. RAX Analyst Note
- 4.1. Porters Five Forces
- 5. Market Analysis, Insights and Forecast 2021-2033
- 5.1. Market Analysis, Insights and Forecast - by Products
- 5.1.1. Drugs
- 5.1.2. Food Supplements
- 5.2. Market Analysis, Insights and Forecast - by Animal Type
- 5.2.1. Dogs
- 5.2.2. Cats
- 5.2.3. Other Animals
- 5.3. Market Analysis, Insights and Forecast - by End User
- 5.3.1. Pet Specialty Stores
- 5.3.2. E-commerce
- 5.3.3. Other End Users
- 5.4. Market Analysis, Insights and Forecast - by Region
- 5.4.1. North America
- 5.4.2. Europe
- 5.4.3. Asia Pacific
- 5.4.4. Middle East and Africa
- 5.4.5. South America
- 5.1. Market Analysis, Insights and Forecast - by Products
- 6. Global Pet Obesity Management Industry Analysis, Insights and Forecast, 2021-2033
- 6.1. Market Analysis, Insights and Forecast - by Products
- 6.1.1. Drugs
- 6.1.2. Food Supplements
- 6.2. Market Analysis, Insights and Forecast - by Animal Type
- 6.2.1. Dogs
- 6.2.2. Cats
- 6.2.3. Other Animals
- 6.3. Market Analysis, Insights and Forecast - by End User
- 6.3.1. Pet Specialty Stores
- 6.3.2. E-commerce
- 6.3.3. Other End Users
- 6.1. Market Analysis, Insights and Forecast - by Products
- 7. North America Pet Obesity Management Industry Analysis, Insights and Forecast, 2020-2032
- 7.1. Market Analysis, Insights and Forecast - by Products
- 7.1.1. Drugs
- 7.1.2. Food Supplements
- 7.2. Market Analysis, Insights and Forecast - by Animal Type
- 7.2.1. Dogs
- 7.2.2. Cats
- 7.2.3. Other Animals
- 7.3. Market Analysis, Insights and Forecast - by End User
- 7.3.1. Pet Specialty Stores
- 7.3.2. E-commerce
- 7.3.3. Other End Users
- 7.1. Market Analysis, Insights and Forecast - by Products
- 8. Europe Pet Obesity Management Industry Analysis, Insights and Forecast, 2020-2032
- 8.1. Market Analysis, Insights and Forecast - by Products
- 8.1.1. Drugs
- 8.1.2. Food Supplements
- 8.2. Market Analysis, Insights and Forecast - by Animal Type
- 8.2.1. Dogs
- 8.2.2. Cats
- 8.2.3. Other Animals
- 8.3. Market Analysis, Insights and Forecast - by End User
- 8.3.1. Pet Specialty Stores
- 8.3.2. E-commerce
- 8.3.3. Other End Users
- 8.1. Market Analysis, Insights and Forecast - by Products
- 9. Asia Pacific Pet Obesity Management Industry Analysis, Insights and Forecast, 2020-2032
- 9.1. Market Analysis, Insights and Forecast - by Products
- 9.1.1. Drugs
- 9.1.2. Food Supplements
- 9.2. Market Analysis, Insights and Forecast - by Animal Type
- 9.2.1. Dogs
- 9.2.2. Cats
- 9.2.3. Other Animals
- 9.3. Market Analysis, Insights and Forecast - by End User
- 9.3.1. Pet Specialty Stores
- 9.3.2. E-commerce
- 9.3.3. Other End Users
- 9.1. Market Analysis, Insights and Forecast - by Products
- 10. Middle East and Africa Pet Obesity Management Industry Analysis, Insights and Forecast, 2020-2032
- 10.1. Market Analysis, Insights and Forecast - by Products
- 10.1.1. Drugs
- 10.1.2. Food Supplements
- 10.2. Market Analysis, Insights and Forecast - by Animal Type
- 10.2.1. Dogs
- 10.2.2. Cats
- 10.2.3. Other Animals
- 10.3. Market Analysis, Insights and Forecast - by End User
- 10.3.1. Pet Specialty Stores
- 10.3.2. E-commerce
- 10.3.3. Other End Users
- 10.1. Market Analysis, Insights and Forecast - by Products
- 11. South America Pet Obesity Management Industry Analysis, Insights and Forecast, 2020-2032
- 11.1. Market Analysis, Insights and Forecast - by Products
- 11.1.1. Drugs
- 11.1.2. Food Supplements
- 11.2. Market Analysis, Insights and Forecast - by Animal Type
- 11.2.1. Dogs
- 11.2.2. Cats
- 11.2.3. Other Animals
- 11.3. Market Analysis, Insights and Forecast - by End User
- 11.3.1. Pet Specialty Stores
- 11.3.2. E-commerce
- 11.3.3. Other End Users
- 11.1. Market Analysis, Insights and Forecast - by Products
- 12. Competitive Analysis
- 12.1. Company Profiles
- 12.1.1 Park Vet Group
- 12.1.1.1. Company Overview
- 12.1.1.2. Products
- 12.1.1.3. Company Financials
- 12.1.1.4. SWOT Analysis
- 12.1.2 Auxthera LLC
- 12.1.2.1. Company Overview
- 12.1.2.2. Products
- 12.1.2.3. Company Financials
- 12.1.2.4. SWOT Analysis
- 12.1.3 Weight Watchers
- 12.1.3.1. Company Overview
- 12.1.3.2. Products
- 12.1.3.3. Company Financials
- 12.1.3.4. SWOT Analysis
- 12.1.4 Pedigree
- 12.1.4.1. Company Overview
- 12.1.4.2. Products
- 12.1.4.3. Company Financials
- 12.1.4.4. SWOT Analysis
- 12.1.5 Pfizer Animal Health
- 12.1.5.1. Company Overview
- 12.1.5.2. Products
- 12.1.5.3. Company Financials
- 12.1.5.4. SWOT Analysis
- 12.1.6 Vivaldis
- 12.1.6.1. Company Overview
- 12.1.6.2. Products
- 12.1.6.3. Company Financials
- 12.1.6.4. SWOT Analysis
- 12.1.7 KONG Company
- 12.1.7.1. Company Overview
- 12.1.7.2. Products
- 12.1.7.3. Company Financials
- 12.1.7.4. SWOT Analysis
- 12.1.8 Hills Pet Nutrition Inc
- 12.1.8.1. Company Overview
- 12.1.8.2. Products
- 12.1.8.3. Company Financials
- 12.1.8.4. SWOT Analysis
- 12.1.9 Royal Canin
- 12.1.9.1. Company Overview
- 12.1.9.2. Products
- 12.1.9.3. Company Financials
- 12.1.9.4. SWOT Analysis
- 12.1.1 Park Vet Group
- 12.2. Market Entropy
- 12.2.1 Company's Key Areas Served
- 12.2.2 Recent Developments
- 12.3. Company Market Share Analysis 2025
- 12.3.1 Top 5 Companies Market Share Analysis
- 12.3.2 Top 3 Companies Market Share Analysis
- 12.4. List of Potential Customers
- 13. Research Methodology
List of Figures
- Figure 1: Global Pet Obesity Management Industry Revenue Breakdown (billion, %) by Region 2025 & 2033
- Figure 2: Global Pet Obesity Management Industry Volume Breakdown (K Unit, %) by Region 2025 & 2033
- Figure 3: North America Pet Obesity Management Industry Revenue (billion), by Products 2025 & 2033
- Figure 4: North America Pet Obesity Management Industry Volume (K Unit), by Products 2025 & 2033
- Figure 5: North America Pet Obesity Management Industry Revenue Share (%), by Products 2025 & 2033
- Figure 6: North America Pet Obesity Management Industry Volume Share (%), by Products 2025 & 2033
- Figure 7: North America Pet Obesity Management Industry Revenue (billion), by Animal Type 2025 & 2033
- Figure 8: North America Pet Obesity Management Industry Volume (K Unit), by Animal Type 2025 & 2033
- Figure 9: North America Pet Obesity Management Industry Revenue Share (%), by Animal Type 2025 & 2033
- Figure 10: North America Pet Obesity Management Industry Volume Share (%), by Animal Type 2025 & 2033
- Figure 11: North America Pet Obesity Management Industry Revenue (billion), by End User 2025 & 2033
- Figure 12: North America Pet Obesity Management Industry Volume (K Unit), by End User 2025 & 2033
- Figure 13: North America Pet Obesity Management Industry Revenue Share (%), by End User 2025 & 2033
- Figure 14: North America Pet Obesity Management Industry Volume Share (%), by End User 2025 & 2033
- Figure 15: North America Pet Obesity Management Industry Revenue (billion), by Country 2025 & 2033
- Figure 16: North America Pet Obesity Management Industry Volume (K Unit), by Country 2025 & 2033
- Figure 17: North America Pet Obesity Management Industry Revenue Share (%), by Country 2025 & 2033
- Figure 18: North America Pet Obesity Management Industry Volume Share (%), by Country 2025 & 2033
- Figure 19: Europe Pet Obesity Management Industry Revenue (billion), by Products 2025 & 2033
- Figure 20: Europe Pet Obesity Management Industry Volume (K Unit), by Products 2025 & 2033
- Figure 21: Europe Pet Obesity Management Industry Revenue Share (%), by Products 2025 & 2033
- Figure 22: Europe Pet Obesity Management Industry Volume Share (%), by Products 2025 & 2033
- Figure 23: Europe Pet Obesity Management Industry Revenue (billion), by Animal Type 2025 & 2033
- Figure 24: Europe Pet Obesity Management Industry Volume (K Unit), by Animal Type 2025 & 2033
- Figure 25: Europe Pet Obesity Management Industry Revenue Share (%), by Animal Type 2025 & 2033
- Figure 26: Europe Pet Obesity Management Industry Volume Share (%), by Animal Type 2025 & 2033
- Figure 27: Europe Pet Obesity Management Industry Revenue (billion), by End User 2025 & 2033
- Figure 28: Europe Pet Obesity Management Industry Volume (K Unit), by End User 2025 & 2033
- Figure 29: Europe Pet Obesity Management Industry Revenue Share (%), by End User 2025 & 2033
- Figure 30: Europe Pet Obesity Management Industry Volume Share (%), by End User 2025 & 2033
- Figure 31: Europe Pet Obesity Management Industry Revenue (billion), by Country 2025 & 2033
- Figure 32: Europe Pet Obesity Management Industry Volume (K Unit), by Country 2025 & 2033
- Figure 33: Europe Pet Obesity Management Industry Revenue Share (%), by Country 2025 & 2033
- Figure 34: Europe Pet Obesity Management Industry Volume Share (%), by Country 2025 & 2033
- Figure 35: Asia Pacific Pet Obesity Management Industry Revenue (billion), by Products 2025 & 2033
- Figure 36: Asia Pacific Pet Obesity Management Industry Volume (K Unit), by Products 2025 & 2033
- Figure 37: Asia Pacific Pet Obesity Management Industry Revenue Share (%), by Products 2025 & 2033
- Figure 38: Asia Pacific Pet Obesity Management Industry Volume Share (%), by Products 2025 & 2033
- Figure 39: Asia Pacific Pet Obesity Management Industry Revenue (billion), by Animal Type 2025 & 2033
- Figure 40: Asia Pacific Pet Obesity Management Industry Volume (K Unit), by Animal Type 2025 & 2033
- Figure 41: Asia Pacific Pet Obesity Management Industry Revenue Share (%), by Animal Type 2025 & 2033
- Figure 42: Asia Pacific Pet Obesity Management Industry Volume Share (%), by Animal Type 2025 & 2033
- Figure 43: Asia Pacific Pet Obesity Management Industry Revenue (billion), by End User 2025 & 2033
- Figure 44: Asia Pacific Pet Obesity Management Industry Volume (K Unit), by End User 2025 & 2033
- Figure 45: Asia Pacific Pet Obesity Management Industry Revenue Share (%), by End User 2025 & 2033
- Figure 46: Asia Pacific Pet Obesity Management Industry Volume Share (%), by End User 2025 & 2033
- Figure 47: Asia Pacific Pet Obesity Management Industry Revenue (billion), by Country 2025 & 2033
- Figure 48: Asia Pacific Pet Obesity Management Industry Volume (K Unit), by Country 2025 & 2033
- Figure 49: Asia Pacific Pet Obesity Management Industry Revenue Share (%), by Country 2025 & 2033
- Figure 50: Asia Pacific Pet Obesity Management Industry Volume Share (%), by Country 2025 & 2033
- Figure 51: Middle East and Africa Pet Obesity Management Industry Revenue (billion), by Products 2025 & 2033
- Figure 52: Middle East and Africa Pet Obesity Management Industry Volume (K Unit), by Products 2025 & 2033
- Figure 53: Middle East and Africa Pet Obesity Management Industry Revenue Share (%), by Products 2025 & 2033
- Figure 54: Middle East and Africa Pet Obesity Management Industry Volume Share (%), by Products 2025 & 2033
- Figure 55: Middle East and Africa Pet Obesity Management Industry Revenue (billion), by Animal Type 2025 & 2033
- Figure 56: Middle East and Africa Pet Obesity Management Industry Volume (K Unit), by Animal Type 2025 & 2033
- Figure 57: Middle East and Africa Pet Obesity Management Industry Revenue Share (%), by Animal Type 2025 & 2033
- Figure 58: Middle East and Africa Pet Obesity Management Industry Volume Share (%), by Animal Type 2025 & 2033
- Figure 59: Middle East and Africa Pet Obesity Management Industry Revenue (billion), by End User 2025 & 2033
- Figure 60: Middle East and Africa Pet Obesity Management Industry Volume (K Unit), by End User 2025 & 2033
- Figure 61: Middle East and Africa Pet Obesity Management Industry Revenue Share (%), by End User 2025 & 2033
- Figure 62: Middle East and Africa Pet Obesity Management Industry Volume Share (%), by End User 2025 & 2033
- Figure 63: Middle East and Africa Pet Obesity Management Industry Revenue (billion), by Country 2025 & 2033
- Figure 64: Middle East and Africa Pet Obesity Management Industry Volume (K Unit), by Country 2025 & 2033
- Figure 65: Middle East and Africa Pet Obesity Management Industry Revenue Share (%), by Country 2025 & 2033
- Figure 66: Middle East and Africa Pet Obesity Management Industry Volume Share (%), by Country 2025 & 2033
- Figure 67: South America Pet Obesity Management Industry Revenue (billion), by Products 2025 & 2033
- Figure 68: South America Pet Obesity Management Industry Volume (K Unit), by Products 2025 & 2033
- Figure 69: South America Pet Obesity Management Industry Revenue Share (%), by Products 2025 & 2033
- Figure 70: South America Pet Obesity Management Industry Volume Share (%), by Products 2025 & 2033
- Figure 71: South America Pet Obesity Management Industry Revenue (billion), by Animal Type 2025 & 2033
- Figure 72: South America Pet Obesity Management Industry Volume (K Unit), by Animal Type 2025 & 2033
- Figure 73: South America Pet Obesity Management Industry Revenue Share (%), by Animal Type 2025 & 2033
- Figure 74: South America Pet Obesity Management Industry Volume Share (%), by Animal Type 2025 & 2033
- Figure 75: South America Pet Obesity Management Industry Revenue (billion), by End User 2025 & 2033
- Figure 76: South America Pet Obesity Management Industry Volume (K Unit), by End User 2025 & 2033
- Figure 77: South America Pet Obesity Management Industry Revenue Share (%), by End User 2025 & 2033
- Figure 78: South America Pet Obesity Management Industry Volume Share (%), by End User 2025 & 2033
- Figure 79: South America Pet Obesity Management Industry Revenue (billion), by Country 2025 & 2033
- Figure 80: South America Pet Obesity Management Industry Volume (K Unit), by Country 2025 & 2033
- Figure 81: South America Pet Obesity Management Industry Revenue Share (%), by Country 2025 & 2033
- Figure 82: South America Pet Obesity Management Industry Volume Share (%), by Country 2025 & 2033
List of Tables
- Table 1: Global Pet Obesity Management Industry Revenue billion Forecast, by Products 2020 & 2033
- Table 2: Global Pet Obesity Management Industry Volume K Unit Forecast, by Products 2020 & 2033
- Table 3: Global Pet Obesity Management Industry Revenue billion Forecast, by Animal Type 2020 & 2033
- Table 4: Global Pet Obesity Management Industry Volume K Unit Forecast, by Animal Type 2020 & 2033
- Table 5: Global Pet Obesity Management Industry Revenue billion Forecast, by End User 2020 & 2033
- Table 6: Global Pet Obesity Management Industry Volume K Unit Forecast, by End User 2020 & 2033
- Table 7: Global Pet Obesity Management Industry Revenue billion Forecast, by Region 2020 & 2033
- Table 8: Global Pet Obesity Management Industry Volume K Unit Forecast, by Region 2020 & 2033
- Table 9: Global Pet Obesity Management Industry Revenue billion Forecast, by Products 2020 & 2033
- Table 10: Global Pet Obesity Management Industry Volume K Unit Forecast, by Products 2020 & 2033
- Table 11: Global Pet Obesity Management Industry Revenue billion Forecast, by Animal Type 2020 & 2033
- Table 12: Global Pet Obesity Management Industry Volume K Unit Forecast, by Animal Type 2020 & 2033
- Table 13: Global Pet Obesity Management Industry Revenue billion Forecast, by End User 2020 & 2033
- Table 14: Global Pet Obesity Management Industry Volume K Unit Forecast, by End User 2020 & 2033
- Table 15: Global Pet Obesity Management Industry Revenue billion Forecast, by Country 2020 & 2033
- Table 16: Global Pet Obesity Management Industry Volume K Unit Forecast, by Country 2020 & 2033
- Table 17: United States Pet Obesity Management Industry Revenue (billion) Forecast, by Application 2020 & 2033
- Table 18: United States Pet Obesity Management Industry Volume (K Unit) Forecast, by Application 2020 & 2033
- Table 19: Canada Pet Obesity Management Industry Revenue (billion) Forecast, by Application 2020 & 2033
- Table 20: Canada Pet Obesity Management Industry Volume (K Unit) Forecast, by Application 2020 & 2033
- Table 21: Mexico Pet Obesity Management Industry Revenue (billion) Forecast, by Application 2020 & 2033
- Table 22: Mexico Pet Obesity Management Industry Volume (K Unit) Forecast, by Application 2020 & 2033
- Table 23: Global Pet Obesity Management Industry Revenue billion Forecast, by Products 2020 & 2033
- Table 24: Global Pet Obesity Management Industry Volume K Unit Forecast, by Products 2020 & 2033
- Table 25: Global Pet Obesity Management Industry Revenue billion Forecast, by Animal Type 2020 & 2033
- Table 26: Global Pet Obesity Management Industry Volume K Unit Forecast, by Animal Type 2020 & 2033
- Table 27: Global Pet Obesity Management Industry Revenue billion Forecast, by End User 2020 & 2033
- Table 28: Global Pet Obesity Management Industry Volume K Unit Forecast, by End User 2020 & 2033
- Table 29: Global Pet Obesity Management Industry Revenue billion Forecast, by Country 2020 & 2033
- Table 30: Global Pet Obesity Management Industry Volume K Unit Forecast, by Country 2020 & 2033
- Table 31: Germany Pet Obesity Management Industry Revenue (billion) Forecast, by Application 2020 & 2033
- Table 32: Germany Pet Obesity Management Industry Volume (K Unit) Forecast, by Application 2020 & 2033
- Table 33: United Kingdom Pet Obesity Management Industry Revenue (billion) Forecast, by Application 2020 & 2033
- Table 34: United Kingdom Pet Obesity Management Industry Volume (K Unit) Forecast, by Application 2020 & 2033
- Table 35: France Pet Obesity Management Industry Revenue (billion) Forecast, by Application 2020 & 2033
- Table 36: France Pet Obesity Management Industry Volume (K Unit) Forecast, by Application 2020 & 2033
- Table 37: Italy Pet Obesity Management Industry Revenue (billion) Forecast, by Application 2020 & 2033
- Table 38: Italy Pet Obesity Management Industry Volume (K Unit) Forecast, by Application 2020 & 2033
- Table 39: Spain Pet Obesity Management Industry Revenue (billion) Forecast, by Application 2020 & 2033
- Table 40: Spain Pet Obesity Management Industry Volume (K Unit) Forecast, by Application 2020 & 2033
- Table 41: Rest of Europe Pet Obesity Management Industry Revenue (billion) Forecast, by Application 2020 & 2033
- Table 42: Rest of Europe Pet Obesity Management Industry Volume (K Unit) Forecast, by Application 2020 & 2033
- Table 43: Global Pet Obesity Management Industry Revenue billion Forecast, by Products 2020 & 2033
- Table 44: Global Pet Obesity Management Industry Volume K Unit Forecast, by Products 2020 & 2033
- Table 45: Global Pet Obesity Management Industry Revenue billion Forecast, by Animal Type 2020 & 2033
- Table 46: Global Pet Obesity Management Industry Volume K Unit Forecast, by Animal Type 2020 & 2033
- Table 47: Global Pet Obesity Management Industry Revenue billion Forecast, by End User 2020 & 2033
- Table 48: Global Pet Obesity Management Industry Volume K Unit Forecast, by End User 2020 & 2033
- Table 49: Global Pet Obesity Management Industry Revenue billion Forecast, by Country 2020 & 2033
- Table 50: Global Pet Obesity Management Industry Volume K Unit Forecast, by Country 2020 & 2033
- Table 51: China Pet Obesity Management Industry Revenue (billion) Forecast, by Application 2020 & 2033
- Table 52: China Pet Obesity Management Industry Volume (K Unit) Forecast, by Application 2020 & 2033
- Table 53: Japan Pet Obesity Management Industry Revenue (billion) Forecast, by Application 2020 & 2033
- Table 54: Japan Pet Obesity Management Industry Volume (K Unit) Forecast, by Application 2020 & 2033
- Table 55: India Pet Obesity Management Industry Revenue (billion) Forecast, by Application 2020 & 2033
- Table 56: India Pet Obesity Management Industry Volume (K Unit) Forecast, by Application 2020 & 2033
- Table 57: Australia Pet Obesity Management Industry Revenue (billion) Forecast, by Application 2020 & 2033
- Table 58: Australia Pet Obesity Management Industry Volume (K Unit) Forecast, by Application 2020 & 2033
- Table 59: South Korea Pet Obesity Management Industry Revenue (billion) Forecast, by Application 2020 & 2033
- Table 60: South Korea Pet Obesity Management Industry Volume (K Unit) Forecast, by Application 2020 & 2033
- Table 61: Rest of Asia Pacific Pet Obesity Management Industry Revenue (billion) Forecast, by Application 2020 & 2033
- Table 62: Rest of Asia Pacific Pet Obesity Management Industry Volume (K Unit) Forecast, by Application 2020 & 2033
- Table 63: Global Pet Obesity Management Industry Revenue billion Forecast, by Products 2020 & 2033
- Table 64: Global Pet Obesity Management Industry Volume K Unit Forecast, by Products 2020 & 2033
- Table 65: Global Pet Obesity Management Industry Revenue billion Forecast, by Animal Type 2020 & 2033
- Table 66: Global Pet Obesity Management Industry Volume K Unit Forecast, by Animal Type 2020 & 2033
- Table 67: Global Pet Obesity Management Industry Revenue billion Forecast, by End User 2020 & 2033
- Table 68: Global Pet Obesity Management Industry Volume K Unit Forecast, by End User 2020 & 2033
- Table 69: Global Pet Obesity Management Industry Revenue billion Forecast, by Country 2020 & 2033
- Table 70: Global Pet Obesity Management Industry Volume K Unit Forecast, by Country 2020 & 2033
- Table 71: GCC Pet Obesity Management Industry Revenue (billion) Forecast, by Application 2020 & 2033
- Table 72: GCC Pet Obesity Management Industry Volume (K Unit) Forecast, by Application 2020 & 2033
- Table 73: South Africa Pet Obesity Management Industry Revenue (billion) Forecast, by Application 2020 & 2033
- Table 74: South Africa Pet Obesity Management Industry Volume (K Unit) Forecast, by Application 2020 & 2033
- Table 75: Rest of Middle East and Africa Pet Obesity Management Industry Revenue (billion) Forecast, by Application 2020 & 2033
- Table 76: Rest of Middle East and Africa Pet Obesity Management Industry Volume (K Unit) Forecast, by Application 2020 & 2033
- Table 77: Global Pet Obesity Management Industry Revenue billion Forecast, by Products 2020 & 2033
- Table 78: Global Pet Obesity Management Industry Volume K Unit Forecast, by Products 2020 & 2033
- Table 79: Global Pet Obesity Management Industry Revenue billion Forecast, by Animal Type 2020 & 2033
- Table 80: Global Pet Obesity Management Industry Volume K Unit Forecast, by Animal Type 2020 & 2033
- Table 81: Global Pet Obesity Management Industry Revenue billion Forecast, by End User 2020 & 2033
- Table 82: Global Pet Obesity Management Industry Volume K Unit Forecast, by End User 2020 & 2033
- Table 83: Global Pet Obesity Management Industry Revenue billion Forecast, by Country 2020 & 2033
- Table 84: Global Pet Obesity Management Industry Volume K Unit Forecast, by Country 2020 & 2033
- Table 85: Brazil Pet Obesity Management Industry Revenue (billion) Forecast, by Application 2020 & 2033
- Table 86: Brazil Pet Obesity Management Industry Volume (K Unit) Forecast, by Application 2020 & 2033
- Table 87: Argentina Pet Obesity Management Industry Revenue (billion) Forecast, by Application 2020 & 2033
- Table 88: Argentina Pet Obesity Management Industry Volume (K Unit) Forecast, by Application 2020 & 2033
- Table 89: Rest of South America Pet Obesity Management Industry Revenue (billion) Forecast, by Application 2020 & 2033
- Table 90: Rest of South America Pet Obesity Management Industry Volume (K Unit) Forecast, by Application 2020 & 2033
Frequently Asked Questions
1. What is the projected Compound Annual Growth Rate (CAGR) of the Pet Obesity Management Industry?
The projected CAGR is approximately 13.83%.
2. Which companies are prominent players in the Pet Obesity Management Industry?
Key companies in the market include Park Vet Group, Auxthera LLC, Weight Watchers, Pedigree, Pfizer Animal Health, Vivaldis, KONG Company, Hills Pet Nutrition Inc, Royal Canin.
3. What are the main segments of the Pet Obesity Management Industry?
The market segments include Products, Animal Type, End User.
4. Can you provide details about the market size?
The market size is estimated to be USD 9.67 billion as of 2022.
5. What are some drivers contributing to market growth?
Increasing Pet Ownership; Increasing Prevalence of Diabetes and Other Chronic Diseases Among Pets; Increasing Pet Insurance Policies and Coverage.
6. What are the notable trends driving market growth?
Dogs Segment is Expected to Hold a Major Share in the Pet Obesity Management Market.
7. Are there any restraints impacting market growth?
Lack of Awareness About Pet Obesity Management in Developing Economies.
8. Can you provide examples of recent developments in the market?
In May 2022, Park Vet Group launched the Veterinary Nursing Awareness campaign to raise awareness regarding the importance of veterinary nursing and pet nutrition balances.
9. What pricing options are available for accessing the report?
Pricing options include single-user, multi-user, and enterprise licenses priced at USD 4750, USD 5250, and USD 8750 respectively.
10. Is the market size provided in terms of value or volume?
The market size is provided in terms of value, measured in billion and volume, measured in K Unit.
11. Are there any specific market keywords associated with the report?
Yes, the market keyword associated with the report is "Pet Obesity Management Industry," which aids in identifying and referencing the specific market segment covered.
12. How do I determine which pricing option suits my needs best?
The pricing options vary based on user requirements and access needs. Individual users may opt for single-user licenses, while businesses requiring broader access may choose multi-user or enterprise licenses for cost-effective access to the report.
13. Are there any additional resources or data provided in the Pet Obesity Management Industry report?
While the report offers comprehensive insights, it's advisable to review the specific contents or supplementary materials provided to ascertain if additional resources or data are available.
14. How can I stay updated on further developments or reports in the Pet Obesity Management Industry?
To stay informed about further developments, trends, and reports in the Pet Obesity Management Industry, consider subscribing to industry newsletters, following relevant companies and organizations, or regularly checking reputable industry news sources and publications.
Methodology
Step 1 - Identification of Relevant Samples Size from Population Database


Step 2 - Approaches for Defining Global Market Size (Value, Volume* & Price*)

Note*: In applicable scenarios
Step 3 - Data Sources
Primary Research
- Web Analytics
- Survey Reports
- Research Institute
- Latest Research Reports
- Opinion Leaders
Secondary Research
- Annual Reports
- White Paper
- Latest Press Release
- Industry Association
- Paid Database
- Investor Presentations

Step 4 - Data Triangulation
Involves using different sources of information in order to increase the validity of a study
These sources are likely to be stakeholders in a program - participants, other researchers, program staff, other community members, and so on.
Then we put all data in single framework & apply various statistical tools to find out the dynamic on the market.
During the analysis stage, feedback from the stakeholder groups would be compared to determine areas of agreement as well as areas of divergence