Key Insights
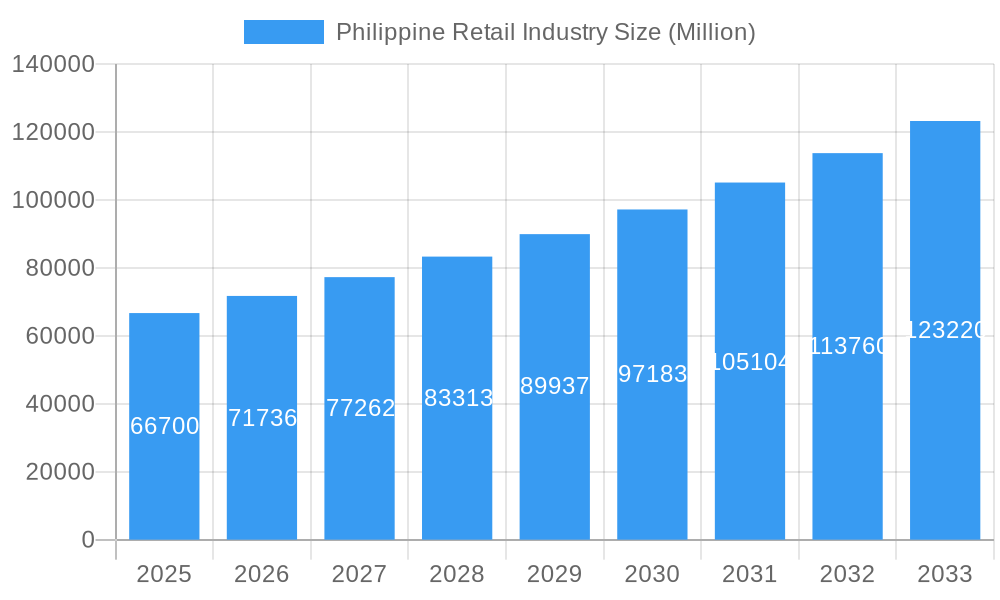
The Philippine retail industry, valued at $66.70 billion in 2025, exhibits robust growth potential, projected to expand at a compound annual growth rate (CAGR) of 7.56% from 2025 to 2033. This expansion is fueled by several key drivers. A burgeoning middle class with increasing disposable income is a significant factor, driving demand for a wider range of goods and services. E-commerce continues its rapid ascent, offering convenience and access to a broader selection of products, particularly in underserved areas. The rise of omnichannel retail strategies, blending online and offline experiences, further enhances consumer engagement and purchasing power. Furthermore, the government's focus on infrastructure development and improved logistics networks facilitate efficient distribution and supply chain management, boosting industry growth. However, challenges persist. Inflationary pressures and fluctuating fuel prices can impact consumer spending and operational costs. Competition, particularly among large retail chains and the emergence of smaller, specialized businesses, remains intense. Maintaining profitability in the face of these pressures necessitates strategic pricing, efficient inventory management, and agile adaptation to evolving consumer preferences.
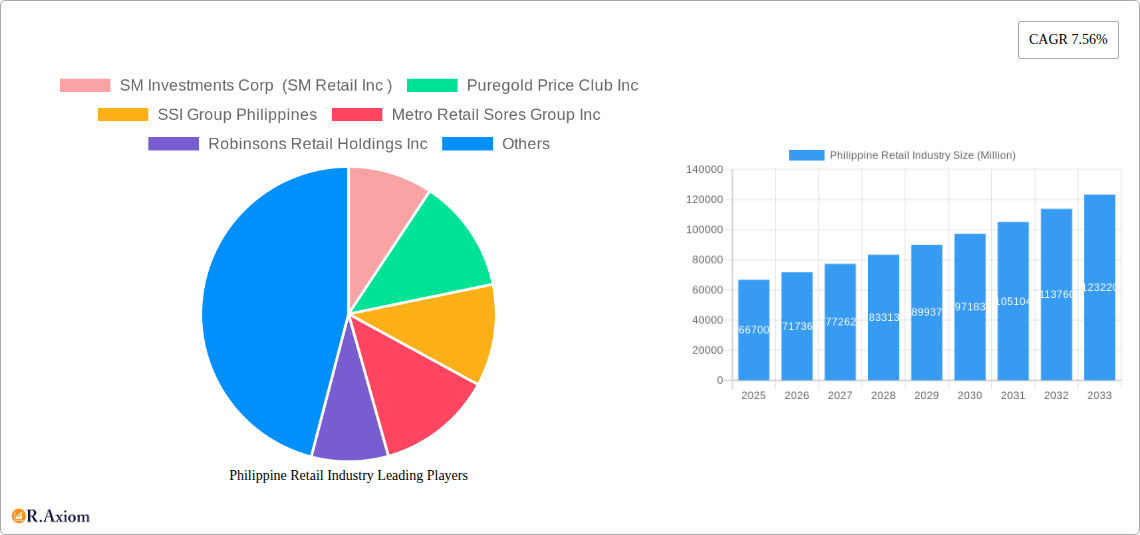
Philippine Retail Industry Market Size (In Billion)
The competitive landscape is dominated by major players like SM Investments Corp (SM Retail Inc.), Puregold Price Club Inc., SSI Group Philippines, Metro Retail Stores Group Inc., Robinsons Retail Holdings Inc., Rustan Supercenters Inc., Alfamart, 7-Eleven, Golden ABC Inc., and Mercury Drug Corp. These companies are vying for market share by employing diverse strategies encompassing expansion into new locations, diversification of product offerings, and investment in technological upgrades to enhance customer experience. Smaller players are also making inroads by focusing on niche markets or offering personalized services. The industry's future trajectory is anticipated to be shaped by innovations in technology, a continued focus on sustainability, and a heightened emphasis on personalization and customer experience. The ongoing evolution of consumer behavior and preferences, coupled with economic shifts, will necessitate ongoing adaptation and strategic planning to maintain competitiveness and capture growth opportunities within this dynamic market.
Philippine Retail Industry Company Market Share
Philippine Retail Industry: A Comprehensive Market Report (2019-2033)
This in-depth report provides a comprehensive analysis of the Philippine retail industry, covering market dynamics, key players, emerging trends, and future growth prospects from 2019 to 2033. The study period spans 2019-2024 (Historical Period), with 2025 as the Base Year and Estimated Year, and a forecast period of 2025-2033. This report is invaluable for investors, industry stakeholders, and businesses seeking to understand and capitalize on the opportunities within this dynamic market. Expect detailed insights on market concentration, innovation drivers, and competitive landscapes, supported by robust data and analysis.
Philippine Retail Industry Market Concentration & Innovation
The Philippine retail landscape is characterized by a mix of large conglomerates and smaller players, leading to a moderately concentrated market. SM Investments Corp (SM Retail Inc), Puregold Price Club Inc, and Robinsons Retail Holdings Inc dominate significant market share, while numerous smaller players cater to niche segments. Market concentration is influenced by factors like economies of scale, brand recognition, and access to capital. Recent years have witnessed increased M&A activity, with deal values exceeding xx Million in the period 2019-2024. The average deal value was approximately xx Million.
Market Share: SM Retail holds approximately xx% market share, Puregold around xx%, and Robinsons Retail holds approximately xx%. These figures are estimates based on available data. The remaining market share is distributed among numerous smaller players.
Innovation Drivers: E-commerce growth, technological advancements in supply chain management, and evolving consumer preferences are key drivers of innovation. Companies are investing heavily in digital platforms, loyalty programs, and personalized shopping experiences.
Regulatory Framework: The Philippine government's policies on foreign direct investment, competition, and consumer protection significantly impact the retail industry. These regulations influence market entry, pricing strategies, and business operations.
Product Substitutes: The rise of e-commerce presents a significant substitute for traditional brick-and-mortar stores. This necessitates retailers to adopt omnichannel strategies to remain competitive.
End-User Trends: Filipino consumers exhibit a growing preference for convenience, value-for-money offerings, and personalized shopping experiences. This trend is driving innovation in product offerings, delivery models, and customer service.
M&A Activities: Consolidation in the market is evident through several mergers and acquisitions, driven by the need for growth, increased market share, and improved operational efficiency.
Philippine Retail Industry Industry Trends & Insights
The Philippine retail industry is experiencing robust growth, fueled by a burgeoning middle class, increasing urbanization, and rising consumer spending. The industry has witnessed significant technological disruptions, including the expansion of e-commerce, the adoption of mobile payment systems, and data analytics driving personalized marketing campaigns.
The Compound Annual Growth Rate (CAGR) for the Philippine retail sector from 2019 to 2024 was approximately xx%, indicating substantial market expansion. Market penetration of e-commerce remains relatively low compared to more developed markets, providing significant growth potential. Consumer preferences are shifting towards omnichannel experiences, expecting seamless transitions between online and offline shopping. Competitive dynamics are characterized by intense price competition, particularly in the grocery and consumer goods segments. Major players continually enhance their offerings through loyalty programs, private labels, and strategic partnerships.
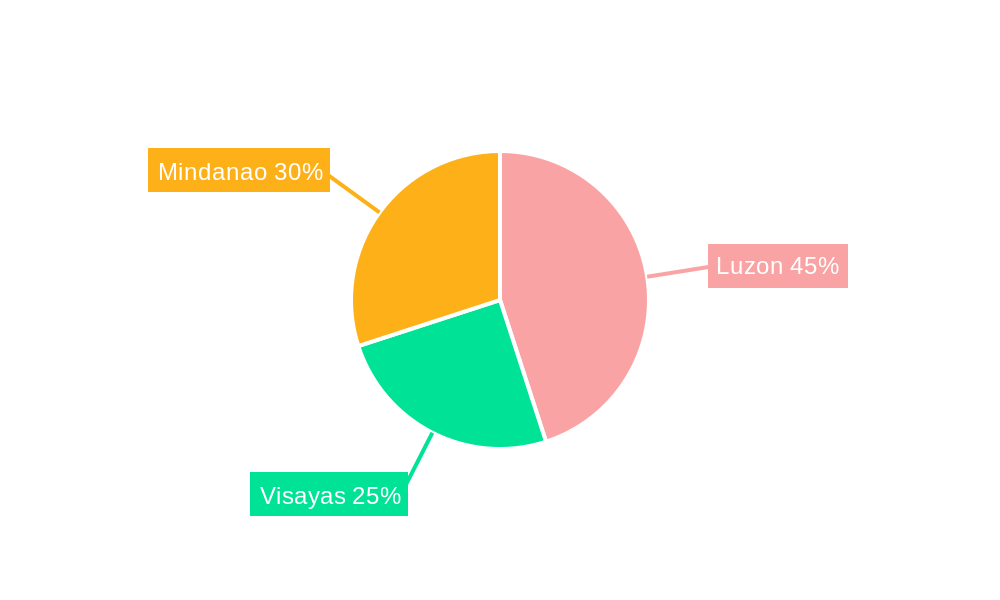
Dominant Markets & Segments in Philippine Retail Industry
The National Capital Region (NCR) remains the dominant market for retail in the Philippines, driven by a high population density, high disposable incomes, and robust infrastructure. However, other regions, particularly key cities in Luzon, Visayas, and Mindanao, are witnessing significant growth, driven by infrastructural developments and economic expansion in these areas.
Key Drivers of NCR Dominance:
- High population density and purchasing power
- Well-developed infrastructure (transportation, logistics)
- Concentration of businesses and commercial activities
- Higher levels of consumer spending and brand awareness
Growth in Other Regions: Government initiatives aimed at regional development, improving infrastructure (roads, transportation, internet access), and investments in tourism are facilitating the expansion of retail businesses in other parts of the country. This diversification offers substantial opportunities for both large and small retailers. Detailed analysis indicates a projected xx% growth in non-NCR regions by 2033.
Philippine Retail Industry Product Developments
The Philippine retail industry is witnessing significant product innovation, driven by technological advancements and evolving consumer preferences. We see increased focus on private label brands, offering competitive pricing and product differentiation. The growth of e-commerce has led to the development of innovative delivery and logistics solutions, enhancing customer convenience. Technological trends like AI-powered personalization and big data analytics are increasingly influencing product development, allowing for more targeted offerings. The market fit for innovative products is high, given the increasing demand for convenience and personalized shopping experiences.
Report Scope & Segmentation Analysis
This report segments the Philippine retail market based on several factors, including product type (e.g., food and beverage, apparel, electronics), distribution channel (e.g., hypermarkets, supermarkets, convenience stores, online retail), and geographic location. Each segment exhibits unique growth projections and competitive dynamics. For instance, the food and beverage segment is expected to exhibit robust growth due to rising consumer spending and changing dietary habits. The online retail segment presents tremendous growth opportunities but faces challenges in terms of logistics and infrastructure in less urbanized areas.
Product Type Segmentation: Detailed analysis is provided for each major product category, outlining market size, growth projections, and competitive landscape.
Distribution Channel Segmentation: Market sizes and growth rates are provided for hypermarkets, supermarkets, convenience stores, e-commerce, and traditional retail formats.
Geographic Segmentation: Analysis of growth opportunities in key regions, considering infrastructural developments and regional economic dynamics.
Key Drivers of Philippine Retail Industry Growth
The Philippine retail industry’s growth is driven by several key factors:
Strong Economic Growth: Sustained economic growth, reflected in rising disposable incomes and consumer spending, fuels demand for retail goods and services.
Expanding Middle Class: The growing middle class increases the number of potential consumers with higher purchasing power.
Technological Advancements: E-commerce, mobile payments, and data analytics are transforming the retail landscape, driving efficiency and enhancing customer experiences.
Favorable Government Policies: Government initiatives supporting infrastructure development, foreign direct investment, and consumer protection contribute to a positive business environment.
Rising Urbanization: Population migration to urban areas increases the density of potential customers and boosts demand.
Challenges in the Philippine Retail Industry Sector
Despite significant growth potential, several challenges hinder the Philippine retail industry:
Infrastructure Limitations: Inadequate transportation and logistics networks, especially in rural areas, can hamper efficient delivery and increase operational costs.
High Inflation and Economic Uncertainty: Fluctuations in inflation and economic uncertainty can affect consumer spending and business investment.
Intense Competition: The competitive landscape is characterized by intense price competition, requiring retailers to continuously adapt and innovate.
Supply Chain Disruptions: Global supply chain disruptions can impact product availability and increase operational costs.
Emerging Opportunities in Philippine Retail Industry
Emerging opportunities within the Philippine retail sector include:
Growth of E-commerce: The continued expansion of e-commerce provides opportunities for retailers to reach a wider customer base and offer innovative shopping experiences.
Focus on Omnichannel Strategies: Retailers can gain a competitive advantage by seamlessly integrating online and offline retail channels.
Personalized Marketing: Utilizing data analytics for targeted marketing campaigns enables better customer engagement and increases sales.
Expansion into Underserved Markets: Retailers can tap into the growth potential of less developed regions by addressing infrastructure challenges and catering to specific local needs.
Leading Players in the Philippine Retail Industry Market
- SM Investments Corp (SM Retail Inc)
- Puregold Price Club Inc
- SSI Group Philippines
- Metro Retail Stores Group Inc
- Robinsons Retail Holdings Inc
- Rustan Supercenters Inc
- Alfamart
- 7-Eleven
- Golden ABC Inc
- Mercury Drug Corp
Key Developments in Philippine Retail Industry Industry
January 2024: Robinsons Retail partners with DFI Retail to launch Meadows, a premium brand offering food, beverages, home goods, and beauty products. This expands Robinsons' product portfolio and caters to a higher-end market segment.
February 2024: Rose Pharmacy opens its 400th store, showcasing a partnership with Guardian (DFI Retail) for health and wellness products. This signifies expansion in the healthcare retail sector and strengthens Rose Pharmacy's market position.
Strategic Outlook for Philippine Retail Industry Market
The Philippine retail industry is poised for continued growth, driven by strong economic fundamentals, expanding consumer base, and technological advancements. Opportunities abound for retailers to capitalize on the increasing adoption of e-commerce, the rising demand for personalized shopping experiences, and the expansion into underserved markets. Strategic partnerships, investment in technology, and agile adaptation to changing consumer preferences will be crucial for success in this dynamic and competitive landscape. Continued growth in both online and offline retail channels is expected throughout the forecast period, with potential for significant market expansion in the coming years.
Philippine Retail Industry Segmentation
-
1. Products
- 1.1. Food and Beverage
- 1.2. Personal and Household Care
- 1.3. Apparel
- 1.4. Footwear and Accessories
- 1.5. Furniture
- 1.6. Toys and Hobbies
- 1.7. Electronic and Household Appliances
- 1.8. Other Products
-
2. Distribution Channel
- 2.1. Supermarkets/Hypermarkets
- 2.2. Convenience Stores
- 2.3. Department Stores
- 2.4. Specialty Stores
- 2.5. Online
- 2.6. Other Distribution Channels
Philippine Retail Industry Segmentation By Geography
-
1. North America
- 1.1. United States
- 1.2. Canada
- 1.3. Mexico
-
2. South America
- 2.1. Brazil
- 2.2. Argentina
- 2.3. Rest of South America
-
3. Europe
- 3.1. United Kingdom
- 3.2. Germany
- 3.3. France
- 3.4. Italy
- 3.5. Spain
- 3.6. Russia
- 3.7. Benelux
- 3.8. Nordics
- 3.9. Rest of Europe
-
4. Middle East & Africa
- 4.1. Turkey
- 4.2. Israel
- 4.3. GCC
- 4.4. North Africa
- 4.5. South Africa
- 4.6. Rest of Middle East & Africa
-
5. Asia Pacific
- 5.1. China
- 5.2. India
- 5.3. Japan
- 5.4. South Korea
- 5.5. ASEAN
- 5.6. Oceania
- 5.7. Rest of Asia Pacific
Philippine Retail Industry Regional Market Share
Geographic Coverage of Philippine Retail Industry
Philippine Retail Industry REPORT HIGHLIGHTS
| Aspects | Details |
|---|---|
| Study Period | 2020-2034 |
| Base Year | 2025 |
| Estimated Year | 2026 |
| Forecast Period | 2026-2034 |
| Historical Period | 2020-2025 |
| Growth Rate | CAGR of 7.56% from 2020-2034 |
| Segmentation |
|
Table of Contents
- 1. Introduction
- 1.1. Research Scope
- 1.2. Market Segmentation
- 1.3. Research Objective
- 1.4. Definitions and Assumptions
- 2. Executive Summary
- 2.1. Market Snapshot
- 3. Market Dynamics
- 3.1. Market Drivers
- 3.2. Market Restrains
- 3.3. Market Trends
- 3.4. Market Opportunities
- 4. Market Factor Analysis
- 4.1. Porters Five Forces
- 4.1.1. Bargaining Power of Suppliers
- 4.1.2. Bargaining Power of Buyers
- 4.1.3. Threat of New Entrants
- 4.1.4. Threat of Substitutes
- 4.1.5. Competitive Rivalry
- 4.2. PESTEL analysis
- 4.3. BCG Analysis
- 4.3.1. Stars (High Growth, High Market Share)
- 4.3.2. Cash Cows (Low Growth, High Market Share)
- 4.3.3. Question Mark (High Growth, Low Market Share)
- 4.3.4. Dogs (Low Growth, Low Market Share)
- 4.4. Ansoff Matrix Analysis
- 4.5. Supply Chain Analysis
- 4.6. Regulatory Landscape
- 4.7. Current Market Potential and Opportunity Assessment (TAM–SAM–SOM Framework)
- 4.8. RAX Analyst Note
- 4.1. Porters Five Forces
- 5. Market Analysis, Insights and Forecast 2021-2033
- 5.1. Market Analysis, Insights and Forecast - by Products
- 5.1.1. Food and Beverage
- 5.1.2. Personal and Household Care
- 5.1.3. Apparel
- 5.1.4. Footwear and Accessories
- 5.1.5. Furniture
- 5.1.6. Toys and Hobbies
- 5.1.7. Electronic and Household Appliances
- 5.1.8. Other Products
- 5.2. Market Analysis, Insights and Forecast - by Distribution Channel
- 5.2.1. Supermarkets/Hypermarkets
- 5.2.2. Convenience Stores
- 5.2.3. Department Stores
- 5.2.4. Specialty Stores
- 5.2.5. Online
- 5.2.6. Other Distribution Channels
- 5.3. Market Analysis, Insights and Forecast - by Region
- 5.3.1. North America
- 5.3.2. South America
- 5.3.3. Europe
- 5.3.4. Middle East & Africa
- 5.3.5. Asia Pacific
- 5.1. Market Analysis, Insights and Forecast - by Products
- 6. Global Philippine Retail Industry Analysis, Insights and Forecast, 2021-2033
- 6.1. Market Analysis, Insights and Forecast - by Products
- 6.1.1. Food and Beverage
- 6.1.2. Personal and Household Care
- 6.1.3. Apparel
- 6.1.4. Footwear and Accessories
- 6.1.5. Furniture
- 6.1.6. Toys and Hobbies
- 6.1.7. Electronic and Household Appliances
- 6.1.8. Other Products
- 6.2. Market Analysis, Insights and Forecast - by Distribution Channel
- 6.2.1. Supermarkets/Hypermarkets
- 6.2.2. Convenience Stores
- 6.2.3. Department Stores
- 6.2.4. Specialty Stores
- 6.2.5. Online
- 6.2.6. Other Distribution Channels
- 6.1. Market Analysis, Insights and Forecast - by Products
- 7. North America Philippine Retail Industry Analysis, Insights and Forecast, 2020-2032
- 7.1. Market Analysis, Insights and Forecast - by Products
- 7.1.1. Food and Beverage
- 7.1.2. Personal and Household Care
- 7.1.3. Apparel
- 7.1.4. Footwear and Accessories
- 7.1.5. Furniture
- 7.1.6. Toys and Hobbies
- 7.1.7. Electronic and Household Appliances
- 7.1.8. Other Products
- 7.2. Market Analysis, Insights and Forecast - by Distribution Channel
- 7.2.1. Supermarkets/Hypermarkets
- 7.2.2. Convenience Stores
- 7.2.3. Department Stores
- 7.2.4. Specialty Stores
- 7.2.5. Online
- 7.2.6. Other Distribution Channels
- 7.1. Market Analysis, Insights and Forecast - by Products
- 8. South America Philippine Retail Industry Analysis, Insights and Forecast, 2020-2032
- 8.1. Market Analysis, Insights and Forecast - by Products
- 8.1.1. Food and Beverage
- 8.1.2. Personal and Household Care
- 8.1.3. Apparel
- 8.1.4. Footwear and Accessories
- 8.1.5. Furniture
- 8.1.6. Toys and Hobbies
- 8.1.7. Electronic and Household Appliances
- 8.1.8. Other Products
- 8.2. Market Analysis, Insights and Forecast - by Distribution Channel
- 8.2.1. Supermarkets/Hypermarkets
- 8.2.2. Convenience Stores
- 8.2.3. Department Stores
- 8.2.4. Specialty Stores
- 8.2.5. Online
- 8.2.6. Other Distribution Channels
- 8.1. Market Analysis, Insights and Forecast - by Products
- 9. Europe Philippine Retail Industry Analysis, Insights and Forecast, 2020-2032
- 9.1. Market Analysis, Insights and Forecast - by Products
- 9.1.1. Food and Beverage
- 9.1.2. Personal and Household Care
- 9.1.3. Apparel
- 9.1.4. Footwear and Accessories
- 9.1.5. Furniture
- 9.1.6. Toys and Hobbies
- 9.1.7. Electronic and Household Appliances
- 9.1.8. Other Products
- 9.2. Market Analysis, Insights and Forecast - by Distribution Channel
- 9.2.1. Supermarkets/Hypermarkets
- 9.2.2. Convenience Stores
- 9.2.3. Department Stores
- 9.2.4. Specialty Stores
- 9.2.5. Online
- 9.2.6. Other Distribution Channels
- 9.1. Market Analysis, Insights and Forecast - by Products
- 10. Middle East & Africa Philippine Retail Industry Analysis, Insights and Forecast, 2020-2032
- 10.1. Market Analysis, Insights and Forecast - by Products
- 10.1.1. Food and Beverage
- 10.1.2. Personal and Household Care
- 10.1.3. Apparel
- 10.1.4. Footwear and Accessories
- 10.1.5. Furniture
- 10.1.6. Toys and Hobbies
- 10.1.7. Electronic and Household Appliances
- 10.1.8. Other Products
- 10.2. Market Analysis, Insights and Forecast - by Distribution Channel
- 10.2.1. Supermarkets/Hypermarkets
- 10.2.2. Convenience Stores
- 10.2.3. Department Stores
- 10.2.4. Specialty Stores
- 10.2.5. Online
- 10.2.6. Other Distribution Channels
- 10.1. Market Analysis, Insights and Forecast - by Products
- 11. Asia Pacific Philippine Retail Industry Analysis, Insights and Forecast, 2020-2032
- 11.1. Market Analysis, Insights and Forecast - by Products
- 11.1.1. Food and Beverage
- 11.1.2. Personal and Household Care
- 11.1.3. Apparel
- 11.1.4. Footwear and Accessories
- 11.1.5. Furniture
- 11.1.6. Toys and Hobbies
- 11.1.7. Electronic and Household Appliances
- 11.1.8. Other Products
- 11.2. Market Analysis, Insights and Forecast - by Distribution Channel
- 11.2.1. Supermarkets/Hypermarkets
- 11.2.2. Convenience Stores
- 11.2.3. Department Stores
- 11.2.4. Specialty Stores
- 11.2.5. Online
- 11.2.6. Other Distribution Channels
- 11.1. Market Analysis, Insights and Forecast - by Products
- 12. Competitive Analysis
- 12.1. Company Profiles
- 12.1.1 SM Investments Corp (SM Retail Inc )
- 12.1.1.1. Company Overview
- 12.1.1.2. Products
- 12.1.1.3. Company Financials
- 12.1.1.4. SWOT Analysis
- 12.1.2 Puregold Price Club Inc
- 12.1.2.1. Company Overview
- 12.1.2.2. Products
- 12.1.2.3. Company Financials
- 12.1.2.4. SWOT Analysis
- 12.1.3 SSI Group Philippines
- 12.1.3.1. Company Overview
- 12.1.3.2. Products
- 12.1.3.3. Company Financials
- 12.1.3.4. SWOT Analysis
- 12.1.4 Metro Retail Sores Group Inc
- 12.1.4.1. Company Overview
- 12.1.4.2. Products
- 12.1.4.3. Company Financials
- 12.1.4.4. SWOT Analysis
- 12.1.5 Robinsons Retail Holdings Inc
- 12.1.5.1. Company Overview
- 12.1.5.2. Products
- 12.1.5.3. Company Financials
- 12.1.5.4. SWOT Analysis
- 12.1.6 Rustan Supercenters Inc
- 12.1.6.1. Company Overview
- 12.1.6.2. Products
- 12.1.6.3. Company Financials
- 12.1.6.4. SWOT Analysis
- 12.1.7 Alfamart
- 12.1.7.1. Company Overview
- 12.1.7.2. Products
- 12.1.7.3. Company Financials
- 12.1.7.4. SWOT Analysis
- 12.1.8 7-Eleven
- 12.1.8.1. Company Overview
- 12.1.8.2. Products
- 12.1.8.3. Company Financials
- 12.1.8.4. SWOT Analysis
- 12.1.9 Golden ABC Inc
- 12.1.9.1. Company Overview
- 12.1.9.2. Products
- 12.1.9.3. Company Financials
- 12.1.9.4. SWOT Analysis
- 12.1.10 Mercury Drug Corp **List Not Exhaustive
- 12.1.10.1. Company Overview
- 12.1.10.2. Products
- 12.1.10.3. Company Financials
- 12.1.10.4. SWOT Analysis
- 12.1.1 SM Investments Corp (SM Retail Inc )
- 12.2. Market Entropy
- 12.2.1 Company's Key Areas Served
- 12.2.2 Recent Developments
- 12.3. Company Market Share Analysis 2025
- 12.3.1 Top 5 Companies Market Share Analysis
- 12.3.2 Top 3 Companies Market Share Analysis
- 12.4. List of Potential Customers
- 13. Research Methodology
List of Figures
- Figure 1: Global Philippine Retail Industry Revenue Breakdown (Million, %) by Region 2025 & 2033
- Figure 2: Global Philippine Retail Industry Volume Breakdown (Billion, %) by Region 2025 & 2033
- Figure 3: North America Philippine Retail Industry Revenue (Million), by Products 2025 & 2033
- Figure 4: North America Philippine Retail Industry Volume (Billion), by Products 2025 & 2033
- Figure 5: North America Philippine Retail Industry Revenue Share (%), by Products 2025 & 2033
- Figure 6: North America Philippine Retail Industry Volume Share (%), by Products 2025 & 2033
- Figure 7: North America Philippine Retail Industry Revenue (Million), by Distribution Channel 2025 & 2033
- Figure 8: North America Philippine Retail Industry Volume (Billion), by Distribution Channel 2025 & 2033
- Figure 9: North America Philippine Retail Industry Revenue Share (%), by Distribution Channel 2025 & 2033
- Figure 10: North America Philippine Retail Industry Volume Share (%), by Distribution Channel 2025 & 2033
- Figure 11: North America Philippine Retail Industry Revenue (Million), by Country 2025 & 2033
- Figure 12: North America Philippine Retail Industry Volume (Billion), by Country 2025 & 2033
- Figure 13: North America Philippine Retail Industry Revenue Share (%), by Country 2025 & 2033
- Figure 14: North America Philippine Retail Industry Volume Share (%), by Country 2025 & 2033
- Figure 15: South America Philippine Retail Industry Revenue (Million), by Products 2025 & 2033
- Figure 16: South America Philippine Retail Industry Volume (Billion), by Products 2025 & 2033
- Figure 17: South America Philippine Retail Industry Revenue Share (%), by Products 2025 & 2033
- Figure 18: South America Philippine Retail Industry Volume Share (%), by Products 2025 & 2033
- Figure 19: South America Philippine Retail Industry Revenue (Million), by Distribution Channel 2025 & 2033
- Figure 20: South America Philippine Retail Industry Volume (Billion), by Distribution Channel 2025 & 2033
- Figure 21: South America Philippine Retail Industry Revenue Share (%), by Distribution Channel 2025 & 2033
- Figure 22: South America Philippine Retail Industry Volume Share (%), by Distribution Channel 2025 & 2033
- Figure 23: South America Philippine Retail Industry Revenue (Million), by Country 2025 & 2033
- Figure 24: South America Philippine Retail Industry Volume (Billion), by Country 2025 & 2033
- Figure 25: South America Philippine Retail Industry Revenue Share (%), by Country 2025 & 2033
- Figure 26: South America Philippine Retail Industry Volume Share (%), by Country 2025 & 2033
- Figure 27: Europe Philippine Retail Industry Revenue (Million), by Products 2025 & 2033
- Figure 28: Europe Philippine Retail Industry Volume (Billion), by Products 2025 & 2033
- Figure 29: Europe Philippine Retail Industry Revenue Share (%), by Products 2025 & 2033
- Figure 30: Europe Philippine Retail Industry Volume Share (%), by Products 2025 & 2033
- Figure 31: Europe Philippine Retail Industry Revenue (Million), by Distribution Channel 2025 & 2033
- Figure 32: Europe Philippine Retail Industry Volume (Billion), by Distribution Channel 2025 & 2033
- Figure 33: Europe Philippine Retail Industry Revenue Share (%), by Distribution Channel 2025 & 2033
- Figure 34: Europe Philippine Retail Industry Volume Share (%), by Distribution Channel 2025 & 2033
- Figure 35: Europe Philippine Retail Industry Revenue (Million), by Country 2025 & 2033
- Figure 36: Europe Philippine Retail Industry Volume (Billion), by Country 2025 & 2033
- Figure 37: Europe Philippine Retail Industry Revenue Share (%), by Country 2025 & 2033
- Figure 38: Europe Philippine Retail Industry Volume Share (%), by Country 2025 & 2033
- Figure 39: Middle East & Africa Philippine Retail Industry Revenue (Million), by Products 2025 & 2033
- Figure 40: Middle East & Africa Philippine Retail Industry Volume (Billion), by Products 2025 & 2033
- Figure 41: Middle East & Africa Philippine Retail Industry Revenue Share (%), by Products 2025 & 2033
- Figure 42: Middle East & Africa Philippine Retail Industry Volume Share (%), by Products 2025 & 2033
- Figure 43: Middle East & Africa Philippine Retail Industry Revenue (Million), by Distribution Channel 2025 & 2033
- Figure 44: Middle East & Africa Philippine Retail Industry Volume (Billion), by Distribution Channel 2025 & 2033
- Figure 45: Middle East & Africa Philippine Retail Industry Revenue Share (%), by Distribution Channel 2025 & 2033
- Figure 46: Middle East & Africa Philippine Retail Industry Volume Share (%), by Distribution Channel 2025 & 2033
- Figure 47: Middle East & Africa Philippine Retail Industry Revenue (Million), by Country 2025 & 2033
- Figure 48: Middle East & Africa Philippine Retail Industry Volume (Billion), by Country 2025 & 2033
- Figure 49: Middle East & Africa Philippine Retail Industry Revenue Share (%), by Country 2025 & 2033
- Figure 50: Middle East & Africa Philippine Retail Industry Volume Share (%), by Country 2025 & 2033
- Figure 51: Asia Pacific Philippine Retail Industry Revenue (Million), by Products 2025 & 2033
- Figure 52: Asia Pacific Philippine Retail Industry Volume (Billion), by Products 2025 & 2033
- Figure 53: Asia Pacific Philippine Retail Industry Revenue Share (%), by Products 2025 & 2033
- Figure 54: Asia Pacific Philippine Retail Industry Volume Share (%), by Products 2025 & 2033
- Figure 55: Asia Pacific Philippine Retail Industry Revenue (Million), by Distribution Channel 2025 & 2033
- Figure 56: Asia Pacific Philippine Retail Industry Volume (Billion), by Distribution Channel 2025 & 2033
- Figure 57: Asia Pacific Philippine Retail Industry Revenue Share (%), by Distribution Channel 2025 & 2033
- Figure 58: Asia Pacific Philippine Retail Industry Volume Share (%), by Distribution Channel 2025 & 2033
- Figure 59: Asia Pacific Philippine Retail Industry Revenue (Million), by Country 2025 & 2033
- Figure 60: Asia Pacific Philippine Retail Industry Volume (Billion), by Country 2025 & 2033
- Figure 61: Asia Pacific Philippine Retail Industry Revenue Share (%), by Country 2025 & 2033
- Figure 62: Asia Pacific Philippine Retail Industry Volume Share (%), by Country 2025 & 2033
List of Tables
- Table 1: Global Philippine Retail Industry Revenue Million Forecast, by Products 2020 & 2033
- Table 2: Global Philippine Retail Industry Volume Billion Forecast, by Products 2020 & 2033
- Table 3: Global Philippine Retail Industry Revenue Million Forecast, by Distribution Channel 2020 & 2033
- Table 4: Global Philippine Retail Industry Volume Billion Forecast, by Distribution Channel 2020 & 2033
- Table 5: Global Philippine Retail Industry Revenue Million Forecast, by Region 2020 & 2033
- Table 6: Global Philippine Retail Industry Volume Billion Forecast, by Region 2020 & 2033
- Table 7: Global Philippine Retail Industry Revenue Million Forecast, by Products 2020 & 2033
- Table 8: Global Philippine Retail Industry Volume Billion Forecast, by Products 2020 & 2033
- Table 9: Global Philippine Retail Industry Revenue Million Forecast, by Distribution Channel 2020 & 2033
- Table 10: Global Philippine Retail Industry Volume Billion Forecast, by Distribution Channel 2020 & 2033
- Table 11: Global Philippine Retail Industry Revenue Million Forecast, by Country 2020 & 2033
- Table 12: Global Philippine Retail Industry Volume Billion Forecast, by Country 2020 & 2033
- Table 13: United States Philippine Retail Industry Revenue (Million) Forecast, by Application 2020 & 2033
- Table 14: United States Philippine Retail Industry Volume (Billion) Forecast, by Application 2020 & 2033
- Table 15: Canada Philippine Retail Industry Revenue (Million) Forecast, by Application 2020 & 2033
- Table 16: Canada Philippine Retail Industry Volume (Billion) Forecast, by Application 2020 & 2033
- Table 17: Mexico Philippine Retail Industry Revenue (Million) Forecast, by Application 2020 & 2033
- Table 18: Mexico Philippine Retail Industry Volume (Billion) Forecast, by Application 2020 & 2033
- Table 19: Global Philippine Retail Industry Revenue Million Forecast, by Products 2020 & 2033
- Table 20: Global Philippine Retail Industry Volume Billion Forecast, by Products 2020 & 2033
- Table 21: Global Philippine Retail Industry Revenue Million Forecast, by Distribution Channel 2020 & 2033
- Table 22: Global Philippine Retail Industry Volume Billion Forecast, by Distribution Channel 2020 & 2033
- Table 23: Global Philippine Retail Industry Revenue Million Forecast, by Country 2020 & 2033
- Table 24: Global Philippine Retail Industry Volume Billion Forecast, by Country 2020 & 2033
- Table 25: Brazil Philippine Retail Industry Revenue (Million) Forecast, by Application 2020 & 2033
- Table 26: Brazil Philippine Retail Industry Volume (Billion) Forecast, by Application 2020 & 2033
- Table 27: Argentina Philippine Retail Industry Revenue (Million) Forecast, by Application 2020 & 2033
- Table 28: Argentina Philippine Retail Industry Volume (Billion) Forecast, by Application 2020 & 2033
- Table 29: Rest of South America Philippine Retail Industry Revenue (Million) Forecast, by Application 2020 & 2033
- Table 30: Rest of South America Philippine Retail Industry Volume (Billion) Forecast, by Application 2020 & 2033
- Table 31: Global Philippine Retail Industry Revenue Million Forecast, by Products 2020 & 2033
- Table 32: Global Philippine Retail Industry Volume Billion Forecast, by Products 2020 & 2033
- Table 33: Global Philippine Retail Industry Revenue Million Forecast, by Distribution Channel 2020 & 2033
- Table 34: Global Philippine Retail Industry Volume Billion Forecast, by Distribution Channel 2020 & 2033
- Table 35: Global Philippine Retail Industry Revenue Million Forecast, by Country 2020 & 2033
- Table 36: Global Philippine Retail Industry Volume Billion Forecast, by Country 2020 & 2033
- Table 37: United Kingdom Philippine Retail Industry Revenue (Million) Forecast, by Application 2020 & 2033
- Table 38: United Kingdom Philippine Retail Industry Volume (Billion) Forecast, by Application 2020 & 2033
- Table 39: Germany Philippine Retail Industry Revenue (Million) Forecast, by Application 2020 & 2033
- Table 40: Germany Philippine Retail Industry Volume (Billion) Forecast, by Application 2020 & 2033
- Table 41: France Philippine Retail Industry Revenue (Million) Forecast, by Application 2020 & 2033
- Table 42: France Philippine Retail Industry Volume (Billion) Forecast, by Application 2020 & 2033
- Table 43: Italy Philippine Retail Industry Revenue (Million) Forecast, by Application 2020 & 2033
- Table 44: Italy Philippine Retail Industry Volume (Billion) Forecast, by Application 2020 & 2033
- Table 45: Spain Philippine Retail Industry Revenue (Million) Forecast, by Application 2020 & 2033
- Table 46: Spain Philippine Retail Industry Volume (Billion) Forecast, by Application 2020 & 2033
- Table 47: Russia Philippine Retail Industry Revenue (Million) Forecast, by Application 2020 & 2033
- Table 48: Russia Philippine Retail Industry Volume (Billion) Forecast, by Application 2020 & 2033
- Table 49: Benelux Philippine Retail Industry Revenue (Million) Forecast, by Application 2020 & 2033
- Table 50: Benelux Philippine Retail Industry Volume (Billion) Forecast, by Application 2020 & 2033
- Table 51: Nordics Philippine Retail Industry Revenue (Million) Forecast, by Application 2020 & 2033
- Table 52: Nordics Philippine Retail Industry Volume (Billion) Forecast, by Application 2020 & 2033
- Table 53: Rest of Europe Philippine Retail Industry Revenue (Million) Forecast, by Application 2020 & 2033
- Table 54: Rest of Europe Philippine Retail Industry Volume (Billion) Forecast, by Application 2020 & 2033
- Table 55: Global Philippine Retail Industry Revenue Million Forecast, by Products 2020 & 2033
- Table 56: Global Philippine Retail Industry Volume Billion Forecast, by Products 2020 & 2033
- Table 57: Global Philippine Retail Industry Revenue Million Forecast, by Distribution Channel 2020 & 2033
- Table 58: Global Philippine Retail Industry Volume Billion Forecast, by Distribution Channel 2020 & 2033
- Table 59: Global Philippine Retail Industry Revenue Million Forecast, by Country 2020 & 2033
- Table 60: Global Philippine Retail Industry Volume Billion Forecast, by Country 2020 & 2033
- Table 61: Turkey Philippine Retail Industry Revenue (Million) Forecast, by Application 2020 & 2033
- Table 62: Turkey Philippine Retail Industry Volume (Billion) Forecast, by Application 2020 & 2033
- Table 63: Israel Philippine Retail Industry Revenue (Million) Forecast, by Application 2020 & 2033
- Table 64: Israel Philippine Retail Industry Volume (Billion) Forecast, by Application 2020 & 2033
- Table 65: GCC Philippine Retail Industry Revenue (Million) Forecast, by Application 2020 & 2033
- Table 66: GCC Philippine Retail Industry Volume (Billion) Forecast, by Application 2020 & 2033
- Table 67: North Africa Philippine Retail Industry Revenue (Million) Forecast, by Application 2020 & 2033
- Table 68: North Africa Philippine Retail Industry Volume (Billion) Forecast, by Application 2020 & 2033
- Table 69: South Africa Philippine Retail Industry Revenue (Million) Forecast, by Application 2020 & 2033
- Table 70: South Africa Philippine Retail Industry Volume (Billion) Forecast, by Application 2020 & 2033
- Table 71: Rest of Middle East & Africa Philippine Retail Industry Revenue (Million) Forecast, by Application 2020 & 2033
- Table 72: Rest of Middle East & Africa Philippine Retail Industry Volume (Billion) Forecast, by Application 2020 & 2033
- Table 73: Global Philippine Retail Industry Revenue Million Forecast, by Products 2020 & 2033
- Table 74: Global Philippine Retail Industry Volume Billion Forecast, by Products 2020 & 2033
- Table 75: Global Philippine Retail Industry Revenue Million Forecast, by Distribution Channel 2020 & 2033
- Table 76: Global Philippine Retail Industry Volume Billion Forecast, by Distribution Channel 2020 & 2033
- Table 77: Global Philippine Retail Industry Revenue Million Forecast, by Country 2020 & 2033
- Table 78: Global Philippine Retail Industry Volume Billion Forecast, by Country 2020 & 2033
- Table 79: China Philippine Retail Industry Revenue (Million) Forecast, by Application 2020 & 2033
- Table 80: China Philippine Retail Industry Volume (Billion) Forecast, by Application 2020 & 2033
- Table 81: India Philippine Retail Industry Revenue (Million) Forecast, by Application 2020 & 2033
- Table 82: India Philippine Retail Industry Volume (Billion) Forecast, by Application 2020 & 2033
- Table 83: Japan Philippine Retail Industry Revenue (Million) Forecast, by Application 2020 & 2033
- Table 84: Japan Philippine Retail Industry Volume (Billion) Forecast, by Application 2020 & 2033
- Table 85: South Korea Philippine Retail Industry Revenue (Million) Forecast, by Application 2020 & 2033
- Table 86: South Korea Philippine Retail Industry Volume (Billion) Forecast, by Application 2020 & 2033
- Table 87: ASEAN Philippine Retail Industry Revenue (Million) Forecast, by Application 2020 & 2033
- Table 88: ASEAN Philippine Retail Industry Volume (Billion) Forecast, by Application 2020 & 2033
- Table 89: Oceania Philippine Retail Industry Revenue (Million) Forecast, by Application 2020 & 2033
- Table 90: Oceania Philippine Retail Industry Volume (Billion) Forecast, by Application 2020 & 2033
- Table 91: Rest of Asia Pacific Philippine Retail Industry Revenue (Million) Forecast, by Application 2020 & 2033
- Table 92: Rest of Asia Pacific Philippine Retail Industry Volume (Billion) Forecast, by Application 2020 & 2033
Frequently Asked Questions
1. What is the projected Compound Annual Growth Rate (CAGR) of the Philippine Retail Industry?
The projected CAGR is approximately 7.56%.
2. Which companies are prominent players in the Philippine Retail Industry?
Key companies in the market include SM Investments Corp (SM Retail Inc ), Puregold Price Club Inc, SSI Group Philippines, Metro Retail Sores Group Inc, Robinsons Retail Holdings Inc, Rustan Supercenters Inc, Alfamart, 7-Eleven, Golden ABC Inc, Mercury Drug Corp **List Not Exhaustive.
3. What are the main segments of the Philippine Retail Industry?
The market segments include Products, Distribution Channel.
4. Can you provide details about the market size?
The market size is estimated to be USD 66.70 Million as of 2022.
5. What are some drivers contributing to market growth?
The Rising Demand for Packaged and Ready to Eat Food is Driving the Market; Increase in the Demand for Branded Goods Categories such as Apparel. Cosmetics. Footwear. Watches. Beverages. and Food.
6. What are the notable trends driving market growth?
The Philippines' Food and Beverage Sector: A Key Pillar of the Nation's Economy.
7. Are there any restraints impacting market growth?
The Rising Demand for Packaged and Ready to Eat Food is Driving the Market; Increase in the Demand for Branded Goods Categories such as Apparel. Cosmetics. Footwear. Watches. Beverages. and Food.
8. Can you provide examples of recent developments in the market?
February 2024: Rose Pharmacy, a prominent player in the Philippine healthcare retail sector, marked a significant milestone on January 29, 2024, with the inauguration of its 400th store. Strategically located at Nustar Resort and Casino in Cebu City, this new outlet stands as a comprehensive destination for health and wellness needs. Beyond offering a diverse range of medicines, Rose Pharmacy's newest store showcases an array of products from Guardian, a leading Southeast Asian health and wellness brand. Notably, Guardian is under the ownership of DFI Retail and enjoys exclusive distribution through Rose Pharmacy in the Philippines.
9. What pricing options are available for accessing the report?
Pricing options include single-user, multi-user, and enterprise licenses priced at USD 3800, USD 4500, and USD 5800 respectively.
10. Is the market size provided in terms of value or volume?
The market size is provided in terms of value, measured in Million and volume, measured in Billion.
11. Are there any specific market keywords associated with the report?
Yes, the market keyword associated with the report is "Philippine Retail Industry," which aids in identifying and referencing the specific market segment covered.
12. How do I determine which pricing option suits my needs best?
The pricing options vary based on user requirements and access needs. Individual users may opt for single-user licenses, while businesses requiring broader access may choose multi-user or enterprise licenses for cost-effective access to the report.
13. Are there any additional resources or data provided in the Philippine Retail Industry report?
While the report offers comprehensive insights, it's advisable to review the specific contents or supplementary materials provided to ascertain if additional resources or data are available.
14. How can I stay updated on further developments or reports in the Philippine Retail Industry?
To stay informed about further developments, trends, and reports in the Philippine Retail Industry, consider subscribing to industry newsletters, following relevant companies and organizations, or regularly checking reputable industry news sources and publications.
Methodology
Step 1 - Identification of Relevant Samples Size from Population Database


Step 2 - Approaches for Defining Global Market Size (Value, Volume* & Price*)

Note*: In applicable scenarios
Step 3 - Data Sources
Primary Research
- Web Analytics
- Survey Reports
- Research Institute
- Latest Research Reports
- Opinion Leaders
Secondary Research
- Annual Reports
- White Paper
- Latest Press Release
- Industry Association
- Paid Database
- Investor Presentations

Step 4 - Data Triangulation
Involves using different sources of information in order to increase the validity of a study
These sources are likely to be stakeholders in a program - participants, other researchers, program staff, other community members, and so on.
Then we put all data in single framework & apply various statistical tools to find out the dynamic on the market.
During the analysis stage, feedback from the stakeholder groups would be compared to determine areas of agreement as well as areas of divergence

