Pico Projector Industry in Emerging Markets: Analysis and Projections 2025-2033

Pico Projector Industry by Production Analysis, by Consumption Analysis, by Import Market Analysis (Value & Volume), by Export Market Analysis (Value & Volume), by Price Trend Analysis, by North America, by Europe, by Asia Pacific, by Rest of the World Forecast 2025-2033

Jun 25 2025
Base Year: 2024

234 Pages
Main Logo

Pico Projector Industry in Emerging Markets: Analysis and Projections 2025-2033


Home
Industries
Technology, Media and Telecom
sponsor image
sponsor image
sponsor image
sponsor image
sponsor image
sponsor image
sponsor image
sponsor image
sponsor image
sponsor image
sponsor image
sponsor image
sponsor image
sponsor image
sponsor image
sponsor image
sponsor image
sponsor image
sponsor image
sponsor image

Tailored for you

  • In-depth Analysis Tailored to Specified Regions or Segments
  • Company Profiles Customized to User Preferences
  • Comprehensive Insights Focused on Specific Segments or Regions
  • Customized Evaluation of Competitive Landscape to Meet Your Needs
  • Tailored Customization to Address Other Specific Requirements
Ask for customization


Key Insights

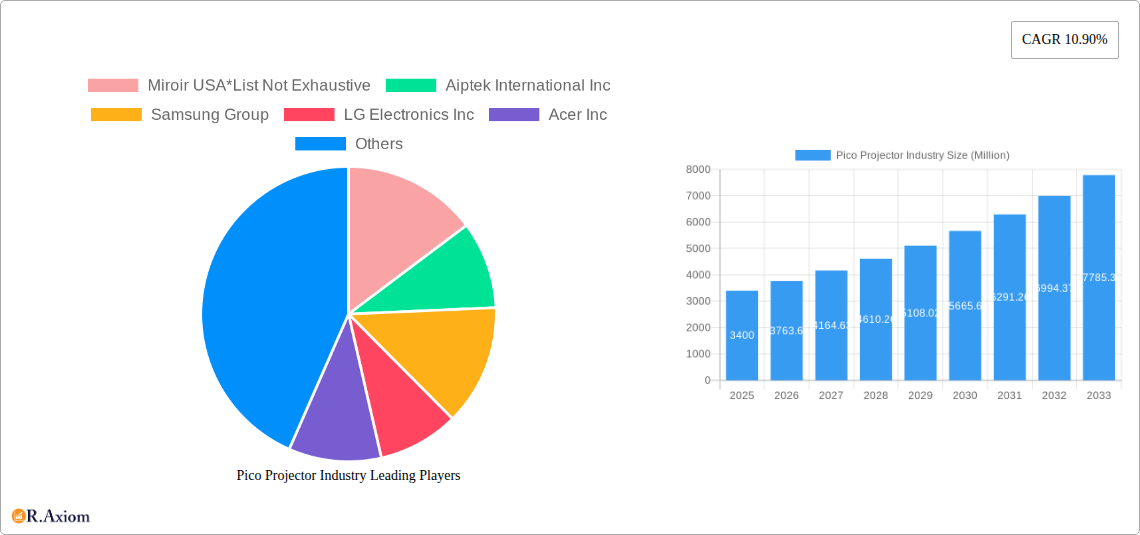
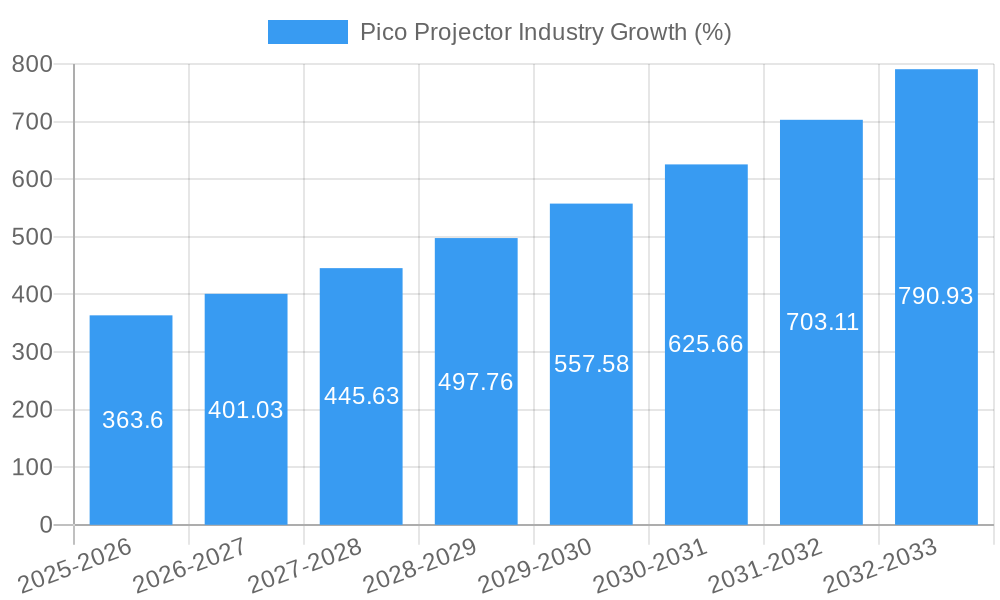
The pico projector market, valued at $3.40 billion in 2025, is projected to experience robust growth, driven by a compound annual growth rate (CAGR) of 10.90% from 2025 to 2033. This expansion is fueled by several key factors. The increasing demand for portable and versatile projection solutions across various applications, including business presentations, home entertainment, and education, is a significant driver. Technological advancements, such as improved brightness, resolution, and battery life in DLP and laser-based pico projectors, are further enhancing market appeal. The miniaturization of these devices and their seamless compatibility with smartphones, laptops, and other digital devices are also contributing to their widespread adoption. Growth is expected to be particularly strong in the Asia-Pacific region, driven by rising disposable incomes and increasing smartphone penetration. However, challenges remain, including the relatively high cost of advanced features like high resolution and laser projection, which could limit market penetration in price-sensitive segments. Competition among established players like Samsung, LG, and Sony, along with emerging players, will further shape market dynamics. The embedded pico projector segment is anticipated to witness significant growth due to its integration into various consumer electronics and automotive applications.

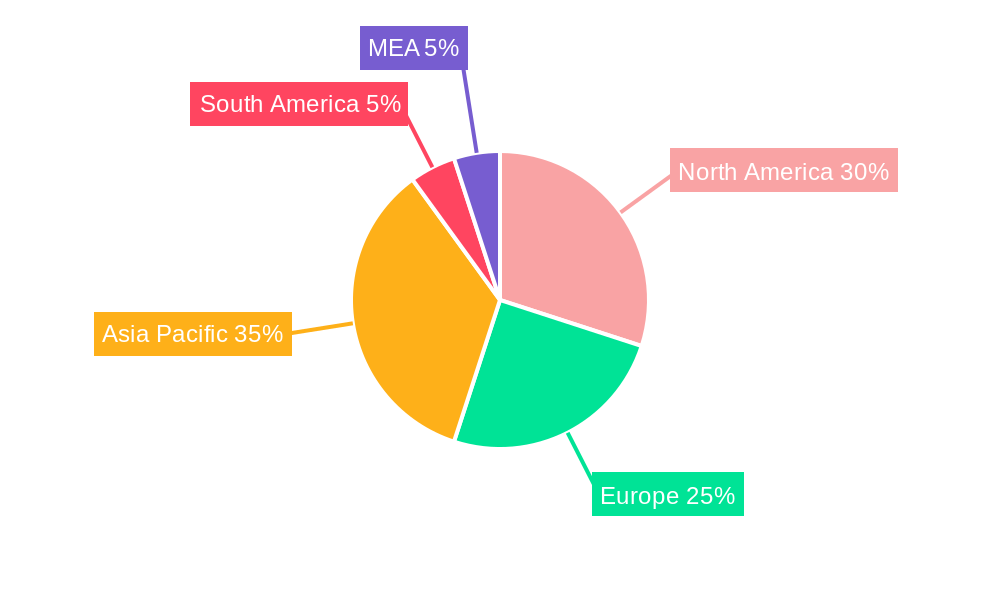
The market segmentation reveals several key trends. The DLP technology segment currently dominates, but laser beam steering and holographic projection technologies are poised for substantial growth due to their superior image quality and potential for advanced features. The smartphone compatibility segment is expected to be a major growth driver, owing to the increasing use of pico projectors for presentations and entertainment on the go. The standalone/non-embedded configuration currently holds a larger market share, but the embedded segment is projected to gain significant traction over the forecast period due to increasing integration into diverse product categories, such as smart glasses and vehicles. Regional analysis shows a strong presence of North America and Europe, but the Asia-Pacific region is anticipated to emerge as the fastest-growing market due to significant economic growth and increased technological adoption in countries like China and India. The market's future hinges on continuous innovation in projection technology, decreasing production costs, and expanding applications across various sectors.

Pico Projector Industry Research Report - Market Size, Growth & Forecast

Pico Projector Industry Market Report: 2019-2033

This comprehensive report provides a detailed analysis of the Pico Projector industry, offering invaluable insights for industry stakeholders, investors, and businesses seeking to navigate this dynamic market. The report covers the period 2019-2033, with a focus on the forecast period 2025-2033 and a base year of 2025. The report utilizes data from the historical period (2019-2024) and projects future trends based on rigorous market analysis. The total market size is predicted to reach xx Million by 2033.

Pico Projector Industry Market Concentration & Innovation

The pico projector market exhibits a moderately concentrated landscape, with key players like Samsung Group, LG Electronics Inc, and Sony Corporation holding significant market share. However, the presence of several smaller, specialized companies, such as AAXA Technologies Inc and Miroir USA, indicates a competitive environment with opportunities for niche players. Market share data for 2024 reveals that the top 5 players account for approximately xx% of the global market, indicating room for expansion and competition.

Innovation Drivers:

  • Miniaturization technologies: Advancements in chip technology and LED lighting continue to reduce the size and power consumption of pico projectors.
  • Enhanced image quality: Improvements in DLP and laser projection technologies are driving higher resolutions and brightness.
  • Smart features: Integration of Wi-Fi, Bluetooth, and streaming capabilities are enhancing user experience and expanding applications.

Regulatory Frameworks: International trade regulations and safety standards impact the manufacturing and distribution of pico projectors. Harmonization of global standards is a growing trend, but regional variations persist.

Product Substitutes: The primary substitutes are larger portable projectors and built-in display technologies in laptops and smartphones. The pico projector market competes on portability, affordability, and specialized features.

End-User Trends: The increasing demand for portable entertainment and business presentations fuels market growth. The rise of remote work and education further boosts the adoption of these compact projectors.

M&A Activities: The historical period (2019-2024) witnessed xx M&A deals in the pico projector industry, with a total value of approximately xx Million. These deals primarily focused on consolidating technology and expanding distribution networks.

Pico Projector Industry Industry Trends & Insights

The pico projector market is experiencing robust growth, driven by several factors. The Compound Annual Growth Rate (CAGR) from 2025 to 2033 is estimated at xx%. This growth is fueled by technological advancements leading to improved image quality, miniaturization, and enhanced features. Market penetration continues to rise in both consumer and commercial sectors. The increasing affordability of pico projectors, coupled with their enhanced portability and functionality, is driving consumer adoption.

Technological disruptions, such as the emergence of laser-based pico projectors with improved brightness and color accuracy, are reshaping the market landscape. Consumer preferences are shifting towards devices offering seamless connectivity, smart features, and superior image quality. The competitive dynamics are characterized by a mix of established players and emerging startups focusing on innovative features and niche applications. The market is witnessing a considerable shift towards the adoption of more energy-efficient and environmentally friendly pico projectors.

Pico Projector Industry Growth

Dominant Markets & Segments in Pico Projector Industry

Leading Regions/Countries: The North American and Asia-Pacific regions dominate the pico projector market, driven by robust consumer electronics demand and strong technological infrastructure. Within these regions, the United States and China are the leading national markets.

Dominant Segments:

  • By Technology: Digital Light Processing (DLP) technology currently holds the largest market share, due to its maturity, affordability, and widespread adoption. Laser beam steering and holographic laser projection technologies are emerging segments with significant growth potential, although currently representing a smaller market share. Other technologies, while offering specialized functionalities, hold minimal market shares.

  • By Compatibility: Smartphones, and portable media players are significant drivers of market demand. The increasing usage of smartphones for presentations and entertainment fuels this segment's growth. Laptop/desktop compatibility remains significant. Other segments, such as compatibility with Digital Cameras, have smaller market shares.

  • By Configuration: Standalone/Non-embedded pico projectors hold a more significant market share due to their versatility and ability to connect with multiple devices. However, embedded pico projectors are growing in importance due to increasing integration into various consumer electronics and automotive devices.

Key Drivers (by region):

  • North America: High disposable income, advanced technology adoption, and a robust entertainment sector.
  • Asia-Pacific: Rapid urbanization, increasing smartphone penetration, and rising demand for portable entertainment.
  • Europe: Steady growth driven by business applications and consumer demand for high-quality portable projectors.

Pico Projector Industry Product Developments

Recent product innovations focus on increased brightness, improved resolution, portability, and smart features. The integration of advanced image processing algorithms enhances picture clarity and color accuracy. These developments, such as the ViewSonic M1 Pro and the AAXA P7+, cater to various applications, from home entertainment to professional presentations, demonstrating a strong market fit for diverse customer needs. The growing trend of compact, yet feature-rich projectors positions the industry for continued growth.

Report Scope & Segmentation Analysis

By Technology: DLP technology dominates, with xx Million in 2025, expected to grow to xx Million by 2033. Laser projection is a fast-growing segment, predicted to reach xx Million by 2033. Other technologies remain niche.

By Compatibility: Smartphones and portable media players account for a significant market share, projected to expand substantially. Laptop/desktop compatibility continues to be a major segment.

By Configuration: Standalone projectors represent the larger segment, but embedded projectors exhibit significant growth potential.

Key Drivers of Pico Projector Industry Growth

Technological advancements, including miniaturization of components and improved image quality, are primary growth drivers. The rising demand for portable entertainment, business presentations, and educational tools fuels market expansion. Favorable economic conditions in key markets, coupled with supportive government policies in some regions promoting technological advancements, further contribute to industry growth.

Challenges in the Pico Projector Industry Sector

Supply chain disruptions and fluctuations in component prices pose significant challenges. Intense competition from established players and emerging startups necessitates continuous innovation and cost optimization. The need for regulatory compliance in different regions adds to the complexity of operating in this global market. For example, issues in the supply chain could lead to a xx% increase in production costs in 2026.

Emerging Opportunities in Pico Projector Industry

The integration of pico projectors into augmented reality (AR) and virtual reality (VR) devices represents a significant growth opportunity. Expansion into emerging markets with increasing disposable incomes offers substantial market potential. The development of higher-resolution, more energy-efficient, and eco-friendly pico projectors caters to growing consumer preference.

Leading Players in the Pico Projector Industry Market

  • Miroir USA
  • Aiptek International Inc
  • Samsung Group
  • LG Electronics Inc
  • Acer Inc
  • Aaxa Technologies Inc
  • Canon Inc
  • Koninklijke Philips NV
  • Coretronic Corporation
  • Sony Corporation

Key Developments in Pico Projector Industry Industry

  • April 2023: ViewSonic launched the M1 Pro smart LED portable projector with a flexible smart stand, enhancing portability and user experience.
  • January 2023: AAXA Technologies released the AAXA P7+ Mini Projector, featuring native 1080P resolution and improved brightness, showcasing advancements in miniaturization and performance.

Strategic Outlook for Pico Projector Industry Market

The pico projector market exhibits significant growth potential driven by ongoing technological advancements, increasing consumer demand, and expansion into new applications. The market's future growth is further supported by the continuous development of innovative features, improved image quality, and higher energy efficiency. The integration of advanced features like AI-powered image enhancement and improved connectivity will shape future market dynamics.

Pico Projector Industry Segmentation

  • 1. Production Analysis
  • 2. Consumption Analysis
  • 3. Import Market Analysis (Value & Volume)
  • 4. Export Market Analysis (Value & Volume)
  • 5. Price Trend Analysis

Pico Projector Industry Segmentation By Geography

  • 1. North America
  • 2. Europe
  • 3. Asia Pacific
  • 4. Rest of the World
Pico Projector Industry Regional Share


Pico Projector Industry REPORT HIGHLIGHTS

AspectsDetails
Study Period 2019-2033
Base Year 2024
Estimated Year 2025
Forecast Period2025-2033
Historical Period2019-2024
Growth RateCAGR of 10.90% from 2019-2033
Segmentation
    • By Production Analysis
    • By Consumption Analysis
    • By Import Market Analysis (Value & Volume)
    • By Export Market Analysis (Value & Volume)
    • By Price Trend Analysis
  • By Geography
    • North America
    • Europe
    • Asia Pacific
    • Rest of the World


Table of Contents

  1. 1. Introduction
    • 1.1. Research Scope
    • 1.2. Market Segmentation
    • 1.3. Research Methodology
    • 1.4. Definitions and Assumptions
  2. 2. Executive Summary
    • 2.1. Introduction
  3. 3. Market Dynamics
    • 3.1. Introduction
      • 3.2. Market Drivers
        • 3.2.1. Increasing Application in Consumer Electronics; Development of Pico Projectors with Superior Specification
      • 3.3. Market Restrains
        • 3.3.1. ; Easy Availability of Counterfeit Products
      • 3.4. Market Trends
        • 3.4.1. DLP Projectors Driving the Significant Market Growth
  4. 4. Market Factor Analysis
    • 4.1. Porters Five Forces
    • 4.2. Supply/Value Chain
    • 4.3. PESTEL analysis
    • 4.4. Market Entropy
    • 4.5. Patent/Trademark Analysis
  5. 5. Global Pico Projector Industry Analysis, Insights and Forecast, 2019-2031
    • 5.1. Market Analysis, Insights and Forecast - by Production Analysis
      • 5.2. Market Analysis, Insights and Forecast - by Consumption Analysis
        • 5.3. Market Analysis, Insights and Forecast - by Import Market Analysis (Value & Volume)
          • 5.4. Market Analysis, Insights and Forecast - by Export Market Analysis (Value & Volume)
            • 5.5. Market Analysis, Insights and Forecast - by Price Trend Analysis
              • 5.6. Market Analysis, Insights and Forecast - by Region
                • 5.6.1. North America
                • 5.6.2. Europe
                • 5.6.3. Asia Pacific
                • 5.6.4. Rest of the World
            • 6. North America Pico Projector Industry Analysis, Insights and Forecast, 2019-2031
              • 6.1. Market Analysis, Insights and Forecast - by Production Analysis
                • 6.2. Market Analysis, Insights and Forecast - by Consumption Analysis
                  • 6.3. Market Analysis, Insights and Forecast - by Import Market Analysis (Value & Volume)
                    • 6.4. Market Analysis, Insights and Forecast - by Export Market Analysis (Value & Volume)
                      • 6.5. Market Analysis, Insights and Forecast - by Price Trend Analysis
                      • 7. Europe Pico Projector Industry Analysis, Insights and Forecast, 2019-2031
                        • 7.1. Market Analysis, Insights and Forecast - by Production Analysis
                          • 7.2. Market Analysis, Insights and Forecast - by Consumption Analysis
                            • 7.3. Market Analysis, Insights and Forecast - by Import Market Analysis (Value & Volume)
                              • 7.4. Market Analysis, Insights and Forecast - by Export Market Analysis (Value & Volume)
                                • 7.5. Market Analysis, Insights and Forecast - by Price Trend Analysis
                                • 8. Asia Pacific Pico Projector Industry Analysis, Insights and Forecast, 2019-2031
                                  • 8.1. Market Analysis, Insights and Forecast - by Production Analysis
                                    • 8.2. Market Analysis, Insights and Forecast - by Consumption Analysis
                                      • 8.3. Market Analysis, Insights and Forecast - by Import Market Analysis (Value & Volume)
                                        • 8.4. Market Analysis, Insights and Forecast - by Export Market Analysis (Value & Volume)
                                          • 8.5. Market Analysis, Insights and Forecast - by Price Trend Analysis
                                          • 9. Rest of the World Pico Projector Industry Analysis, Insights and Forecast, 2019-2031
                                            • 9.1. Market Analysis, Insights and Forecast - by Production Analysis
                                              • 9.2. Market Analysis, Insights and Forecast - by Consumption Analysis
                                                • 9.3. Market Analysis, Insights and Forecast - by Import Market Analysis (Value & Volume)
                                                  • 9.4. Market Analysis, Insights and Forecast - by Export Market Analysis (Value & Volume)
                                                    • 9.5. Market Analysis, Insights and Forecast - by Price Trend Analysis
                                                    • 10. North America Pico Projector Industry Analysis, Insights and Forecast, 2019-2031
                                                        • 10.1. Market Analysis, Insights and Forecast - By Country/Sub-region
                                                          • 10.1.1 United States
                                                          • 10.1.2 Canada
                                                          • 10.1.3 Mexico
                                                    • 11. Europe Pico Projector Industry Analysis, Insights and Forecast, 2019-2031
                                                        • 11.1. Market Analysis, Insights and Forecast - By Country/Sub-region
                                                          • 11.1.1 Germany
                                                          • 11.1.2 United Kingdom
                                                          • 11.1.3 France
                                                          • 11.1.4 Spain
                                                          • 11.1.5 Italy
                                                          • 11.1.6 Spain
                                                          • 11.1.7 Belgium
                                                          • 11.1.8 Netherland
                                                          • 11.1.9 Nordics
                                                          • 11.1.10 Rest of Europe
                                                    • 12. Asia Pacific Pico Projector Industry Analysis, Insights and Forecast, 2019-2031
                                                        • 12.1. Market Analysis, Insights and Forecast - By Country/Sub-region
                                                          • 12.1.1 China
                                                          • 12.1.2 Japan
                                                          • 12.1.3 India
                                                          • 12.1.4 South Korea
                                                          • 12.1.5 Southeast Asia
                                                          • 12.1.6 Australia
                                                          • 12.1.7 Indonesia
                                                          • 12.1.8 Phillipes
                                                          • 12.1.9 Singapore
                                                          • 12.1.10 Thailandc
                                                          • 12.1.11 Rest of Asia Pacific
                                                    • 13. South America Pico Projector Industry Analysis, Insights and Forecast, 2019-2031
                                                        • 13.1. Market Analysis, Insights and Forecast - By Country/Sub-region
                                                          • 13.1.1 Brazil
                                                          • 13.1.2 Argentina
                                                          • 13.1.3 Peru
                                                          • 13.1.4 Chile
                                                          • 13.1.5 Colombia
                                                          • 13.1.6 Ecuador
                                                          • 13.1.7 Venezuela
                                                          • 13.1.8 Rest of South America
                                                    • 14. MEA Pico Projector Industry Analysis, Insights and Forecast, 2019-2031
                                                        • 14.1. Market Analysis, Insights and Forecast - By Country/Sub-region
                                                          • 14.1.1 United Arab Emirates
                                                          • 14.1.2 Saudi Arabia
                                                          • 14.1.3 South Africa
                                                          • 14.1.4 Rest of Middle East and Africa
                                                    • 15. Competitive Analysis
                                                      • 15.1. Global Market Share Analysis 2024
                                                        • 15.2. Company Profiles
                                                          • 15.2.1 Miroir USA*List Not Exhaustive
                                                            • 15.2.1.1. Overview
                                                            • 15.2.1.2. Products
                                                            • 15.2.1.3. SWOT Analysis
                                                            • 15.2.1.4. Recent Developments
                                                            • 15.2.1.5. Financials (Based on Availability)
                                                          • 15.2.2 Aiptek International Inc
                                                            • 15.2.2.1. Overview
                                                            • 15.2.2.2. Products
                                                            • 15.2.2.3. SWOT Analysis
                                                            • 15.2.2.4. Recent Developments
                                                            • 15.2.2.5. Financials (Based on Availability)
                                                          • 15.2.3 Samsung Group
                                                            • 15.2.3.1. Overview
                                                            • 15.2.3.2. Products
                                                            • 15.2.3.3. SWOT Analysis
                                                            • 15.2.3.4. Recent Developments
                                                            • 15.2.3.5. Financials (Based on Availability)
                                                          • 15.2.4 LG Electronics Inc
                                                            • 15.2.4.1. Overview
                                                            • 15.2.4.2. Products
                                                            • 15.2.4.3. SWOT Analysis
                                                            • 15.2.4.4. Recent Developments
                                                            • 15.2.4.5. Financials (Based on Availability)
                                                          • 15.2.5 Acer Inc
                                                            • 15.2.5.1. Overview
                                                            • 15.2.5.2. Products
                                                            • 15.2.5.3. SWOT Analysis
                                                            • 15.2.5.4. Recent Developments
                                                            • 15.2.5.5. Financials (Based on Availability)
                                                          • 15.2.6 Aaxa Technologies Inc
                                                            • 15.2.6.1. Overview
                                                            • 15.2.6.2. Products
                                                            • 15.2.6.3. SWOT Analysis
                                                            • 15.2.6.4. Recent Developments
                                                            • 15.2.6.5. Financials (Based on Availability)
                                                          • 15.2.7 Cannon Inc
                                                            • 15.2.7.1. Overview
                                                            • 15.2.7.2. Products
                                                            • 15.2.7.3. SWOT Analysis
                                                            • 15.2.7.4. Recent Developments
                                                            • 15.2.7.5. Financials (Based on Availability)
                                                          • 15.2.8 Koninklijke Philips NV
                                                            • 15.2.8.1. Overview
                                                            • 15.2.8.2. Products
                                                            • 15.2.8.3. SWOT Analysis
                                                            • 15.2.8.4. Recent Developments
                                                            • 15.2.8.5. Financials (Based on Availability)
                                                          • 15.2.9 Coretronic Corporation
                                                            • 15.2.9.1. Overview
                                                            • 15.2.9.2. Products
                                                            • 15.2.9.3. SWOT Analysis
                                                            • 15.2.9.4. Recent Developments
                                                            • 15.2.9.5. Financials (Based on Availability)
                                                          • 15.2.10 Sony Corporation
                                                            • 15.2.10.1. Overview
                                                            • 15.2.10.2. Products
                                                            • 15.2.10.3. SWOT Analysis
                                                            • 15.2.10.4. Recent Developments
                                                            • 15.2.10.5. Financials (Based on Availability)

                                                    List of Figures

                                                    1. Figure 1: Global Pico Projector Industry Revenue Breakdown (Million, %) by Region 2024 & 2032
                                                    2. Figure 2: North America Pico Projector Industry Revenue (Million), by Country 2024 & 2032
                                                    3. Figure 3: North America Pico Projector Industry Revenue Share (%), by Country 2024 & 2032
                                                    4. Figure 4: Europe Pico Projector Industry Revenue (Million), by Country 2024 & 2032
                                                    5. Figure 5: Europe Pico Projector Industry Revenue Share (%), by Country 2024 & 2032
                                                    6. Figure 6: Asia Pacific Pico Projector Industry Revenue (Million), by Country 2024 & 2032
                                                    7. Figure 7: Asia Pacific Pico Projector Industry Revenue Share (%), by Country 2024 & 2032
                                                    8. Figure 8: South America Pico Projector Industry Revenue (Million), by Country 2024 & 2032
                                                    9. Figure 9: South America Pico Projector Industry Revenue Share (%), by Country 2024 & 2032
                                                    10. Figure 10: MEA Pico Projector Industry Revenue (Million), by Country 2024 & 2032
                                                    11. Figure 11: MEA Pico Projector Industry Revenue Share (%), by Country 2024 & 2032
                                                    12. Figure 12: North America Pico Projector Industry Revenue (Million), by Production Analysis 2024 & 2032
                                                    13. Figure 13: North America Pico Projector Industry Revenue Share (%), by Production Analysis 2024 & 2032
                                                    14. Figure 14: North America Pico Projector Industry Revenue (Million), by Consumption Analysis 2024 & 2032
                                                    15. Figure 15: North America Pico Projector Industry Revenue Share (%), by Consumption Analysis 2024 & 2032
                                                    16. Figure 16: North America Pico Projector Industry Revenue (Million), by Import Market Analysis (Value & Volume) 2024 & 2032
                                                    17. Figure 17: North America Pico Projector Industry Revenue Share (%), by Import Market Analysis (Value & Volume) 2024 & 2032
                                                    18. Figure 18: North America Pico Projector Industry Revenue (Million), by Export Market Analysis (Value & Volume) 2024 & 2032
                                                    19. Figure 19: North America Pico Projector Industry Revenue Share (%), by Export Market Analysis (Value & Volume) 2024 & 2032
                                                    20. Figure 20: North America Pico Projector Industry Revenue (Million), by Price Trend Analysis 2024 & 2032
                                                    21. Figure 21: North America Pico Projector Industry Revenue Share (%), by Price Trend Analysis 2024 & 2032
                                                    22. Figure 22: North America Pico Projector Industry Revenue (Million), by Country 2024 & 2032
                                                    23. Figure 23: North America Pico Projector Industry Revenue Share (%), by Country 2024 & 2032
                                                    24. Figure 24: Europe Pico Projector Industry Revenue (Million), by Production Analysis 2024 & 2032
                                                    25. Figure 25: Europe Pico Projector Industry Revenue Share (%), by Production Analysis 2024 & 2032
                                                    26. Figure 26: Europe Pico Projector Industry Revenue (Million), by Consumption Analysis 2024 & 2032
                                                    27. Figure 27: Europe Pico Projector Industry Revenue Share (%), by Consumption Analysis 2024 & 2032
                                                    28. Figure 28: Europe Pico Projector Industry Revenue (Million), by Import Market Analysis (Value & Volume) 2024 & 2032
                                                    29. Figure 29: Europe Pico Projector Industry Revenue Share (%), by Import Market Analysis (Value & Volume) 2024 & 2032
                                                    30. Figure 30: Europe Pico Projector Industry Revenue (Million), by Export Market Analysis (Value & Volume) 2024 & 2032
                                                    31. Figure 31: Europe Pico Projector Industry Revenue Share (%), by Export Market Analysis (Value & Volume) 2024 & 2032
                                                    32. Figure 32: Europe Pico Projector Industry Revenue (Million), by Price Trend Analysis 2024 & 2032
                                                    33. Figure 33: Europe Pico Projector Industry Revenue Share (%), by Price Trend Analysis 2024 & 2032
                                                    34. Figure 34: Europe Pico Projector Industry Revenue (Million), by Country 2024 & 2032
                                                    35. Figure 35: Europe Pico Projector Industry Revenue Share (%), by Country 2024 & 2032
                                                    36. Figure 36: Asia Pacific Pico Projector Industry Revenue (Million), by Production Analysis 2024 & 2032
                                                    37. Figure 37: Asia Pacific Pico Projector Industry Revenue Share (%), by Production Analysis 2024 & 2032
                                                    38. Figure 38: Asia Pacific Pico Projector Industry Revenue (Million), by Consumption Analysis 2024 & 2032
                                                    39. Figure 39: Asia Pacific Pico Projector Industry Revenue Share (%), by Consumption Analysis 2024 & 2032
                                                    40. Figure 40: Asia Pacific Pico Projector Industry Revenue (Million), by Import Market Analysis (Value & Volume) 2024 & 2032
                                                    41. Figure 41: Asia Pacific Pico Projector Industry Revenue Share (%), by Import Market Analysis (Value & Volume) 2024 & 2032
                                                    42. Figure 42: Asia Pacific Pico Projector Industry Revenue (Million), by Export Market Analysis (Value & Volume) 2024 & 2032
                                                    43. Figure 43: Asia Pacific Pico Projector Industry Revenue Share (%), by Export Market Analysis (Value & Volume) 2024 & 2032
                                                    44. Figure 44: Asia Pacific Pico Projector Industry Revenue (Million), by Price Trend Analysis 2024 & 2032
                                                    45. Figure 45: Asia Pacific Pico Projector Industry Revenue Share (%), by Price Trend Analysis 2024 & 2032
                                                    46. Figure 46: Asia Pacific Pico Projector Industry Revenue (Million), by Country 2024 & 2032
                                                    47. Figure 47: Asia Pacific Pico Projector Industry Revenue Share (%), by Country 2024 & 2032
                                                    48. Figure 48: Rest of the World Pico Projector Industry Revenue (Million), by Production Analysis 2024 & 2032
                                                    49. Figure 49: Rest of the World Pico Projector Industry Revenue Share (%), by Production Analysis 2024 & 2032
                                                    50. Figure 50: Rest of the World Pico Projector Industry Revenue (Million), by Consumption Analysis 2024 & 2032
                                                    51. Figure 51: Rest of the World Pico Projector Industry Revenue Share (%), by Consumption Analysis 2024 & 2032
                                                    52. Figure 52: Rest of the World Pico Projector Industry Revenue (Million), by Import Market Analysis (Value & Volume) 2024 & 2032
                                                    53. Figure 53: Rest of the World Pico Projector Industry Revenue Share (%), by Import Market Analysis (Value & Volume) 2024 & 2032
                                                    54. Figure 54: Rest of the World Pico Projector Industry Revenue (Million), by Export Market Analysis (Value & Volume) 2024 & 2032
                                                    55. Figure 55: Rest of the World Pico Projector Industry Revenue Share (%), by Export Market Analysis (Value & Volume) 2024 & 2032
                                                    56. Figure 56: Rest of the World Pico Projector Industry Revenue (Million), by Price Trend Analysis 2024 & 2032
                                                    57. Figure 57: Rest of the World Pico Projector Industry Revenue Share (%), by Price Trend Analysis 2024 & 2032
                                                    58. Figure 58: Rest of the World Pico Projector Industry Revenue (Million), by Country 2024 & 2032
                                                    59. Figure 59: Rest of the World Pico Projector Industry Revenue Share (%), by Country 2024 & 2032

                                                    List of Tables

                                                    1. Table 1: Global Pico Projector Industry Revenue Million Forecast, by Region 2019 & 2032
                                                    2. Table 2: Global Pico Projector Industry Revenue Million Forecast, by Production Analysis 2019 & 2032
                                                    3. Table 3: Global Pico Projector Industry Revenue Million Forecast, by Consumption Analysis 2019 & 2032
                                                    4. Table 4: Global Pico Projector Industry Revenue Million Forecast, by Import Market Analysis (Value & Volume) 2019 & 2032
                                                    5. Table 5: Global Pico Projector Industry Revenue Million Forecast, by Export Market Analysis (Value & Volume) 2019 & 2032
                                                    6. Table 6: Global Pico Projector Industry Revenue Million Forecast, by Price Trend Analysis 2019 & 2032
                                                    7. Table 7: Global Pico Projector Industry Revenue Million Forecast, by Region 2019 & 2032
                                                    8. Table 8: Global Pico Projector Industry Revenue Million Forecast, by Country 2019 & 2032
                                                    9. Table 9: United States Pico Projector Industry Revenue (Million) Forecast, by Application 2019 & 2032
                                                    10. Table 10: Canada Pico Projector Industry Revenue (Million) Forecast, by Application 2019 & 2032
                                                    11. Table 11: Mexico Pico Projector Industry Revenue (Million) Forecast, by Application 2019 & 2032
                                                    12. Table 12: Global Pico Projector Industry Revenue Million Forecast, by Country 2019 & 2032
                                                    13. Table 13: Germany Pico Projector Industry Revenue (Million) Forecast, by Application 2019 & 2032
                                                    14. Table 14: United Kingdom Pico Projector Industry Revenue (Million) Forecast, by Application 2019 & 2032
                                                    15. Table 15: France Pico Projector Industry Revenue (Million) Forecast, by Application 2019 & 2032
                                                    16. Table 16: Spain Pico Projector Industry Revenue (Million) Forecast, by Application 2019 & 2032
                                                    17. Table 17: Italy Pico Projector Industry Revenue (Million) Forecast, by Application 2019 & 2032
                                                    18. Table 18: Spain Pico Projector Industry Revenue (Million) Forecast, by Application 2019 & 2032
                                                    19. Table 19: Belgium Pico Projector Industry Revenue (Million) Forecast, by Application 2019 & 2032
                                                    20. Table 20: Netherland Pico Projector Industry Revenue (Million) Forecast, by Application 2019 & 2032
                                                    21. Table 21: Nordics Pico Projector Industry Revenue (Million) Forecast, by Application 2019 & 2032
                                                    22. Table 22: Rest of Europe Pico Projector Industry Revenue (Million) Forecast, by Application 2019 & 2032
                                                    23. Table 23: Global Pico Projector Industry Revenue Million Forecast, by Country 2019 & 2032
                                                    24. Table 24: China Pico Projector Industry Revenue (Million) Forecast, by Application 2019 & 2032
                                                    25. Table 25: Japan Pico Projector Industry Revenue (Million) Forecast, by Application 2019 & 2032
                                                    26. Table 26: India Pico Projector Industry Revenue (Million) Forecast, by Application 2019 & 2032
                                                    27. Table 27: South Korea Pico Projector Industry Revenue (Million) Forecast, by Application 2019 & 2032
                                                    28. Table 28: Southeast Asia Pico Projector Industry Revenue (Million) Forecast, by Application 2019 & 2032
                                                    29. Table 29: Australia Pico Projector Industry Revenue (Million) Forecast, by Application 2019 & 2032
                                                    30. Table 30: Indonesia Pico Projector Industry Revenue (Million) Forecast, by Application 2019 & 2032
                                                    31. Table 31: Phillipes Pico Projector Industry Revenue (Million) Forecast, by Application 2019 & 2032
                                                    32. Table 32: Singapore Pico Projector Industry Revenue (Million) Forecast, by Application 2019 & 2032
                                                    33. Table 33: Thailandc Pico Projector Industry Revenue (Million) Forecast, by Application 2019 & 2032
                                                    34. Table 34: Rest of Asia Pacific Pico Projector Industry Revenue (Million) Forecast, by Application 2019 & 2032
                                                    35. Table 35: Global Pico Projector Industry Revenue Million Forecast, by Country 2019 & 2032
                                                    36. Table 36: Brazil Pico Projector Industry Revenue (Million) Forecast, by Application 2019 & 2032
                                                    37. Table 37: Argentina Pico Projector Industry Revenue (Million) Forecast, by Application 2019 & 2032
                                                    38. Table 38: Peru Pico Projector Industry Revenue (Million) Forecast, by Application 2019 & 2032
                                                    39. Table 39: Chile Pico Projector Industry Revenue (Million) Forecast, by Application 2019 & 2032
                                                    40. Table 40: Colombia Pico Projector Industry Revenue (Million) Forecast, by Application 2019 & 2032
                                                    41. Table 41: Ecuador Pico Projector Industry Revenue (Million) Forecast, by Application 2019 & 2032
                                                    42. Table 42: Venezuela Pico Projector Industry Revenue (Million) Forecast, by Application 2019 & 2032
                                                    43. Table 43: Rest of South America Pico Projector Industry Revenue (Million) Forecast, by Application 2019 & 2032
                                                    44. Table 44: Global Pico Projector Industry Revenue Million Forecast, by Country 2019 & 2032
                                                    45. Table 45: United Arab Emirates Pico Projector Industry Revenue (Million) Forecast, by Application 2019 & 2032
                                                    46. Table 46: Saudi Arabia Pico Projector Industry Revenue (Million) Forecast, by Application 2019 & 2032
                                                    47. Table 47: South Africa Pico Projector Industry Revenue (Million) Forecast, by Application 2019 & 2032
                                                    48. Table 48: Rest of Middle East and Africa Pico Projector Industry Revenue (Million) Forecast, by Application 2019 & 2032
                                                    49. Table 49: Global Pico Projector Industry Revenue Million Forecast, by Production Analysis 2019 & 2032
                                                    50. Table 50: Global Pico Projector Industry Revenue Million Forecast, by Consumption Analysis 2019 & 2032
                                                    51. Table 51: Global Pico Projector Industry Revenue Million Forecast, by Import Market Analysis (Value & Volume) 2019 & 2032
                                                    52. Table 52: Global Pico Projector Industry Revenue Million Forecast, by Export Market Analysis (Value & Volume) 2019 & 2032
                                                    53. Table 53: Global Pico Projector Industry Revenue Million Forecast, by Price Trend Analysis 2019 & 2032
                                                    54. Table 54: Global Pico Projector Industry Revenue Million Forecast, by Country 2019 & 2032
                                                    55. Table 55: Global Pico Projector Industry Revenue Million Forecast, by Production Analysis 2019 & 2032
                                                    56. Table 56: Global Pico Projector Industry Revenue Million Forecast, by Consumption Analysis 2019 & 2032
                                                    57. Table 57: Global Pico Projector Industry Revenue Million Forecast, by Import Market Analysis (Value & Volume) 2019 & 2032
                                                    58. Table 58: Global Pico Projector Industry Revenue Million Forecast, by Export Market Analysis (Value & Volume) 2019 & 2032
                                                    59. Table 59: Global Pico Projector Industry Revenue Million Forecast, by Price Trend Analysis 2019 & 2032
                                                    60. Table 60: Global Pico Projector Industry Revenue Million Forecast, by Country 2019 & 2032
                                                    61. Table 61: Global Pico Projector Industry Revenue Million Forecast, by Production Analysis 2019 & 2032
                                                    62. Table 62: Global Pico Projector Industry Revenue Million Forecast, by Consumption Analysis 2019 & 2032
                                                    63. Table 63: Global Pico Projector Industry Revenue Million Forecast, by Import Market Analysis (Value & Volume) 2019 & 2032
                                                    64. Table 64: Global Pico Projector Industry Revenue Million Forecast, by Export Market Analysis (Value & Volume) 2019 & 2032
                                                    65. Table 65: Global Pico Projector Industry Revenue Million Forecast, by Price Trend Analysis 2019 & 2032
                                                    66. Table 66: Global Pico Projector Industry Revenue Million Forecast, by Country 2019 & 2032
                                                    67. Table 67: Global Pico Projector Industry Revenue Million Forecast, by Production Analysis 2019 & 2032
                                                    68. Table 68: Global Pico Projector Industry Revenue Million Forecast, by Consumption Analysis 2019 & 2032
                                                    69. Table 69: Global Pico Projector Industry Revenue Million Forecast, by Import Market Analysis (Value & Volume) 2019 & 2032
                                                    70. Table 70: Global Pico Projector Industry Revenue Million Forecast, by Export Market Analysis (Value & Volume) 2019 & 2032
                                                    71. Table 71: Global Pico Projector Industry Revenue Million Forecast, by Price Trend Analysis 2019 & 2032
                                                    72. Table 72: Global Pico Projector Industry Revenue Million Forecast, by Country 2019 & 2032


                                                    Frequently Asked Questions

                                                    1. What is the projected Compound Annual Growth Rate (CAGR) of the Pico Projector Industry?

                                                    The projected CAGR is approximately 10.90%.

                                                    2. Which companies are prominent players in the Pico Projector Industry?

                                                    Key companies in the market include Miroir USA*List Not Exhaustive, Aiptek International Inc, Samsung Group, LG Electronics Inc, Acer Inc, Aaxa Technologies Inc, Cannon Inc, Koninklijke Philips NV, Coretronic Corporation, Sony Corporation.

                                                    3. What are the main segments of the Pico Projector Industry?

                                                    The market segments include Production Analysis, Consumption Analysis, Import Market Analysis (Value & Volume), Export Market Analysis (Value & Volume), Price Trend Analysis.

                                                    4. Can you provide details about the market size?

                                                    The market size is estimated to be USD 3.40 Million as of 2022.

                                                    5. What are some drivers contributing to market growth?

                                                    Increasing Application in Consumer Electronics; Development of Pico Projectors with Superior Specification.

                                                    6. What are the notable trends driving market growth?

                                                    DLP Projectors Driving the Significant Market Growth.

                                                    7. Are there any restraints impacting market growth?

                                                    ; Easy Availability of Counterfeit Products.

                                                    8. Can you provide examples of recent developments in the market?

                                                    April 2023: ViewSonic launched an M1 Pro smart LED portable projector with a flexible smart stand. ViewSonic, a global leader in visual solutions, has introduced the M1 Pro Smart LED PortableProjector - a groundbreaking addition to their M Series. This lightweight, ultra-portable projector is designed to transform any space into a cinematic experience with stunning 720 HD visuals and a powerful Harman Kardon speaker.

                                                    9. What pricing options are available for accessing the report?

                                                    Pricing options include single-user, multi-user, and enterprise licenses priced at USD 4750, USD 5250, and USD 8750 respectively.

                                                    10. Is the market size provided in terms of value or volume?

                                                    The market size is provided in terms of value, measured in Million.

                                                    11. Are there any specific market keywords associated with the report?

                                                    Yes, the market keyword associated with the report is "Pico Projector Industry," which aids in identifying and referencing the specific market segment covered.

                                                    12. How do I determine which pricing option suits my needs best?

                                                    The pricing options vary based on user requirements and access needs. Individual users may opt for single-user licenses, while businesses requiring broader access may choose multi-user or enterprise licenses for cost-effective access to the report.

                                                    13. Are there any additional resources or data provided in the Pico Projector Industry report?

                                                    While the report offers comprehensive insights, it's advisable to review the specific contents or supplementary materials provided to ascertain if additional resources or data are available.

                                                    14. How can I stay updated on further developments or reports in the Pico Projector Industry?

                                                    To stay informed about further developments, trends, and reports in the Pico Projector Industry, consider subscribing to industry newsletters, following relevant companies and organizations, or regularly checking reputable industry news sources and publications.


                                                    Methodology

                                                    Step 1 - Identification of Relevant Samples Size from Population Database

                                                    Step Chart
                                                    Bar Chart
                                                    Method Chart

                                                    Step 2 - Approaches for Defining Global Market Size (Value, Volume* & Price*)

                                                    Approach Chart
                                                    Top-down and bottom-up approaches are used to validate the global market size and estimate the market size for manufactures, regional segments, product, and application.

                                                    Note*: In applicable scenarios

                                                    Step 3 - Data Sources

                                                    Primary Research

                                                    • Web Analytics
                                                    • Survey Reports
                                                    • Research Institute
                                                    • Latest Research Reports
                                                    • Opinion Leaders

                                                    Secondary Research

                                                    • Annual Reports
                                                    • White Paper
                                                    • Latest Press Release
                                                    • Industry Association
                                                    • Paid Database
                                                    • Investor Presentations
                                                    Analyst Chart

                                                    Step 4 - Data Triangulation

                                                    Involves using different sources of information in order to increase the validity of a study

                                                    These sources are likely to be stakeholders in a program - participants, other researchers, program staff, other community members, and so on.

                                                    Then we put all data in single framework & apply various statistical tools to find out the dynamic on the market.

                                                    During the analysis stage, feedback from the stakeholder groups would be compared to determine areas of agreement as well as areas of divergence

                                                    Additionally, after gathering mixed and scattered data from a wide range of sources, data is triangulated and correlated to come up with estimated figures which are further validated through primary mediums or industry experts, opinion leaders.

                                                    About Research Axiom

                                                    Research Axiom delivers in-depth market research, industry analysis, and consulting for pharmaceuticals, automotive, IT, and consumer goods. Our reports provide the clarity you need to make informed decisions and drive innovation.

                                                    Our team combines primary research, advanced analytics, and sector expertise to deliver actionable intelligence. We offer syndicated reports, custom research, and consulting services tailored to your business needs.

                                                    At Research Axiom, we are committed to quality, transparency, and client satisfaction. Every report is rigorously validated to ensure accuracy and relevance. Our global perspective and local expertise help you understand both the big picture and the finer details of your market.

                                                    Stay informed with Research Axiom. Subscribe to our newsletter for the latest updates and research highlights, and follow us on social media for real-time insights. Research Axiom – Turning Data into Business Advantage.

                                                    artwork spiralartwork spiralRelated Reports
                                                    artwork underline

                                                    Decoding Middle East and Africa Soft Facility Management Market Consumer Preferences 2025-2033

                                                    Discover the booming Middle East & Africa Soft Facility Management market! Explore its $XX million valuation, 7.70% CAGR growth, key drivers, trends, and leading companies like EFS Facilities Services Group and Farnek Services LLC. This comprehensive analysis covers key segments and regional breakdowns for 2025-2033.

                                                    July 2025
                                                    Base Year: 2024
                                                    No Of Pages: 210
                                                    Price: $4750

                                                    Strategizing Growth: Industrial AI Software Market Market’s Decade Ahead 2025-2033

                                                    The Industrial AI Software market is booming, projected to reach $114.68 million in 2025 with a 35.97% CAGR. Discover key trends, drivers, and regional insights for this rapidly expanding sector, including leading companies like Nvidia, IBM, and Microsoft. Explore market segmentation by end-user industry and deployment type.

                                                    July 2025
                                                    Base Year: 2024
                                                    No Of Pages: 234
                                                    Price: $4750

                                                    Market Deep Dive: Exploring Simulation Software Industry Trends 2025-2033

                                                    The simulation software market is booming, projected to reach $30 billion by 2033 with a 12.06% CAGR. This in-depth analysis explores key drivers, trends, and regional market shares, highlighting leading companies and the transformative impact of cloud-based solutions and AI on product design and development. Discover market insights and growth projections for automotive, aerospace, and other key sectors.

                                                    July 2025
                                                    Base Year: 2024
                                                    No Of Pages: 234
                                                    Price: $4750

                                                    Consumer Technical Support Services Market Market Strategies: Trends and Outlook 2025-2033

                                                    The global Consumer Technical Support Services market is booming, projected to reach [estimated market size in 2033] by 2033 with a CAGR of 7.30%. Learn about key drivers, trends, restraints, and major players shaping this rapidly growing sector. Explore regional market shares and future growth potential.

                                                    July 2025
                                                    Base Year: 2024
                                                    No Of Pages: 234
                                                    Price: $4750

                                                    Emerging Trends in North America Speech Analytics Market: A Technology Perspective 2025-2033

                                                    The North America Speech Analytics Market is booming, projected to reach [estimated 2033 value] million by 2033, with a CAGR of 13.20%. Discover key drivers, trends, and challenges impacting this rapidly growing sector, along with leading vendors and market segmentation analysis.

                                                    July 2025
                                                    Base Year: 2024
                                                    No Of Pages: 210
                                                    Price: $4750

                                                    Comprehensive Review of Rugged Display Industry Growth Potential

                                                    The rugged display market is booming, projected to reach \$14.85B by 2033 with a 4.43% CAGR. This in-depth analysis explores market drivers, trends, restraints, and key players in industries like oil & gas, defense, and automotive. Discover insights into regional market share and key product segments.

                                                    July 2025
                                                    Base Year: 2024
                                                    No Of Pages: 234
                                                    Price: $4750

                                                    Commercial Lighting Market Future-Proofing Growth: Strategic Insights and Analysis 2025-2033

                                                    The commercial lighting market is booming, projected to reach \$69.21 billion by 2033 with a CAGR of 20.93%! Driven by LED adoption and smart lighting solutions, this in-depth analysis explores market size, key trends, leading companies (Signify, Cree, Acuity Brands), and regional growth across North America, Europe, and Asia Pacific. Discover the future of commercial lighting.

                                                    July 2025
                                                    Base Year: 2024
                                                    No Of Pages: 234
                                                    Price: $4750

                                                    Asia-Pacific Package Testing Industry Comprehensive Market Study: Trends and Predictions 2025-2033

                                                    The Asia-Pacific package testing market is booming, projected to reach $8.17 billion by 2033 with a CAGR of 6.20%. Driven by e-commerce, sustainability concerns, and stringent regulations, this report analyzes market trends, key players (ALS, Intertek, SGS), and segmentations (materials, testing types, industries) across key APAC regions.

                                                    July 2025
                                                    Base Year: 2024
                                                    No Of Pages: 234
                                                    Price: $4750

                                                    Future Trends Shaping Carbon Management System Market Growth

                                                    The Carbon Management System (CMS) market is booming, projected to reach $14.37B by 2025 with a 12.09% CAGR. Discover key drivers, trends, and leading companies shaping this crucial sector for environmental sustainability. Learn more about software, services, and regional market analysis.

                                                    July 2025
                                                    Base Year: 2024
                                                    No Of Pages: 234
                                                    Price: $4750

                                                    Latin America IT Device Market XX CAGR Growth to Drive Market Size to XXX Million by 2033

                                                    Discover the latest insights on the booming Latin American IT device market. Explore growth trends, key players (Samsung, Apple, Xiaomi), regional variations (Brazil, Mexico), and future projections for tablets, phones, and PCs from 2025-2033. Learn how economic factors and technological advancements shape this dynamic market.

                                                    July 2025
                                                    Base Year: 2024
                                                    No Of Pages: 234
                                                    Price: $4750

                                                    Air Quality Monitoring Software Market Market’s Growth Blueprint

                                                    The Air Quality Monitoring Software market is booming, projected to reach $XX million by 2033 with a 6.30% CAGR. Driven by environmental concerns and smart city initiatives, this report analyzes market trends, key players (Horiba, Thermo Fisher, Honeywell), and regional growth (North America, Europe, Asia-Pacific). Discover key insights and future projections for this rapidly expanding sector.

                                                    July 2025
                                                    Base Year: 2024
                                                    No Of Pages: 234
                                                    Price: $4750

                                                    Belgium Data Center Storage Market 2025-2033 Overview: Trends, Dynamics, and Growth Opportunities

                                                    Discover the booming Belgium Data Center Storage Market! Explore 2025-2033 market size, CAGR of 2.29%, key drivers, trends, and top companies like Dell, HPE, and more. Get insights into storage technologies (NAS, SAN, DAS, All-Flash), end-user segments, and regional analysis. Download the report now!

                                                    July 2025
                                                    Base Year: 2024
                                                    No Of Pages: 197
                                                    Price: $3800

                                                    Global Finland OOH And DOOH Market Trends: Region-Specific Insights 2025-2033

                                                    Discover the booming Finland OOH & DOOH advertising market! Explore its €102.24 million (2025) valuation, 19.17% CAGR, key players, and future trends shaping this dynamic sector. Learn about growth drivers, regional insights, and market forecasts until 2033.

                                                    July 2025
                                                    Base Year: 2024
                                                    No Of Pages: 197
                                                    Price: $3800

                                                    Smartphone Industry Charting Growth Trajectories: Analysis and Forecasts 2025-2033

                                                    The global smartphone market is booming, projected to reach \$2.07 trillion by 2033 with a 4.10% CAGR. This in-depth analysis explores market size, key players (Apple, Samsung, Xiaomi), regional trends (Asia, North America), and future growth drivers like 5G and foldable phones. Discover the latest insights on Android vs. iOS and unlock the secrets to success in this dynamic industry.

                                                    July 2025
                                                    Base Year: 2024
                                                    No Of Pages: 197
                                                    Price: $3800

                                                    Exploring Utility Locator Industry’s Market Size Dynamics 2025-2033

                                                    Discover the booming Utility Locator market projected to reach $X Billion by 2033, growing at a CAGR of 6.56%. This comprehensive analysis explores market drivers, trends, restraints, segmentation (by target, technique, application, offering), key players, and regional insights. Learn about the latest technologies like EMF and GPR shaping this crucial infrastructure sector.

                                                    July 2025
                                                    Base Year: 2024
                                                    No Of Pages: 234
                                                    Price: $4750

                                                    Heads Up Display Industry Market Strategies for the Next Decade: 2025-2033

                                                    The Heads-Up Display (HUD) market is booming, projected to reach [estimated market size in 2033] million by 2033, with a CAGR of 21.20%. Discover key trends, driving factors, major players (like Collins Aerospace, Denso, Visteon), and regional market shares in this comprehensive market analysis. Learn about windshield-based, combiner-based, and AR-HUD technologies.

                                                    July 2025
                                                    Base Year: 2024
                                                    No Of Pages: 234
                                                    Price: $4750

                                                    Exploring Opportunities in Poland Data Center Storage Market Sector

                                                    Poland's Data Center Storage Market is booming, projected to reach €1.38 billion by 2033, with a CAGR of 11.70%. Driven by cloud adoption, big data, and digital transformation, this market offers lucrative opportunities for vendors. Explore key trends, segments, and leading companies shaping this dynamic landscape.

                                                    July 2025
                                                    Base Year: 2024
                                                    No Of Pages: 197
                                                    Price: $3800

                                                    Demand Patterns in Italy Data Center Storage Market Market: Projections to 2033

                                                    Discover the booming Italy Data Center Storage market forecast to 2033! This comprehensive analysis reveals a €460 million market in 2025, growing at a 10.63% CAGR, driven by cloud adoption, digital transformation, and big data. Explore market segments, key players (Dell, NetApp, HPE), and growth drivers in this in-depth report.

                                                    July 2025
                                                    Base Year: 2024
                                                    No Of Pages: 197
                                                    Price: $3800

                                                    Singapore Ecommerce Industry Insightful Analysis: Trends, Competitor Dynamics, and Opportunities 2025-2033

                                                    Discover the booming Singapore e-commerce market! This in-depth analysis reveals a CAGR of 11%, key players like Shopee & Lazada, and future growth projections to 2033. Learn about market drivers, trends, and challenges in this dynamic sector.

                                                    July 2025
                                                    Base Year: 2024
                                                    No Of Pages: 197
                                                    Price: $3800

                                                    Pneumatic Tools Market Market Predictions and Opportunities 2025-2033

                                                    The global pneumatic tools market is booming, projected to reach \$[estimated 2033 value] billion by 2033, with a CAGR of 7%. Discover key drivers, trends, and restraints shaping this dynamic industry, including regional analysis and leading companies like Ingersoll Rand and Festo. Explore market segmentation by equipment type and end-user industries.

                                                    July 2025
                                                    Base Year: 2024
                                                    No Of Pages: 234
                                                    Price: $4750

                                                    Business Address

                                                    Head Office

                                                    Office no. A 5010, fifth floor, Solitaire Business Hub, Near Phoenix mall, Pune, Maharashtra 411014

                                                    Contact Information

                                                    Craig Francis

                                                    Business Development Head

                                                    +17162654855

                                                    [email protected]

                                                    Connect With Us

                                                    Secure Payment Partners

                                                    payment image
                                                    RetailLogisticsPackagingAutomotiveHealthcareAgricultureEnergy & PowerFood & BeverageAerospace & DefenseChemicals & MaterialsHospitality and TourismAnimal Nutrition & WellnessConsumer Goods and ServicesReal Estate and ConstructionHome and Property ImprovementTechnology, Media and TelecomManufacturing Products and ServicesFinancial Services and Investment Intelligence

                                                    © 2025 All rights reserved


                                                    Privacy Policy
                                                    Terms and Conditions
                                                    FAQ
                                                    • Home
                                                    • About Us
                                                    • Industries
                                                      • Aerospace & Defense
                                                      • Agriculture
                                                      • Animal Nutrition & Wellness
                                                      • Automotive
                                                      • Chemicals & Materials
                                                      • Consumer Goods and Services
                                                      • Energy & Power
                                                      • Financial Services and Investment Intelligence
                                                      • Food & Beverage
                                                      • Home and Property Improvement
                                                      • Hospitality and Tourism
                                                      • Logistics
                                                      • Manufacturing Products and Services
                                                      • Packaging
                                                      • Professional and Commercial Services
                                                      • Real Estate and Construction
                                                      • Retail
                                                      • Technology, Media and Telecom
                                                      • Healthcare
                                                    • Services
                                                    • Contact
                                                    Main Logo
                                                    • Home
                                                    • About Us
                                                    • Industries
                                                      • Aerospace & Defense
                                                      • Agriculture
                                                      • Animal Nutrition & Wellness
                                                      • Automotive
                                                      • Chemicals & Materials
                                                      • Consumer Goods and Services
                                                      • Energy & Power
                                                      • Financial Services and Investment Intelligence
                                                      • Food & Beverage
                                                      • Home and Property Improvement
                                                      • Hospitality and Tourism
                                                      • Logistics
                                                      • Manufacturing Products and Services
                                                      • Packaging
                                                      • Professional and Commercial Services
                                                      • Real Estate and Construction
                                                      • Retail
                                                      • Technology, Media and Telecom
                                                      • Healthcare
                                                    • Services
                                                    • Contact
                                                    +17162654855
                                                    [email protected]

                                                    +17162654855

                                                    [email protected]