
Key Insights
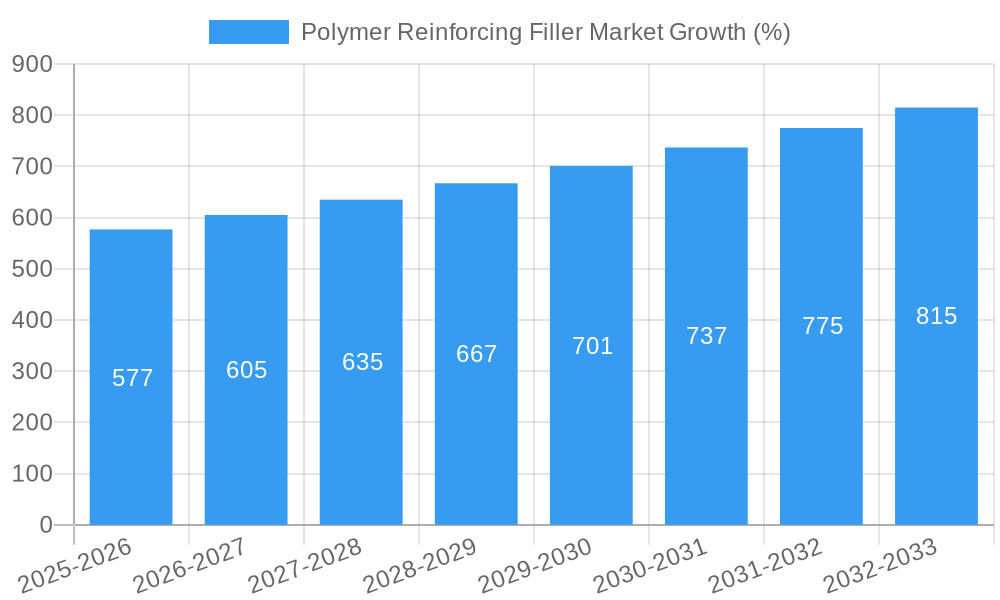
The global Polymer Reinforcing Filler market, valued at $12.45 billion in 2025, is projected to experience robust growth, driven by a compound annual growth rate (CAGR) of 4.6% from 2025 to 2033. This expansion is fueled by several key factors. The burgeoning construction industry, particularly in developing economies, necessitates high-performance materials, increasing demand for polymer reinforcing fillers in applications like concrete and asphalt. Simultaneously, the automotive sector's pursuit of lighter, stronger, and more fuel-efficient vehicles is bolstering the adoption of these fillers in composite materials. Furthermore, the growing packaging industry, seeking sustainable and cost-effective solutions, is contributing to market growth. Organic fillers, such as cellulose and wood flour, are gaining traction due to their renewable nature and relatively low cost, while inorganic fillers, like silica and calcium carbonate, continue to dominate due to their superior performance characteristics. The market is segmented by filler type (organic and inorganic), and end-user industry (building and construction, automotive, consumer goods, packaging, and others). Geographical growth is anticipated across all regions, with Asia Pacific expected to lead due to rapid industrialization and infrastructure development. However, factors like fluctuating raw material prices and environmental concerns related to certain filler types could potentially restrain market growth.
The competitive landscape is characterized by a mix of large multinational corporations and specialized regional players. Key players like SGL Carbon, Imerys Group, and Omya AG are leveraging their established distribution networks and technological advancements to maintain market share. The market is witnessing increasing innovation in filler technology, with a focus on developing eco-friendly and high-performance materials. This includes exploring bio-based fillers and improving the dispersion and functionalization of existing fillers to enhance their properties. Furthermore, strategic partnerships and mergers & acquisitions are likely to shape the market dynamics in the coming years, driving further consolidation and innovation. The forecast period (2025-2033) presents significant opportunities for market participants to capitalize on these trends and technological advancements.

Polymer Reinforcing Filler Market: A Comprehensive Report (2019-2033)
This comprehensive report provides an in-depth analysis of the global Polymer Reinforcing Filler market, offering invaluable insights for stakeholders seeking to navigate this dynamic industry. The report covers the period from 2019 to 2033, with 2025 serving as the base and estimated year. The market is projected to reach a value of xx Billion by 2033, exhibiting a robust CAGR of xx% during the forecast period (2025-2033). This detailed analysis incorporates market segmentation by type (Organic Fillers and Inorganic Fillers), end-user industry (Building and Construction, Automotive, Consumer Goods, Packaging, and Others), and geographic regions.
Polymer Reinforcing Filler Market Market Concentration & Innovation
The Polymer Reinforcing Filler market displays a moderately concentrated landscape, with several key players holding significant market share. The top five players, including SGL Carbon, Imerys Group, Omya AG, Minerals Technologies Inc, and Quarzwerke Group, collectively account for approximately xx% of the global market share in 2025. Market concentration is influenced by factors such as economies of scale, technological expertise, and established distribution networks.
Innovation is a crucial driver within this market. Continuous advancements in material science are leading to the development of high-performance fillers with enhanced properties like improved strength, durability, and lightweighting capabilities. Regulatory frameworks, particularly those focusing on sustainability and environmental impact, are also shaping innovation trends, pushing manufacturers towards the development of eco-friendly and recyclable fillers.
Product substitution poses a significant challenge, with alternative materials like carbon fiber and bio-based fillers competing for market share. End-user trends, particularly the growing demand for lightweight and high-performance materials in automotive and construction, are creating new opportunities for innovation. Mergers and acquisitions (M&A) are frequent, with recent deals valued at approximately xx Billion, primarily focused on expanding product portfolios and geographic reach. For instance, the acquisition of [Company A] by [Company B] in [Year] significantly impacted the market share distribution.
Polymer Reinforcing Filler Market Industry Trends & Insights
The Polymer Reinforcing Filler market is experiencing substantial growth driven by several key factors. The increasing demand for lightweight yet durable materials across diverse industries, particularly in the automotive and construction sectors, is a primary growth catalyst. Technological advancements leading to the development of high-performance fillers with improved mechanical properties are further boosting market expansion. Consumer preference for sustainable and eco-friendly products is driving the adoption of bio-based fillers, creating a significant market segment. The market penetration rate for organic fillers is projected to reach xx% by 2033, surpassing inorganic fillers in certain applications. However, competitive dynamics are intensifying, with established players facing pressure from new entrants offering innovative and cost-effective solutions. The ongoing price fluctuations of raw materials also pose a challenge to consistent profitability. The market is estimated to grow at a CAGR of xx% during the forecast period.
Dominant Markets & Segments in Polymer Reinforcing Filler Market
The building and construction sector represents the largest end-user segment for polymer reinforcing fillers, accounting for xx% of the global market in 2025. This dominance is primarily attributable to the increasing construction activities globally, particularly in developing economies. Key drivers for this segment include robust infrastructure development projects and the growing adoption of high-performance concrete and composite materials.
- Key Drivers for Building and Construction:
- Expanding infrastructure development projects.
- Increasing demand for high-performance concrete.
- Growing adoption of composite materials in construction.
- Government initiatives promoting sustainable building practices.
The automotive industry is another significant segment, driven by the need for lightweight and fuel-efficient vehicles. Inorganic fillers dominate this sector due to their superior performance characteristics in high-stress applications. The Asia-Pacific region is the leading geographical market, accounting for xx% of the global demand in 2025, fueled by rapid industrialization and urbanization.
Polymer Reinforcing Filler Market Product Developments
Recent advancements in polymer reinforcing filler technology focus on enhancing material properties such as strength, stiffness, and thermal resistance. Nanotechnology is playing a crucial role in developing fillers with improved dispersion and interfacial bonding, leading to enhanced composite performance. New applications are emerging in areas such as 3D printing and electronics, further expanding the market scope. These advancements deliver significant competitive advantages, enabling manufacturers to offer superior products with enhanced functionality and cost-effectiveness.
Report Scope & Segmentation Analysis
This report comprehensively segments the Polymer Reinforcing Filler market based on type and end-user industry.
Type:
- Organic Fillers: This segment is expected to witness substantial growth, driven by the increasing demand for sustainable and bio-based materials. The market size for organic fillers is projected to reach xx Billion by 2033.
- Inorganic Fillers: This segment holds a larger market share currently, but its growth rate is anticipated to be lower than that of organic fillers due to environmental concerns associated with some inorganic filler types. The market size for inorganic fillers is projected to reach xx Billion by 2033.
End-user Industry:
- The detailed analysis for each end-user industry (Building and Construction, Automotive, Consumer Goods, Packaging, Others) is provided in the previous section. Each segment's growth projection, market size, and competitive dynamics are thoroughly examined within the full report.
Key Drivers of Polymer Reinforcing Filler Market Growth
Several factors are driving the growth of the Polymer Reinforcing Filler market. The rising demand for lightweight and high-strength materials in various industries is a primary driver. Government regulations promoting sustainable and eco-friendly materials are also encouraging the adoption of polymer reinforcing fillers. Technological advancements, such as the development of nano-sized fillers, further enhance market expansion. Economic growth in developing countries fuels construction activity, creating significant demand for these materials.
Challenges in the Polymer Reinforcing Filler Market Sector
The Polymer Reinforcing Filler market faces several challenges, including fluctuating raw material prices, impacting production costs and profitability. Stringent environmental regulations necessitate the development of sustainable and eco-friendly fillers, increasing R&D expenditure. Intense competition among manufacturers puts pressure on pricing and necessitates continuous innovation. Supply chain disruptions can lead to production delays and impact market availability.
Emerging Opportunities in Polymer Reinforcing Filler Market
Emerging opportunities exist in the development of specialized fillers for niche applications, such as advanced composites and 3D printing. The growing demand for sustainable and bio-based fillers presents a significant opportunity for manufacturers. Expansion into new geographical markets, particularly in developing economies with robust infrastructure development, holds substantial growth potential.
Leading Players in the Polymer Reinforcing Filler Market Market
- SGL Carbon
- Hoffmann Mineral
- Quarzwerke Group
- Otsuka Chemical Co Ltd
- Amco Polymers
- Imerys Group
- Deep Polymer
- Orkila
- RTP Company
- Zeus Industrial Products Inc
- Polymer Products (Phil) Inc
- Omya AG
- LKAB Minerals
- Minerals Technologies Inc
- GLC Minerals
Key Developments in Polymer Reinforcing Filler Market Industry
- January 2023: Imerys Group launched a new line of sustainable polymer reinforcing fillers.
- March 2022: Minerals Technologies Inc. announced a strategic partnership to expand its distribution network in Asia.
- June 2021: SGL Carbon acquired a smaller competitor, strengthening its market position.
- [Add further developments with year/month and impact on market dynamics.]
Strategic Outlook for Polymer Reinforcing Filler Market Market
The Polymer Reinforcing Filler market exhibits strong growth potential, driven by technological advancements, sustainable material demand, and expanding infrastructure projects globally. The focus on lightweighting and enhanced material properties will continue to drive innovation, while the rising adoption of bio-based fillers presents a significant opportunity for market expansion. Companies that successfully adapt to evolving consumer preferences and regulatory frameworks will thrive in this dynamic market.
Polymer Reinforcing Filler Market Segmentation
-
1. Type
-
1.1. Organic Fillers
- 1.1.1. Carbon Fibers
- 1.1.2. Cellulose Fibers
- 1.1.3. Wood Fibers
- 1.1.4. Others
-
1.2. Inorganic Fillers
- 1.2.1. Glass Fibers
- 1.2.2. Calcium Carbonate,
- 1.2.3. Precipitated Silica
-
1.1. Organic Fillers
-
2. End-user Industry
- 2.1. Building and Construction
- 2.2. Automotive
- 2.3. Consumer Goods
- 2.4. Packaging
- 2.5. Others
Polymer Reinforcing Filler Market Segmentation By Geography
-
1. Asia Pacific
- 1.1. China
- 1.2. India
- 1.3. Japan
- 1.4. South Korea
- 1.5. Rest of Asia Pacific
-
2. North America
- 2.1. United States
- 2.2. Canada
- 2.3. Mexico
-
3. Europe
- 3.1. Germany
- 3.2. United Kingdom
- 3.3. France
- 3.4. Italy
- 3.5. Rest of Europe
-
4. South America
- 4.1. Brazil
- 4.2. Argentina
- 4.3. Rest of South America
-
5. Middle East and Africa
- 5.1. Saudi Arabia
- 5.2. South Africa
- 5.3. Rest of Middle East and Africa

Polymer Reinforcing Filler Market REPORT HIGHLIGHTS
| Aspects | Details |
|---|---|
| Study Period | 2019-2033 |
| Base Year | 2024 |
| Estimated Year | 2025 |
| Forecast Period | 2025-2033 |
| Historical Period | 2019-2024 |
| Growth Rate | CAGR of 4.6% from 2019-2033 |
| Segmentation |
|
Table of Contents
- 1. Introduction
- 1.1. Research Scope
- 1.2. Market Segmentation
- 1.3. Research Methodology
- 1.4. Definitions and Assumptions
- 2. Executive Summary
- 2.1. Introduction
- 3. Market Dynamics
- 3.1. Introduction
- 3.2. Market Drivers
- 3.2.1. ; Growing Demand from Building and Construction Industry; Other Drivers
- 3.3. Market Restrains
- 3.3.1. ; Unfavorable Conditions Arising Due to COVID-19 Outbreak; Other Restraints
- 3.4. Market Trends
- 3.4.1. Building and Construction Segment to Dominate the Market
- 4. Market Factor Analysis
- 4.1. Porters Five Forces
- 4.2. Supply/Value Chain
- 4.3. PESTEL analysis
- 4.4. Market Entropy
- 4.5. Patent/Trademark Analysis
- 5. Global Polymer Reinforcing Filler Market Analysis, Insights and Forecast, 2019-2031
- 5.1. Market Analysis, Insights and Forecast - by Type
- 5.1.1. Organic Fillers
- 5.1.1.1. Carbon Fibers
- 5.1.1.2. Cellulose Fibers
- 5.1.1.3. Wood Fibers
- 5.1.1.4. Others
- 5.1.2. Inorganic Fillers
- 5.1.2.1. Glass Fibers
- 5.1.2.2. Calcium Carbonate,
- 5.1.2.3. Precipitated Silica
- 5.1.1. Organic Fillers
- 5.2. Market Analysis, Insights and Forecast - by End-user Industry
- 5.2.1. Building and Construction
- 5.2.2. Automotive
- 5.2.3. Consumer Goods
- 5.2.4. Packaging
- 5.2.5. Others
- 5.3. Market Analysis, Insights and Forecast - by Region
- 5.3.1. Asia Pacific
- 5.3.2. North America
- 5.3.3. Europe
- 5.3.4. South America
- 5.3.5. Middle East and Africa
- 5.1. Market Analysis, Insights and Forecast - by Type
- 6. Asia Pacific Polymer Reinforcing Filler Market Analysis, Insights and Forecast, 2019-2031
- 6.1. Market Analysis, Insights and Forecast - by Type
- 6.1.1. Organic Fillers
- 6.1.1.1. Carbon Fibers
- 6.1.1.2. Cellulose Fibers
- 6.1.1.3. Wood Fibers
- 6.1.1.4. Others
- 6.1.2. Inorganic Fillers
- 6.1.2.1. Glass Fibers
- 6.1.2.2. Calcium Carbonate,
- 6.1.2.3. Precipitated Silica
- 6.1.1. Organic Fillers
- 6.2. Market Analysis, Insights and Forecast - by End-user Industry
- 6.2.1. Building and Construction
- 6.2.2. Automotive
- 6.2.3. Consumer Goods
- 6.2.4. Packaging
- 6.2.5. Others
- 6.1. Market Analysis, Insights and Forecast - by Type
- 7. North America Polymer Reinforcing Filler Market Analysis, Insights and Forecast, 2019-2031
- 7.1. Market Analysis, Insights and Forecast - by Type
- 7.1.1. Organic Fillers
- 7.1.1.1. Carbon Fibers
- 7.1.1.2. Cellulose Fibers
- 7.1.1.3. Wood Fibers
- 7.1.1.4. Others
- 7.1.2. Inorganic Fillers
- 7.1.2.1. Glass Fibers
- 7.1.2.2. Calcium Carbonate,
- 7.1.2.3. Precipitated Silica
- 7.1.1. Organic Fillers
- 7.2. Market Analysis, Insights and Forecast - by End-user Industry
- 7.2.1. Building and Construction
- 7.2.2. Automotive
- 7.2.3. Consumer Goods
- 7.2.4. Packaging
- 7.2.5. Others
- 7.1. Market Analysis, Insights and Forecast - by Type
- 8. Europe Polymer Reinforcing Filler Market Analysis, Insights and Forecast, 2019-2031
- 8.1. Market Analysis, Insights and Forecast - by Type
- 8.1.1. Organic Fillers
- 8.1.1.1. Carbon Fibers
- 8.1.1.2. Cellulose Fibers
- 8.1.1.3. Wood Fibers
- 8.1.1.4. Others
- 8.1.2. Inorganic Fillers
- 8.1.2.1. Glass Fibers
- 8.1.2.2. Calcium Carbonate,
- 8.1.2.3. Precipitated Silica
- 8.1.1. Organic Fillers
- 8.2. Market Analysis, Insights and Forecast - by End-user Industry
- 8.2.1. Building and Construction
- 8.2.2. Automotive
- 8.2.3. Consumer Goods
- 8.2.4. Packaging
- 8.2.5. Others
- 8.1. Market Analysis, Insights and Forecast - by Type
- 9. South America Polymer Reinforcing Filler Market Analysis, Insights and Forecast, 2019-2031
- 9.1. Market Analysis, Insights and Forecast - by Type
- 9.1.1. Organic Fillers
- 9.1.1.1. Carbon Fibers
- 9.1.1.2. Cellulose Fibers
- 9.1.1.3. Wood Fibers
- 9.1.1.4. Others
- 9.1.2. Inorganic Fillers
- 9.1.2.1. Glass Fibers
- 9.1.2.2. Calcium Carbonate,
- 9.1.2.3. Precipitated Silica
- 9.1.1. Organic Fillers
- 9.2. Market Analysis, Insights and Forecast - by End-user Industry
- 9.2.1. Building and Construction
- 9.2.2. Automotive
- 9.2.3. Consumer Goods
- 9.2.4. Packaging
- 9.2.5. Others
- 9.1. Market Analysis, Insights and Forecast - by Type
- 10. Middle East and Africa Polymer Reinforcing Filler Market Analysis, Insights and Forecast, 2019-2031
- 10.1. Market Analysis, Insights and Forecast - by Type
- 10.1.1. Organic Fillers
- 10.1.1.1. Carbon Fibers
- 10.1.1.2. Cellulose Fibers
- 10.1.1.3. Wood Fibers
- 10.1.1.4. Others
- 10.1.2. Inorganic Fillers
- 10.1.2.1. Glass Fibers
- 10.1.2.2. Calcium Carbonate,
- 10.1.2.3. Precipitated Silica
- 10.1.1. Organic Fillers
- 10.2. Market Analysis, Insights and Forecast - by End-user Industry
- 10.2.1. Building and Construction
- 10.2.2. Automotive
- 10.2.3. Consumer Goods
- 10.2.4. Packaging
- 10.2.5. Others
- 10.1. Market Analysis, Insights and Forecast - by Type
- 11. North America Polymer Reinforcing Filler Market Analysis, Insights and Forecast, 2019-2031
- 11.1. Market Analysis, Insights and Forecast - By Country/Sub-region
- 11.1.1 United States
- 11.1.2 Canada
- 11.1.3 Mexico
- 12. Europe Polymer Reinforcing Filler Market Analysis, Insights and Forecast, 2019-2031
- 12.1. Market Analysis, Insights and Forecast - By Country/Sub-region
- 12.1.1 Germany
- 12.1.2 France
- 12.1.3 Italy
- 12.1.4 United Kingdom
- 12.1.5 Netherlands
- 12.1.6 Rest of Europe
- 13. Asia Pacific Polymer Reinforcing Filler Market Analysis, Insights and Forecast, 2019-2031
- 13.1. Market Analysis, Insights and Forecast - By Country/Sub-region
- 13.1.1 China
- 13.1.2 Japan
- 13.1.3 India
- 13.1.4 South Korea
- 13.1.5 Taiwan
- 13.1.6 Australia
- 13.1.7 Rest of Asia-Pacific
- 14. South America Polymer Reinforcing Filler Market Analysis, Insights and Forecast, 2019-2031
- 14.1. Market Analysis, Insights and Forecast - By Country/Sub-region
- 14.1.1 Brazil
- 14.1.2 Argentina
- 14.1.3 Rest of South America
- 15. MEA Polymer Reinforcing Filler Market Analysis, Insights and Forecast, 2019-2031
- 15.1. Market Analysis, Insights and Forecast - By Country/Sub-region
- 15.1.1 Middle East
- 15.1.2 Africa
- 16. Competitive Analysis
- 16.1. Global Market Share Analysis 2024
- 16.2. Company Profiles
- 16.2.1 SGL Carbon
- 16.2.1.1. Overview
- 16.2.1.2. Products
- 16.2.1.3. SWOT Analysis
- 16.2.1.4. Recent Developments
- 16.2.1.5. Financials (Based on Availability)
- 16.2.2 Hoffmann Mineral
- 16.2.2.1. Overview
- 16.2.2.2. Products
- 16.2.2.3. SWOT Analysis
- 16.2.2.4. Recent Developments
- 16.2.2.5. Financials (Based on Availability)
- 16.2.3 Quarzwerke Group
- 16.2.3.1. Overview
- 16.2.3.2. Products
- 16.2.3.3. SWOT Analysis
- 16.2.3.4. Recent Developments
- 16.2.3.5. Financials (Based on Availability)
- 16.2.4 Otsuka Chemical Co Ltd
- 16.2.4.1. Overview
- 16.2.4.2. Products
- 16.2.4.3. SWOT Analysis
- 16.2.4.4. Recent Developments
- 16.2.4.5. Financials (Based on Availability)
- 16.2.5 Amco Polymers
- 16.2.5.1. Overview
- 16.2.5.2. Products
- 16.2.5.3. SWOT Analysis
- 16.2.5.4. Recent Developments
- 16.2.5.5. Financials (Based on Availability)
- 16.2.6 Imerys Group
- 16.2.6.1. Overview
- 16.2.6.2. Products
- 16.2.6.3. SWOT Analysis
- 16.2.6.4. Recent Developments
- 16.2.6.5. Financials (Based on Availability)
- 16.2.7 Deep Polymer
- 16.2.7.1. Overview
- 16.2.7.2. Products
- 16.2.7.3. SWOT Analysis
- 16.2.7.4. Recent Developments
- 16.2.7.5. Financials (Based on Availability)
- 16.2.8 Orkila
- 16.2.8.1. Overview
- 16.2.8.2. Products
- 16.2.8.3. SWOT Analysis
- 16.2.8.4. Recent Developments
- 16.2.8.5. Financials (Based on Availability)
- 16.2.9 RTP Company
- 16.2.9.1. Overview
- 16.2.9.2. Products
- 16.2.9.3. SWOT Analysis
- 16.2.9.4. Recent Developments
- 16.2.9.5. Financials (Based on Availability)
- 16.2.10 Zeus Industrial Products Inc
- 16.2.10.1. Overview
- 16.2.10.2. Products
- 16.2.10.3. SWOT Analysis
- 16.2.10.4. Recent Developments
- 16.2.10.5. Financials (Based on Availability)
- 16.2.11 Polymer Products (Phil) Inc
- 16.2.11.1. Overview
- 16.2.11.2. Products
- 16.2.11.3. SWOT Analysis
- 16.2.11.4. Recent Developments
- 16.2.11.5. Financials (Based on Availability)
- 16.2.12 Omya AG
- 16.2.12.1. Overview
- 16.2.12.2. Products
- 16.2.12.3. SWOT Analysis
- 16.2.12.4. Recent Developments
- 16.2.12.5. Financials (Based on Availability)
- 16.2.13 LKAB Minerals
- 16.2.13.1. Overview
- 16.2.13.2. Products
- 16.2.13.3. SWOT Analysis
- 16.2.13.4. Recent Developments
- 16.2.13.5. Financials (Based on Availability)
- 16.2.14 Minerals Technologies Inc
- 16.2.14.1. Overview
- 16.2.14.2. Products
- 16.2.14.3. SWOT Analysis
- 16.2.14.4. Recent Developments
- 16.2.14.5. Financials (Based on Availability)
- 16.2.15 GLC Minerals
- 16.2.15.1. Overview
- 16.2.15.2. Products
- 16.2.15.3. SWOT Analysis
- 16.2.15.4. Recent Developments
- 16.2.15.5. Financials (Based on Availability)
- 16.2.1 SGL Carbon
List of Figures
- Figure 1: Global Polymer Reinforcing Filler Market Revenue Breakdown (Billion, %) by Region 2024 & 2032
- Figure 2: Global Polymer Reinforcing Filler Market Volume Breakdown (K Tons, %) by Region 2024 & 2032
- Figure 3: North America Polymer Reinforcing Filler Market Revenue (Billion), by Country 2024 & 2032
- Figure 4: North America Polymer Reinforcing Filler Market Volume (K Tons), by Country 2024 & 2032
- Figure 5: North America Polymer Reinforcing Filler Market Revenue Share (%), by Country 2024 & 2032
- Figure 6: North America Polymer Reinforcing Filler Market Volume Share (%), by Country 2024 & 2032
- Figure 7: Europe Polymer Reinforcing Filler Market Revenue (Billion), by Country 2024 & 2032
- Figure 8: Europe Polymer Reinforcing Filler Market Volume (K Tons), by Country 2024 & 2032
- Figure 9: Europe Polymer Reinforcing Filler Market Revenue Share (%), by Country 2024 & 2032
- Figure 10: Europe Polymer Reinforcing Filler Market Volume Share (%), by Country 2024 & 2032
- Figure 11: Asia Pacific Polymer Reinforcing Filler Market Revenue (Billion), by Country 2024 & 2032
- Figure 12: Asia Pacific Polymer Reinforcing Filler Market Volume (K Tons), by Country 2024 & 2032
- Figure 13: Asia Pacific Polymer Reinforcing Filler Market Revenue Share (%), by Country 2024 & 2032
- Figure 14: Asia Pacific Polymer Reinforcing Filler Market Volume Share (%), by Country 2024 & 2032
- Figure 15: South America Polymer Reinforcing Filler Market Revenue (Billion), by Country 2024 & 2032
- Figure 16: South America Polymer Reinforcing Filler Market Volume (K Tons), by Country 2024 & 2032
- Figure 17: South America Polymer Reinforcing Filler Market Revenue Share (%), by Country 2024 & 2032
- Figure 18: South America Polymer Reinforcing Filler Market Volume Share (%), by Country 2024 & 2032
- Figure 19: MEA Polymer Reinforcing Filler Market Revenue (Billion), by Country 2024 & 2032
- Figure 20: MEA Polymer Reinforcing Filler Market Volume (K Tons), by Country 2024 & 2032
- Figure 21: MEA Polymer Reinforcing Filler Market Revenue Share (%), by Country 2024 & 2032
- Figure 22: MEA Polymer Reinforcing Filler Market Volume Share (%), by Country 2024 & 2032
- Figure 23: Asia Pacific Polymer Reinforcing Filler Market Revenue (Billion), by Type 2024 & 2032
- Figure 24: Asia Pacific Polymer Reinforcing Filler Market Volume (K Tons), by Type 2024 & 2032
- Figure 25: Asia Pacific Polymer Reinforcing Filler Market Revenue Share (%), by Type 2024 & 2032
- Figure 26: Asia Pacific Polymer Reinforcing Filler Market Volume Share (%), by Type 2024 & 2032
- Figure 27: Asia Pacific Polymer Reinforcing Filler Market Revenue (Billion), by End-user Industry 2024 & 2032
- Figure 28: Asia Pacific Polymer Reinforcing Filler Market Volume (K Tons), by End-user Industry 2024 & 2032
- Figure 29: Asia Pacific Polymer Reinforcing Filler Market Revenue Share (%), by End-user Industry 2024 & 2032
- Figure 30: Asia Pacific Polymer Reinforcing Filler Market Volume Share (%), by End-user Industry 2024 & 2032
- Figure 31: Asia Pacific Polymer Reinforcing Filler Market Revenue (Billion), by Country 2024 & 2032
- Figure 32: Asia Pacific Polymer Reinforcing Filler Market Volume (K Tons), by Country 2024 & 2032
- Figure 33: Asia Pacific Polymer Reinforcing Filler Market Revenue Share (%), by Country 2024 & 2032
- Figure 34: Asia Pacific Polymer Reinforcing Filler Market Volume Share (%), by Country 2024 & 2032
- Figure 35: North America Polymer Reinforcing Filler Market Revenue (Billion), by Type 2024 & 2032
- Figure 36: North America Polymer Reinforcing Filler Market Volume (K Tons), by Type 2024 & 2032
- Figure 37: North America Polymer Reinforcing Filler Market Revenue Share (%), by Type 2024 & 2032
- Figure 38: North America Polymer Reinforcing Filler Market Volume Share (%), by Type 2024 & 2032
- Figure 39: North America Polymer Reinforcing Filler Market Revenue (Billion), by End-user Industry 2024 & 2032
- Figure 40: North America Polymer Reinforcing Filler Market Volume (K Tons), by End-user Industry 2024 & 2032
- Figure 41: North America Polymer Reinforcing Filler Market Revenue Share (%), by End-user Industry 2024 & 2032
- Figure 42: North America Polymer Reinforcing Filler Market Volume Share (%), by End-user Industry 2024 & 2032
- Figure 43: North America Polymer Reinforcing Filler Market Revenue (Billion), by Country 2024 & 2032
- Figure 44: North America Polymer Reinforcing Filler Market Volume (K Tons), by Country 2024 & 2032
- Figure 45: North America Polymer Reinforcing Filler Market Revenue Share (%), by Country 2024 & 2032
- Figure 46: North America Polymer Reinforcing Filler Market Volume Share (%), by Country 2024 & 2032
- Figure 47: Europe Polymer Reinforcing Filler Market Revenue (Billion), by Type 2024 & 2032
- Figure 48: Europe Polymer Reinforcing Filler Market Volume (K Tons), by Type 2024 & 2032
- Figure 49: Europe Polymer Reinforcing Filler Market Revenue Share (%), by Type 2024 & 2032
- Figure 50: Europe Polymer Reinforcing Filler Market Volume Share (%), by Type 2024 & 2032
- Figure 51: Europe Polymer Reinforcing Filler Market Revenue (Billion), by End-user Industry 2024 & 2032
- Figure 52: Europe Polymer Reinforcing Filler Market Volume (K Tons), by End-user Industry 2024 & 2032
- Figure 53: Europe Polymer Reinforcing Filler Market Revenue Share (%), by End-user Industry 2024 & 2032
- Figure 54: Europe Polymer Reinforcing Filler Market Volume Share (%), by End-user Industry 2024 & 2032
- Figure 55: Europe Polymer Reinforcing Filler Market Revenue (Billion), by Country 2024 & 2032
- Figure 56: Europe Polymer Reinforcing Filler Market Volume (K Tons), by Country 2024 & 2032
- Figure 57: Europe Polymer Reinforcing Filler Market Revenue Share (%), by Country 2024 & 2032
- Figure 58: Europe Polymer Reinforcing Filler Market Volume Share (%), by Country 2024 & 2032
- Figure 59: South America Polymer Reinforcing Filler Market Revenue (Billion), by Type 2024 & 2032
- Figure 60: South America Polymer Reinforcing Filler Market Volume (K Tons), by Type 2024 & 2032
- Figure 61: South America Polymer Reinforcing Filler Market Revenue Share (%), by Type 2024 & 2032
- Figure 62: South America Polymer Reinforcing Filler Market Volume Share (%), by Type 2024 & 2032
- Figure 63: South America Polymer Reinforcing Filler Market Revenue (Billion), by End-user Industry 2024 & 2032
- Figure 64: South America Polymer Reinforcing Filler Market Volume (K Tons), by End-user Industry 2024 & 2032
- Figure 65: South America Polymer Reinforcing Filler Market Revenue Share (%), by End-user Industry 2024 & 2032
- Figure 66: South America Polymer Reinforcing Filler Market Volume Share (%), by End-user Industry 2024 & 2032
- Figure 67: South America Polymer Reinforcing Filler Market Revenue (Billion), by Country 2024 & 2032
- Figure 68: South America Polymer Reinforcing Filler Market Volume (K Tons), by Country 2024 & 2032
- Figure 69: South America Polymer Reinforcing Filler Market Revenue Share (%), by Country 2024 & 2032
- Figure 70: South America Polymer Reinforcing Filler Market Volume Share (%), by Country 2024 & 2032
- Figure 71: Middle East and Africa Polymer Reinforcing Filler Market Revenue (Billion), by Type 2024 & 2032
- Figure 72: Middle East and Africa Polymer Reinforcing Filler Market Volume (K Tons), by Type 2024 & 2032
- Figure 73: Middle East and Africa Polymer Reinforcing Filler Market Revenue Share (%), by Type 2024 & 2032
- Figure 74: Middle East and Africa Polymer Reinforcing Filler Market Volume Share (%), by Type 2024 & 2032
- Figure 75: Middle East and Africa Polymer Reinforcing Filler Market Revenue (Billion), by End-user Industry 2024 & 2032
- Figure 76: Middle East and Africa Polymer Reinforcing Filler Market Volume (K Tons), by End-user Industry 2024 & 2032
- Figure 77: Middle East and Africa Polymer Reinforcing Filler Market Revenue Share (%), by End-user Industry 2024 & 2032
- Figure 78: Middle East and Africa Polymer Reinforcing Filler Market Volume Share (%), by End-user Industry 2024 & 2032
- Figure 79: Middle East and Africa Polymer Reinforcing Filler Market Revenue (Billion), by Country 2024 & 2032
- Figure 80: Middle East and Africa Polymer Reinforcing Filler Market Volume (K Tons), by Country 2024 & 2032
- Figure 81: Middle East and Africa Polymer Reinforcing Filler Market Revenue Share (%), by Country 2024 & 2032
- Figure 82: Middle East and Africa Polymer Reinforcing Filler Market Volume Share (%), by Country 2024 & 2032
List of Tables
- Table 1: Global Polymer Reinforcing Filler Market Revenue Billion Forecast, by Region 2019 & 2032
- Table 2: Global Polymer Reinforcing Filler Market Volume K Tons Forecast, by Region 2019 & 2032
- Table 3: Global Polymer Reinforcing Filler Market Revenue Billion Forecast, by Type 2019 & 2032
- Table 4: Global Polymer Reinforcing Filler Market Volume K Tons Forecast, by Type 2019 & 2032
- Table 5: Global Polymer Reinforcing Filler Market Revenue Billion Forecast, by End-user Industry 2019 & 2032
- Table 6: Global Polymer Reinforcing Filler Market Volume K Tons Forecast, by End-user Industry 2019 & 2032
- Table 7: Global Polymer Reinforcing Filler Market Revenue Billion Forecast, by Region 2019 & 2032
- Table 8: Global Polymer Reinforcing Filler Market Volume K Tons Forecast, by Region 2019 & 2032
- Table 9: Global Polymer Reinforcing Filler Market Revenue Billion Forecast, by Country 2019 & 2032
- Table 10: Global Polymer Reinforcing Filler Market Volume K Tons Forecast, by Country 2019 & 2032
- Table 11: United States Polymer Reinforcing Filler Market Revenue (Billion) Forecast, by Application 2019 & 2032
- Table 12: United States Polymer Reinforcing Filler Market Volume (K Tons) Forecast, by Application 2019 & 2032
- Table 13: Canada Polymer Reinforcing Filler Market Revenue (Billion) Forecast, by Application 2019 & 2032
- Table 14: Canada Polymer Reinforcing Filler Market Volume (K Tons) Forecast, by Application 2019 & 2032
- Table 15: Mexico Polymer Reinforcing Filler Market Revenue (Billion) Forecast, by Application 2019 & 2032
- Table 16: Mexico Polymer Reinforcing Filler Market Volume (K Tons) Forecast, by Application 2019 & 2032
- Table 17: Global Polymer Reinforcing Filler Market Revenue Billion Forecast, by Country 2019 & 2032
- Table 18: Global Polymer Reinforcing Filler Market Volume K Tons Forecast, by Country 2019 & 2032
- Table 19: Germany Polymer Reinforcing Filler Market Revenue (Billion) Forecast, by Application 2019 & 2032
- Table 20: Germany Polymer Reinforcing Filler Market Volume (K Tons) Forecast, by Application 2019 & 2032
- Table 21: France Polymer Reinforcing Filler Market Revenue (Billion) Forecast, by Application 2019 & 2032
- Table 22: France Polymer Reinforcing Filler Market Volume (K Tons) Forecast, by Application 2019 & 2032
- Table 23: Italy Polymer Reinforcing Filler Market Revenue (Billion) Forecast, by Application 2019 & 2032
- Table 24: Italy Polymer Reinforcing Filler Market Volume (K Tons) Forecast, by Application 2019 & 2032
- Table 25: United Kingdom Polymer Reinforcing Filler Market Revenue (Billion) Forecast, by Application 2019 & 2032
- Table 26: United Kingdom Polymer Reinforcing Filler Market Volume (K Tons) Forecast, by Application 2019 & 2032
- Table 27: Netherlands Polymer Reinforcing Filler Market Revenue (Billion) Forecast, by Application 2019 & 2032
- Table 28: Netherlands Polymer Reinforcing Filler Market Volume (K Tons) Forecast, by Application 2019 & 2032
- Table 29: Rest of Europe Polymer Reinforcing Filler Market Revenue (Billion) Forecast, by Application 2019 & 2032
- Table 30: Rest of Europe Polymer Reinforcing Filler Market Volume (K Tons) Forecast, by Application 2019 & 2032
- Table 31: Global Polymer Reinforcing Filler Market Revenue Billion Forecast, by Country 2019 & 2032
- Table 32: Global Polymer Reinforcing Filler Market Volume K Tons Forecast, by Country 2019 & 2032
- Table 33: China Polymer Reinforcing Filler Market Revenue (Billion) Forecast, by Application 2019 & 2032
- Table 34: China Polymer Reinforcing Filler Market Volume (K Tons) Forecast, by Application 2019 & 2032
- Table 35: Japan Polymer Reinforcing Filler Market Revenue (Billion) Forecast, by Application 2019 & 2032
- Table 36: Japan Polymer Reinforcing Filler Market Volume (K Tons) Forecast, by Application 2019 & 2032
- Table 37: India Polymer Reinforcing Filler Market Revenue (Billion) Forecast, by Application 2019 & 2032
- Table 38: India Polymer Reinforcing Filler Market Volume (K Tons) Forecast, by Application 2019 & 2032
- Table 39: South Korea Polymer Reinforcing Filler Market Revenue (Billion) Forecast, by Application 2019 & 2032
- Table 40: South Korea Polymer Reinforcing Filler Market Volume (K Tons) Forecast, by Application 2019 & 2032
- Table 41: Taiwan Polymer Reinforcing Filler Market Revenue (Billion) Forecast, by Application 2019 & 2032
- Table 42: Taiwan Polymer Reinforcing Filler Market Volume (K Tons) Forecast, by Application 2019 & 2032
- Table 43: Australia Polymer Reinforcing Filler Market Revenue (Billion) Forecast, by Application 2019 & 2032
- Table 44: Australia Polymer Reinforcing Filler Market Volume (K Tons) Forecast, by Application 2019 & 2032
- Table 45: Rest of Asia-Pacific Polymer Reinforcing Filler Market Revenue (Billion) Forecast, by Application 2019 & 2032
- Table 46: Rest of Asia-Pacific Polymer Reinforcing Filler Market Volume (K Tons) Forecast, by Application 2019 & 2032
- Table 47: Global Polymer Reinforcing Filler Market Revenue Billion Forecast, by Country 2019 & 2032
- Table 48: Global Polymer Reinforcing Filler Market Volume K Tons Forecast, by Country 2019 & 2032
- Table 49: Brazil Polymer Reinforcing Filler Market Revenue (Billion) Forecast, by Application 2019 & 2032
- Table 50: Brazil Polymer Reinforcing Filler Market Volume (K Tons) Forecast, by Application 2019 & 2032
- Table 51: Argentina Polymer Reinforcing Filler Market Revenue (Billion) Forecast, by Application 2019 & 2032
- Table 52: Argentina Polymer Reinforcing Filler Market Volume (K Tons) Forecast, by Application 2019 & 2032
- Table 53: Rest of South America Polymer Reinforcing Filler Market Revenue (Billion) Forecast, by Application 2019 & 2032
- Table 54: Rest of South America Polymer Reinforcing Filler Market Volume (K Tons) Forecast, by Application 2019 & 2032
- Table 55: Global Polymer Reinforcing Filler Market Revenue Billion Forecast, by Country 2019 & 2032
- Table 56: Global Polymer Reinforcing Filler Market Volume K Tons Forecast, by Country 2019 & 2032
- Table 57: Middle East Polymer Reinforcing Filler Market Revenue (Billion) Forecast, by Application 2019 & 2032
- Table 58: Middle East Polymer Reinforcing Filler Market Volume (K Tons) Forecast, by Application 2019 & 2032
- Table 59: Africa Polymer Reinforcing Filler Market Revenue (Billion) Forecast, by Application 2019 & 2032
- Table 60: Africa Polymer Reinforcing Filler Market Volume (K Tons) Forecast, by Application 2019 & 2032
- Table 61: Global Polymer Reinforcing Filler Market Revenue Billion Forecast, by Type 2019 & 2032
- Table 62: Global Polymer Reinforcing Filler Market Volume K Tons Forecast, by Type 2019 & 2032
- Table 63: Global Polymer Reinforcing Filler Market Revenue Billion Forecast, by End-user Industry 2019 & 2032
- Table 64: Global Polymer Reinforcing Filler Market Volume K Tons Forecast, by End-user Industry 2019 & 2032
- Table 65: Global Polymer Reinforcing Filler Market Revenue Billion Forecast, by Country 2019 & 2032
- Table 66: Global Polymer Reinforcing Filler Market Volume K Tons Forecast, by Country 2019 & 2032
- Table 67: China Polymer Reinforcing Filler Market Revenue (Billion) Forecast, by Application 2019 & 2032
- Table 68: China Polymer Reinforcing Filler Market Volume (K Tons) Forecast, by Application 2019 & 2032
- Table 69: India Polymer Reinforcing Filler Market Revenue (Billion) Forecast, by Application 2019 & 2032
- Table 70: India Polymer Reinforcing Filler Market Volume (K Tons) Forecast, by Application 2019 & 2032
- Table 71: Japan Polymer Reinforcing Filler Market Revenue (Billion) Forecast, by Application 2019 & 2032
- Table 72: Japan Polymer Reinforcing Filler Market Volume (K Tons) Forecast, by Application 2019 & 2032
- Table 73: South Korea Polymer Reinforcing Filler Market Revenue (Billion) Forecast, by Application 2019 & 2032
- Table 74: South Korea Polymer Reinforcing Filler Market Volume (K Tons) Forecast, by Application 2019 & 2032
- Table 75: Rest of Asia Pacific Polymer Reinforcing Filler Market Revenue (Billion) Forecast, by Application 2019 & 2032
- Table 76: Rest of Asia Pacific Polymer Reinforcing Filler Market Volume (K Tons) Forecast, by Application 2019 & 2032
- Table 77: Global Polymer Reinforcing Filler Market Revenue Billion Forecast, by Type 2019 & 2032
- Table 78: Global Polymer Reinforcing Filler Market Volume K Tons Forecast, by Type 2019 & 2032
- Table 79: Global Polymer Reinforcing Filler Market Revenue Billion Forecast, by End-user Industry 2019 & 2032
- Table 80: Global Polymer Reinforcing Filler Market Volume K Tons Forecast, by End-user Industry 2019 & 2032
- Table 81: Global Polymer Reinforcing Filler Market Revenue Billion Forecast, by Country 2019 & 2032
- Table 82: Global Polymer Reinforcing Filler Market Volume K Tons Forecast, by Country 2019 & 2032
- Table 83: United States Polymer Reinforcing Filler Market Revenue (Billion) Forecast, by Application 2019 & 2032
- Table 84: United States Polymer Reinforcing Filler Market Volume (K Tons) Forecast, by Application 2019 & 2032
- Table 85: Canada Polymer Reinforcing Filler Market Revenue (Billion) Forecast, by Application 2019 & 2032
- Table 86: Canada Polymer Reinforcing Filler Market Volume (K Tons) Forecast, by Application 2019 & 2032
- Table 87: Mexico Polymer Reinforcing Filler Market Revenue (Billion) Forecast, by Application 2019 & 2032
- Table 88: Mexico Polymer Reinforcing Filler Market Volume (K Tons) Forecast, by Application 2019 & 2032
- Table 89: Global Polymer Reinforcing Filler Market Revenue Billion Forecast, by Type 2019 & 2032
- Table 90: Global Polymer Reinforcing Filler Market Volume K Tons Forecast, by Type 2019 & 2032
- Table 91: Global Polymer Reinforcing Filler Market Revenue Billion Forecast, by End-user Industry 2019 & 2032
- Table 92: Global Polymer Reinforcing Filler Market Volume K Tons Forecast, by End-user Industry 2019 & 2032
- Table 93: Global Polymer Reinforcing Filler Market Revenue Billion Forecast, by Country 2019 & 2032
- Table 94: Global Polymer Reinforcing Filler Market Volume K Tons Forecast, by Country 2019 & 2032
- Table 95: Germany Polymer Reinforcing Filler Market Revenue (Billion) Forecast, by Application 2019 & 2032
- Table 96: Germany Polymer Reinforcing Filler Market Volume (K Tons) Forecast, by Application 2019 & 2032
- Table 97: United Kingdom Polymer Reinforcing Filler Market Revenue (Billion) Forecast, by Application 2019 & 2032
- Table 98: United Kingdom Polymer Reinforcing Filler Market Volume (K Tons) Forecast, by Application 2019 & 2032
- Table 99: France Polymer Reinforcing Filler Market Revenue (Billion) Forecast, by Application 2019 & 2032
- Table 100: France Polymer Reinforcing Filler Market Volume (K Tons) Forecast, by Application 2019 & 2032
- Table 101: Italy Polymer Reinforcing Filler Market Revenue (Billion) Forecast, by Application 2019 & 2032
- Table 102: Italy Polymer Reinforcing Filler Market Volume (K Tons) Forecast, by Application 2019 & 2032
- Table 103: Rest of Europe Polymer Reinforcing Filler Market Revenue (Billion) Forecast, by Application 2019 & 2032
- Table 104: Rest of Europe Polymer Reinforcing Filler Market Volume (K Tons) Forecast, by Application 2019 & 2032
- Table 105: Global Polymer Reinforcing Filler Market Revenue Billion Forecast, by Type 2019 & 2032
- Table 106: Global Polymer Reinforcing Filler Market Volume K Tons Forecast, by Type 2019 & 2032
- Table 107: Global Polymer Reinforcing Filler Market Revenue Billion Forecast, by End-user Industry 2019 & 2032
- Table 108: Global Polymer Reinforcing Filler Market Volume K Tons Forecast, by End-user Industry 2019 & 2032
- Table 109: Global Polymer Reinforcing Filler Market Revenue Billion Forecast, by Country 2019 & 2032
- Table 110: Global Polymer Reinforcing Filler Market Volume K Tons Forecast, by Country 2019 & 2032
- Table 111: Brazil Polymer Reinforcing Filler Market Revenue (Billion) Forecast, by Application 2019 & 2032
- Table 112: Brazil Polymer Reinforcing Filler Market Volume (K Tons) Forecast, by Application 2019 & 2032
- Table 113: Argentina Polymer Reinforcing Filler Market Revenue (Billion) Forecast, by Application 2019 & 2032
- Table 114: Argentina Polymer Reinforcing Filler Market Volume (K Tons) Forecast, by Application 2019 & 2032
- Table 115: Rest of South America Polymer Reinforcing Filler Market Revenue (Billion) Forecast, by Application 2019 & 2032
- Table 116: Rest of South America Polymer Reinforcing Filler Market Volume (K Tons) Forecast, by Application 2019 & 2032
- Table 117: Global Polymer Reinforcing Filler Market Revenue Billion Forecast, by Type 2019 & 2032
- Table 118: Global Polymer Reinforcing Filler Market Volume K Tons Forecast, by Type 2019 & 2032
- Table 119: Global Polymer Reinforcing Filler Market Revenue Billion Forecast, by End-user Industry 2019 & 2032
- Table 120: Global Polymer Reinforcing Filler Market Volume K Tons Forecast, by End-user Industry 2019 & 2032
- Table 121: Global Polymer Reinforcing Filler Market Revenue Billion Forecast, by Country 2019 & 2032
- Table 122: Global Polymer Reinforcing Filler Market Volume K Tons Forecast, by Country 2019 & 2032
- Table 123: Saudi Arabia Polymer Reinforcing Filler Market Revenue (Billion) Forecast, by Application 2019 & 2032
- Table 124: Saudi Arabia Polymer Reinforcing Filler Market Volume (K Tons) Forecast, by Application 2019 & 2032
- Table 125: South Africa Polymer Reinforcing Filler Market Revenue (Billion) Forecast, by Application 2019 & 2032
- Table 126: South Africa Polymer Reinforcing Filler Market Volume (K Tons) Forecast, by Application 2019 & 2032
- Table 127: Rest of Middle East and Africa Polymer Reinforcing Filler Market Revenue (Billion) Forecast, by Application 2019 & 2032
- Table 128: Rest of Middle East and Africa Polymer Reinforcing Filler Market Volume (K Tons) Forecast, by Application 2019 & 2032
Frequently Asked Questions
1. What is the projected Compound Annual Growth Rate (CAGR) of the Polymer Reinforcing Filler Market?
The projected CAGR is approximately 4.6%.
2. Which companies are prominent players in the Polymer Reinforcing Filler Market?
Key companies in the market include SGL Carbon, Hoffmann Mineral, Quarzwerke Group, Otsuka Chemical Co Ltd, Amco Polymers, Imerys Group, Deep Polymer, Orkila, RTP Company, Zeus Industrial Products Inc, Polymer Products (Phil) Inc, Omya AG, LKAB Minerals, Minerals Technologies Inc, GLC Minerals.
3. What are the main segments of the Polymer Reinforcing Filler Market?
The market segments include Type, End-user Industry.
4. Can you provide details about the market size?
The market size is estimated to be USD 12.45 Billion as of 2022.
5. What are some drivers contributing to market growth?
; Growing Demand from Building and Construction Industry; Other Drivers.
6. What are the notable trends driving market growth?
Building and Construction Segment to Dominate the Market.
7. Are there any restraints impacting market growth?
; Unfavorable Conditions Arising Due to COVID-19 Outbreak; Other Restraints.
8. Can you provide examples of recent developments in the market?
N/A
9. What pricing options are available for accessing the report?
Pricing options include single-user, multi-user, and enterprise licenses priced at USD 4750, USD 5250, and USD 8750 respectively.
10. Is the market size provided in terms of value or volume?
The market size is provided in terms of value, measured in Billion and volume, measured in K Tons.
11. Are there any specific market keywords associated with the report?
Yes, the market keyword associated with the report is "Polymer Reinforcing Filler Market," which aids in identifying and referencing the specific market segment covered.
12. How do I determine which pricing option suits my needs best?
The pricing options vary based on user requirements and access needs. Individual users may opt for single-user licenses, while businesses requiring broader access may choose multi-user or enterprise licenses for cost-effective access to the report.
13. Are there any additional resources or data provided in the Polymer Reinforcing Filler Market report?
While the report offers comprehensive insights, it's advisable to review the specific contents or supplementary materials provided to ascertain if additional resources or data are available.
14. How can I stay updated on further developments or reports in the Polymer Reinforcing Filler Market?
To stay informed about further developments, trends, and reports in the Polymer Reinforcing Filler Market, consider subscribing to industry newsletters, following relevant companies and organizations, or regularly checking reputable industry news sources and publications.
Methodology
Step 1 - Identification of Relevant Samples Size from Population Database


Step 2 - Approaches for Defining Global Market Size (Value, Volume* & Price*)

Note*: In applicable scenarios
Step 3 - Data Sources
Primary Research
- Web Analytics
- Survey Reports
- Research Institute
- Latest Research Reports
- Opinion Leaders
Secondary Research
- Annual Reports
- White Paper
- Latest Press Release
- Industry Association
- Paid Database
- Investor Presentations

Step 4 - Data Triangulation
Involves using different sources of information in order to increase the validity of a study
These sources are likely to be stakeholders in a program - participants, other researchers, program staff, other community members, and so on.
Then we put all data in single framework & apply various statistical tools to find out the dynamic on the market.
During the analysis stage, feedback from the stakeholder groups would be compared to determine areas of agreement as well as areas of divergence


