
Key Insights
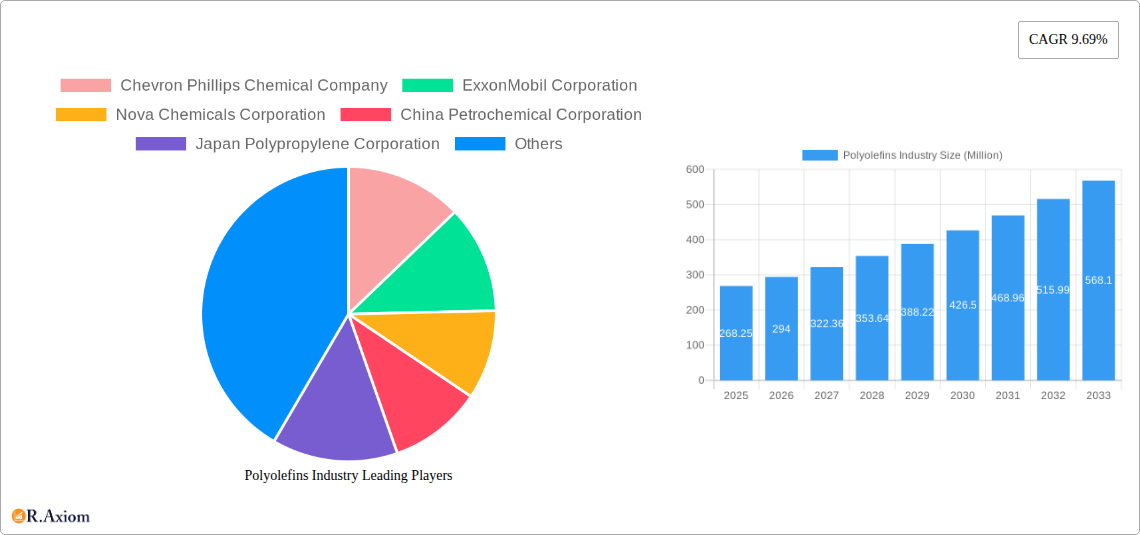
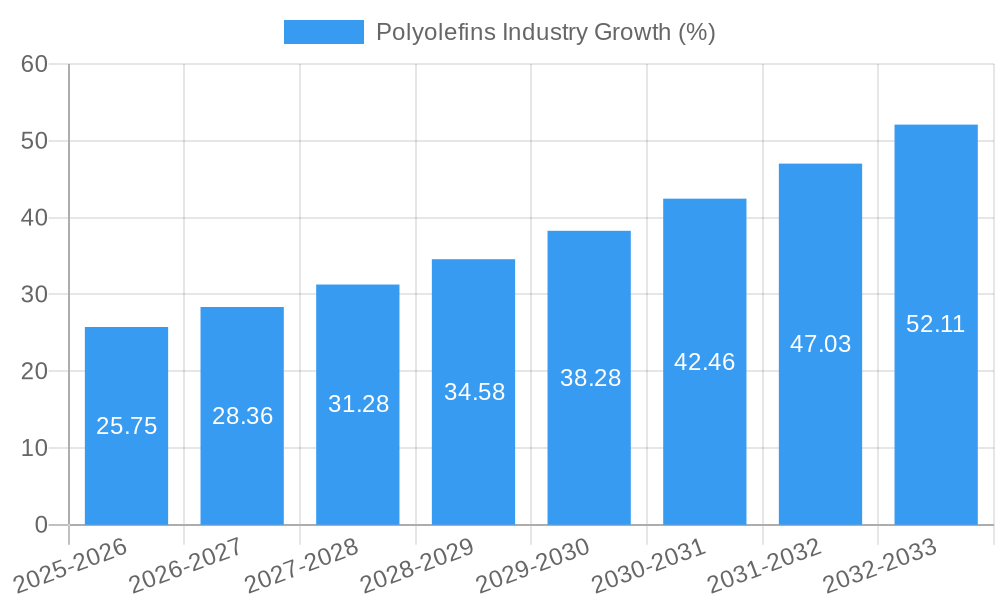
The global polyolefins market, valued at $268.25 million in 2025, is projected to experience robust growth, driven by a compound annual growth rate (CAGR) of 9.69% from 2025 to 2033. This expansion is fueled by several key factors. The increasing demand for flexible packaging in the food and beverage, consumer goods, and healthcare sectors significantly boosts the consumption of polyethylene (PE) and polypropylene (PP) films and sheets. Furthermore, the automotive industry's reliance on lightweight materials for improved fuel efficiency is driving demand for polyolefins in injection molding and blow molding applications. Growth in infrastructure development globally, particularly in emerging economies, further contributes to market expansion, as polyolefins are extensively used in pipes, conduits, and other infrastructure components. The rising adoption of sustainable and recyclable packaging solutions also presents opportunities for bio-based and recycled polyolefins, although cost competitiveness remains a challenge. However, fluctuations in raw material prices, particularly crude oil, pose a significant restraint on market growth. The market is segmented by material type (PE, PP, POE, EVA) and application (films & sheets, injection molding, blow molding, extrusion coating, fibers & raffia), with PE and PP dominating due to their versatility and cost-effectiveness. Regional growth will vary, with Asia-Pacific projected to be a key driver given its significant manufacturing base and burgeoning consumer markets. North America and Europe will also contribute substantially, supported by a mature industrial landscape and ongoing product innovation.
The competitive landscape is marked by the presence of major global players like Chevron Phillips Chemical, ExxonMobil, and Braskem, alongside several significant regional players in Asia and the Middle East. These companies are focusing on strategic partnerships, investments in R&D, and expansion of production capacities to capitalize on the growing demand. The market will witness intensified competition, with players increasingly focusing on differentiation through innovative product offerings and sustainable manufacturing practices. Despite challenges, the long-term outlook for the polyolefins market remains positive, driven by the sustained demand for lightweight, flexible, and durable materials across various end-use sectors. The market's future trajectory will be significantly impacted by government regulations concerning plastic waste, consumer preferences for sustainable products, and technological advancements in polymer science and recycling technologies.
Polyolefins Industry: A Comprehensive Market Report (2019-2033)
This comprehensive report provides an in-depth analysis of the global polyolefins industry, covering market size, growth drivers, competitive landscape, and future trends. The study period spans from 2019 to 2033, with 2025 serving as the base and estimated year. The forecast period is 2025-2033, and the historical period covers 2019-2024. This report is invaluable for industry stakeholders, investors, and market researchers seeking to understand the dynamics of this crucial sector.
Polyolefins Industry Market Concentration & Innovation
The global polyolefins market exhibits a moderately concentrated structure, with a few major players controlling a significant market share. Companies like ExxonMobil, Dow, and SABIC hold leading positions, benefiting from economies of scale and extensive global reach. Market share data indicates that the top 10 players account for approximately xx% of the global market in 2025. However, regional variations exist, with higher concentration observed in certain geographic areas.
Innovation within the polyolefins industry is driven by the ongoing need for enhanced material properties, improved processing efficiency, and sustainable solutions. Key innovations include the development of advanced polymer chemistries to create specialized grades with specific characteristics for various applications. For example, the focus on bio-based and recycled polyolefins is gaining traction, spurred by stricter environmental regulations and growing consumer demand for sustainable products.
Regulatory frameworks vary across regions, impacting the production and consumption of polyolefins. Stringent environmental regulations concerning plastic waste are driving the development of biodegradable and recyclable polyolefin materials. Product substitution presents a challenge, with alternative materials such as bioplastics and other polymers competing in specific applications. Nevertheless, polyolefins retain their competitive edge due to their cost-effectiveness, versatile properties, and established infrastructure.
Mergers and acquisitions (M&A) activity is frequent within the industry, with major players engaged in strategic acquisitions to expand their product portfolio, access new technologies, and gain market share. In recent years, M&A deal values have ranged from xx Million to xx Million, signifying substantial investment in consolidating market power and driving innovation.
- Key Metrics:
- Top 10 players market share (2025): xx%
- Average M&A deal value (2019-2024): xx Million
- Number of M&A deals (2019-2024): xx
Polyolefins Industry Industry Trends & Insights
The global polyolefins market is experiencing robust growth, driven by the increasing demand from diverse end-use sectors such as packaging, automotive, construction, and consumer goods. The market is projected to witness a Compound Annual Growth Rate (CAGR) of xx% during the forecast period (2025-2033). This growth is fueled by factors like rising disposable incomes, particularly in emerging economies, increasing population, and urbanization.
Technological disruptions are reshaping the industry, with advancements in polymer synthesis, processing technologies, and additive manufacturing enabling the creation of high-performance, customized polyolefin materials. Consumer preferences are shifting towards sustainable and eco-friendly products, driving innovation in biodegradable and recycled polyolefin solutions. The market penetration of such sustainable polyolefins is expected to increase from xx% in 2025 to xx% by 2033.
Competitive dynamics are intensifying, with companies focusing on enhancing product differentiation, expanding their product portfolio, and optimizing their supply chains. Price competition is a significant factor, especially in commodity-grade polyolefins. However, value-added products with enhanced performance characteristics command higher margins and are less susceptible to price pressure.
Dominant Markets & Segments in Polyolefins Industry
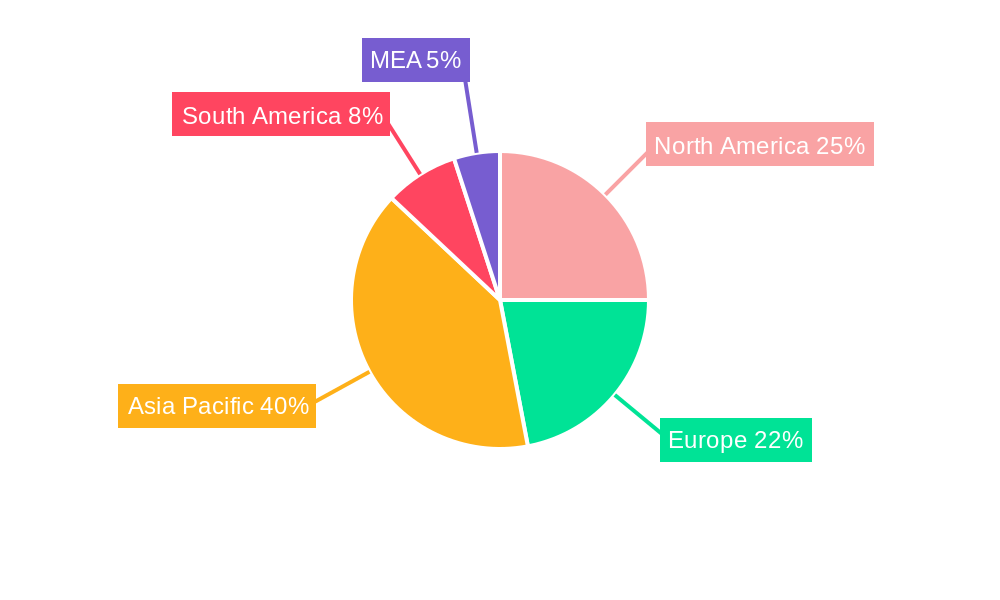
The Asia-Pacific region holds the largest market share in the global polyolefins industry, driven by robust economic growth, rising consumption, and increasing industrialization in countries like China and India. Within this region, China dominates as the largest national market due to its massive manufacturing base and expanding consumer market.
Material Type Dominance:
- Polyethylene (PE) currently holds the largest market share due to its extensive use in packaging and films.
- Polypropylene (PP) is experiencing strong growth, driven by its applications in automotive and consumer goods.
Application Dominance:
- Films and sheets constitute the largest application segment, with strong demand from the packaging industry.
- Injection molding is another significant segment, with applications across diverse industries.
Key Drivers for Dominant Regions:
- Asia-Pacific (China): Rapid industrialization, expanding manufacturing sector, and growing consumer demand.
- North America: Robust automotive and construction industries, established infrastructure.
- Europe: Focus on sustainable solutions and stringent environmental regulations.
Polyolefins Industry Product Developments
Recent product innovations focus on enhancing the properties of polyolefins for specific applications. These include developing high-performance polymers with improved strength, flexibility, and barrier properties, as well as bio-based and recycled polyolefins to cater to the growing demand for sustainable materials. The integration of nanomaterials and other additives further enhances the functional capabilities of polyolefins, catering to specialized applications in various industries. These developments offer significant competitive advantages by meeting the evolving needs of consumers and industries while adhering to environmental regulations.
Report Scope & Segmentation Analysis
This report comprehensively segments the polyolefins market based on material type (Polyethylene (PE), Polypropylene (PP), Polyolefin Elastomer (POE), Ethylene Vinyl Acetate (EVA)) and application (Films and Sheets, Injection Molding, Blow Molding, Extrusion Coating, Fibers and Raffia). Each segment's growth projections, market sizes, and competitive dynamics are thoroughly analyzed, offering a granular understanding of the market landscape. The report also considers regional variations in market trends and provides specific analysis for major regions worldwide.
Key Drivers of Polyolefins Industry Growth
The growth of the polyolefins industry is primarily propelled by several factors. The burgeoning packaging industry globally requires extensive use of polyolefins for diverse products. The automotive sector’s rising demand for lightweight and durable materials boosts the usage of polyolefins in automotive components. Furthermore, the construction sector uses significant quantities of polyolefins for pipes, films, and other applications. Finally, favorable government policies and incentives in various regions encouraging the use of plastics also contribute to the industry's growth.
Challenges in the Polyolefins Industry Sector
The polyolefins industry faces several challenges, including fluctuating raw material prices, particularly ethylene and propylene. Stringent environmental regulations regarding plastic waste management pose significant operational and compliance costs. Intense competition from alternative materials, particularly bioplastics, adds pressure on pricing and market share. Supply chain disruptions caused by geopolitical events and natural disasters further add complexity. These challenges necessitate strategic adjustments from industry players to maintain profitability and competitiveness.
Emerging Opportunities in Polyolefins Industry
Emerging opportunities exist in developing bio-based and recycled polyolefins to meet the growing demand for sustainable materials. The expansion of high-performance polyolefins with specific properties for niche applications, such as medical devices and electronics, presents significant potential. Furthermore, advancements in additive manufacturing (3D printing) using polyolefins are opening new avenues for product customization and design flexibility.
Leading Players in the Polyolefins Industry Market
- Chevron Phillips Chemical Company
- ExxonMobil Corporation
- Nova Chemicals Corporation
- China Petrochemical Corporation
- Japan Polypropylene Corporation
- Braskem
- Sasol Ltd
- LG Chem Ltd
- Reliance Industries Limited
- Daelim
- China National Petroleum Corporation
- PetroChina Company Limited
- BASF SE
- Arkema Group
- Dow
- Mitsubishi Chemical Holdings Corporation
- Formosa Plastics Corporation
- LyondellBasell Industries Holdings BV
- Tosoh Corporation
- SABIC (Saudi Basic Industries Corporation)
- Mitsui Chemicals Incorporated
Key Developments in Polyolefins Industry Industry
November 2022: Stavian Quang Yen Petrochemical, Ltd. selected LyondellBasell's polypropylene (PP) technology for a new world-scale production facility, adding 600 kiloton per annum of PP capacity. This partnership significantly strengthens LyondellBasell's position in the Asian market.
August 2022: SABIC SK Nexlene expanded its manufacturing plant in Ulsan, South Korea, indicating strong market demand for NEXLENE-based polyolefin solutions and a significant investment in regional capacity. The expansion is expected to increase supply and meet the growing demand for innovative polyolefin applications.
Strategic Outlook for Polyolefins Industry Market
The polyolefins market is poised for continued growth, driven by the increasing demand from diverse end-use sectors and technological advancements in polymer chemistry and processing. Sustainable polyolefin solutions will gain significant traction, while strategic partnerships and M&A activities will reshape the competitive landscape. The industry is expected to witness further consolidation, with major players expanding their global reach and product portfolio. Companies focused on innovation and sustainability will be best positioned to capitalize on the emerging opportunities within this dynamic market.
Polyolefins Industry Segmentation
-
1. Material Type
-
1.1. Polyethylene (PE)
- 1.1.1. High Density Polyethylene (HDPE)
- 1.1.2. Low Density Polyethylene (LDPE)
- 1.1.3. Linear Low-density Polyethylene (LLDPE)
- 1.2. Polypropylene (PP)
-
1.1. Polyethylene (PE)
-
2. Application
- 2.1. Films and Sheets
- 2.2. Injection Molding
- 2.3. Blow Molding
- 2.4. Extrusion Coating
- 2.5. Fibers and Raffia
Polyolefins Industry Segmentation By Geography
-
1. Asia Pacific
- 1.1. China
- 1.2. India
- 1.3. Japan
- 1.4. South Korea
- 1.5. Rest of Asia Pacific
-
2. North America
- 2.1. United States
- 2.2. Canada
- 2.3. Mexico
-
3. Europe
- 3.1. Germany
- 3.2. United Kingdom
- 3.3. Italy
- 3.4. France
- 3.5. Rest of Europe
-
4. South America
- 4.1. Brazil
- 4.2. Argentina
- 4.3. Rest of South America
-
5. Middle East and Africa
- 5.1. Saudi Arabia
- 5.2. South Africa
- 5.3. Rest of Middle East and Africa
Polyolefins Industry REPORT HIGHLIGHTS
| Aspects | Details |
|---|---|
| Study Period | 2019-2033 |
| Base Year | 2024 |
| Estimated Year | 2025 |
| Forecast Period | 2025-2033 |
| Historical Period | 2019-2024 |
| Growth Rate | CAGR of 9.69% from 2019-2033 |
| Segmentation |
|
Table of Contents
- 1. Introduction
- 1.1. Research Scope
- 1.2. Market Segmentation
- 1.3. Research Methodology
- 1.4. Definitions and Assumptions
- 2. Executive Summary
- 2.1. Introduction
- 3. Market Dynamics
- 3.1. Introduction
- 3.2. Market Drivers
- 3.2.1. Shift in Preferences from Rigid Packaging to Flexible Packaging; Growing Demand for Low-Cost Interior Furnishings
- 3.3. Market Restrains
- 3.3.1. Growing Environmental Regulations
- 3.4. Market Trends
- 3.4.1. Increasing Demand from Films and Sheets
- 4. Market Factor Analysis
- 4.1. Porters Five Forces
- 4.2. Supply/Value Chain
- 4.3. PESTEL analysis
- 4.4. Market Entropy
- 4.5. Patent/Trademark Analysis
- 5. Global Polyolefins Industry Analysis, Insights and Forecast, 2019-2031
- 5.1. Market Analysis, Insights and Forecast - by Material Type
- 5.1.1. Polyethylene (PE)
- 5.1.1.1. High Density Polyethylene (HDPE)
- 5.1.1.2. Low Density Polyethylene (LDPE)
- 5.1.1.3. Linear Low-density Polyethylene (LLDPE)
- 5.1.2. Polypropylene (PP)
- 5.1.1. Polyethylene (PE)
- 5.2. Market Analysis, Insights and Forecast - by Application
- 5.2.1. Films and Sheets
- 5.2.2. Injection Molding
- 5.2.3. Blow Molding
- 5.2.4. Extrusion Coating
- 5.2.5. Fibers and Raffia
- 5.3. Market Analysis, Insights and Forecast - by Region
- 5.3.1. Asia Pacific
- 5.3.2. North America
- 5.3.3. Europe
- 5.3.4. South America
- 5.3.5. Middle East and Africa
- 5.1. Market Analysis, Insights and Forecast - by Material Type
- 6. Asia Pacific Polyolefins Industry Analysis, Insights and Forecast, 2019-2031
- 6.1. Market Analysis, Insights and Forecast - by Material Type
- 6.1.1. Polyethylene (PE)
- 6.1.1.1. High Density Polyethylene (HDPE)
- 6.1.1.2. Low Density Polyethylene (LDPE)
- 6.1.1.3. Linear Low-density Polyethylene (LLDPE)
- 6.1.2. Polypropylene (PP)
- 6.1.1. Polyethylene (PE)
- 6.2. Market Analysis, Insights and Forecast - by Application
- 6.2.1. Films and Sheets
- 6.2.2. Injection Molding
- 6.2.3. Blow Molding
- 6.2.4. Extrusion Coating
- 6.2.5. Fibers and Raffia
- 6.1. Market Analysis, Insights and Forecast - by Material Type
- 7. North America Polyolefins Industry Analysis, Insights and Forecast, 2019-2031
- 7.1. Market Analysis, Insights and Forecast - by Material Type
- 7.1.1. Polyethylene (PE)
- 7.1.1.1. High Density Polyethylene (HDPE)
- 7.1.1.2. Low Density Polyethylene (LDPE)
- 7.1.1.3. Linear Low-density Polyethylene (LLDPE)
- 7.1.2. Polypropylene (PP)
- 7.1.1. Polyethylene (PE)
- 7.2. Market Analysis, Insights and Forecast - by Application
- 7.2.1. Films and Sheets
- 7.2.2. Injection Molding
- 7.2.3. Blow Molding
- 7.2.4. Extrusion Coating
- 7.2.5. Fibers and Raffia
- 7.1. Market Analysis, Insights and Forecast - by Material Type
- 8. Europe Polyolefins Industry Analysis, Insights and Forecast, 2019-2031
- 8.1. Market Analysis, Insights and Forecast - by Material Type
- 8.1.1. Polyethylene (PE)
- 8.1.1.1. High Density Polyethylene (HDPE)
- 8.1.1.2. Low Density Polyethylene (LDPE)
- 8.1.1.3. Linear Low-density Polyethylene (LLDPE)
- 8.1.2. Polypropylene (PP)
- 8.1.1. Polyethylene (PE)
- 8.2. Market Analysis, Insights and Forecast - by Application
- 8.2.1. Films and Sheets
- 8.2.2. Injection Molding
- 8.2.3. Blow Molding
- 8.2.4. Extrusion Coating
- 8.2.5. Fibers and Raffia
- 8.1. Market Analysis, Insights and Forecast - by Material Type
- 9. South America Polyolefins Industry Analysis, Insights and Forecast, 2019-2031
- 9.1. Market Analysis, Insights and Forecast - by Material Type
- 9.1.1. Polyethylene (PE)
- 9.1.1.1. High Density Polyethylene (HDPE)
- 9.1.1.2. Low Density Polyethylene (LDPE)
- 9.1.1.3. Linear Low-density Polyethylene (LLDPE)
- 9.1.2. Polypropylene (PP)
- 9.1.1. Polyethylene (PE)
- 9.2. Market Analysis, Insights and Forecast - by Application
- 9.2.1. Films and Sheets
- 9.2.2. Injection Molding
- 9.2.3. Blow Molding
- 9.2.4. Extrusion Coating
- 9.2.5. Fibers and Raffia
- 9.1. Market Analysis, Insights and Forecast - by Material Type
- 10. Middle East and Africa Polyolefins Industry Analysis, Insights and Forecast, 2019-2031
- 10.1. Market Analysis, Insights and Forecast - by Material Type
- 10.1.1. Polyethylene (PE)
- 10.1.1.1. High Density Polyethylene (HDPE)
- 10.1.1.2. Low Density Polyethylene (LDPE)
- 10.1.1.3. Linear Low-density Polyethylene (LLDPE)
- 10.1.2. Polypropylene (PP)
- 10.1.1. Polyethylene (PE)
- 10.2. Market Analysis, Insights and Forecast - by Application
- 10.2.1. Films and Sheets
- 10.2.2. Injection Molding
- 10.2.3. Blow Molding
- 10.2.4. Extrusion Coating
- 10.2.5. Fibers and Raffia
- 10.1. Market Analysis, Insights and Forecast - by Material Type
- 11. North America Polyolefins Industry Analysis, Insights and Forecast, 2019-2031
- 11.1. Market Analysis, Insights and Forecast - By Country/Sub-region
- 11.1.1 United States
- 11.1.2 Canada
- 11.1.3 Mexico
- 12. Europe Polyolefins Industry Analysis, Insights and Forecast, 2019-2031
- 12.1. Market Analysis, Insights and Forecast - By Country/Sub-region
- 12.1.1 Germany
- 12.1.2 France
- 12.1.3 Italy
- 12.1.4 United Kingdom
- 12.1.5 Netherlands
- 12.1.6 Rest of Europe
- 13. Asia Pacific Polyolefins Industry Analysis, Insights and Forecast, 2019-2031
- 13.1. Market Analysis, Insights and Forecast - By Country/Sub-region
- 13.1.1 China
- 13.1.2 Japan
- 13.1.3 India
- 13.1.4 South Korea
- 13.1.5 Taiwan
- 13.1.6 Australia
- 13.1.7 Rest of Asia-Pacific
- 14. South America Polyolefins Industry Analysis, Insights and Forecast, 2019-2031
- 14.1. Market Analysis, Insights and Forecast - By Country/Sub-region
- 14.1.1 Brazil
- 14.1.2 Argentina
- 14.1.3 Rest of South America
- 15. MEA Polyolefins Industry Analysis, Insights and Forecast, 2019-2031
- 15.1. Market Analysis, Insights and Forecast - By Country/Sub-region
- 15.1.1 Middle East
- 15.1.2 Africa
- 16. Competitive Analysis
- 16.1. Global Market Share Analysis 2024
- 16.2. Company Profiles
- 16.2.1 Chevron Phillips Chemical Company
- 16.2.1.1. Overview
- 16.2.1.2. Products
- 16.2.1.3. SWOT Analysis
- 16.2.1.4. Recent Developments
- 16.2.1.5. Financials (Based on Availability)
- 16.2.2 ExxonMobil Corporation
- 16.2.2.1. Overview
- 16.2.2.2. Products
- 16.2.2.3. SWOT Analysis
- 16.2.2.4. Recent Developments
- 16.2.2.5. Financials (Based on Availability)
- 16.2.3 Nova Chemicals Corporation
- 16.2.3.1. Overview
- 16.2.3.2. Products
- 16.2.3.3. SWOT Analysis
- 16.2.3.4. Recent Developments
- 16.2.3.5. Financials (Based on Availability)
- 16.2.4 China Petrochemical Corporation
- 16.2.4.1. Overview
- 16.2.4.2. Products
- 16.2.4.3. SWOT Analysis
- 16.2.4.4. Recent Developments
- 16.2.4.5. Financials (Based on Availability)
- 16.2.5 Japan Polypropylene Corporation
- 16.2.5.1. Overview
- 16.2.5.2. Products
- 16.2.5.3. SWOT Analysis
- 16.2.5.4. Recent Developments
- 16.2.5.5. Financials (Based on Availability)
- 16.2.6 Braskem
- 16.2.6.1. Overview
- 16.2.6.2. Products
- 16.2.6.3. SWOT Analysis
- 16.2.6.4. Recent Developments
- 16.2.6.5. Financials (Based on Availability)
- 16.2.7 Sasol Ltd
- 16.2.7.1. Overview
- 16.2.7.2. Products
- 16.2.7.3. SWOT Analysis
- 16.2.7.4. Recent Developments
- 16.2.7.5. Financials (Based on Availability)
- 16.2.8 LG Chem Ltd
- 16.2.8.1. Overview
- 16.2.8.2. Products
- 16.2.8.3. SWOT Analysis
- 16.2.8.4. Recent Developments
- 16.2.8.5. Financials (Based on Availability)
- 16.2.9 Reliance Industries Limited
- 16.2.9.1. Overview
- 16.2.9.2. Products
- 16.2.9.3. SWOT Analysis
- 16.2.9.4. Recent Developments
- 16.2.9.5. Financials (Based on Availability)
- 16.2.10 Daelim
- 16.2.10.1. Overview
- 16.2.10.2. Products
- 16.2.10.3. SWOT Analysis
- 16.2.10.4. Recent Developments
- 16.2.10.5. Financials (Based on Availability)
- 16.2.11 China National Petroleum Corporation
- 16.2.11.1. Overview
- 16.2.11.2. Products
- 16.2.11.3. SWOT Analysis
- 16.2.11.4. Recent Developments
- 16.2.11.5. Financials (Based on Availability)
- 16.2.12 PetroChina Company Limited
- 16.2.12.1. Overview
- 16.2.12.2. Products
- 16.2.12.3. SWOT Analysis
- 16.2.12.4. Recent Developments
- 16.2.12.5. Financials (Based on Availability)
- 16.2.13 BASF SE
- 16.2.13.1. Overview
- 16.2.13.2. Products
- 16.2.13.3. SWOT Analysis
- 16.2.13.4. Recent Developments
- 16.2.13.5. Financials (Based on Availability)
- 16.2.14 Arkema Group
- 16.2.14.1. Overview
- 16.2.14.2. Products
- 16.2.14.3. SWOT Analysis
- 16.2.14.4. Recent Developments
- 16.2.14.5. Financials (Based on Availability)
- 16.2.15 Dow
- 16.2.15.1. Overview
- 16.2.15.2. Products
- 16.2.15.3. SWOT Analysis
- 16.2.15.4. Recent Developments
- 16.2.15.5. Financials (Based on Availability)
- 16.2.16 Mitsubishi Chemical Holdings Corporation
- 16.2.16.1. Overview
- 16.2.16.2. Products
- 16.2.16.3. SWOT Analysis
- 16.2.16.4. Recent Developments
- 16.2.16.5. Financials (Based on Availability)
- 16.2.17 Formosa Plastics Corporation
- 16.2.17.1. Overview
- 16.2.17.2. Products
- 16.2.17.3. SWOT Analysis
- 16.2.17.4. Recent Developments
- 16.2.17.5. Financials (Based on Availability)
- 16.2.18 LyondellBasell Industries Holdings BV
- 16.2.18.1. Overview
- 16.2.18.2. Products
- 16.2.18.3. SWOT Analysis
- 16.2.18.4. Recent Developments
- 16.2.18.5. Financials (Based on Availability)
- 16.2.19 Tosoh Corporation
- 16.2.19.1. Overview
- 16.2.19.2. Products
- 16.2.19.3. SWOT Analysis
- 16.2.19.4. Recent Developments
- 16.2.19.5. Financials (Based on Availability)
- 16.2.20 SABIC (Saudi Basic Industries Corporation)
- 16.2.20.1. Overview
- 16.2.20.2. Products
- 16.2.20.3. SWOT Analysis
- 16.2.20.4. Recent Developments
- 16.2.20.5. Financials (Based on Availability)
- 16.2.21 Mitsui Chemicals Incorporated
- 16.2.21.1. Overview
- 16.2.21.2. Products
- 16.2.21.3. SWOT Analysis
- 16.2.21.4. Recent Developments
- 16.2.21.5. Financials (Based on Availability)
- 16.2.1 Chevron Phillips Chemical Company
List of Figures
- Figure 1: Global Polyolefins Industry Revenue Breakdown (Million, %) by Region 2024 & 2032
- Figure 2: Global Polyolefins Industry Volume Breakdown (K Tons, %) by Region 2024 & 2032
- Figure 3: North America Polyolefins Industry Revenue (Million), by Country 2024 & 2032
- Figure 4: North America Polyolefins Industry Volume (K Tons), by Country 2024 & 2032
- Figure 5: North America Polyolefins Industry Revenue Share (%), by Country 2024 & 2032
- Figure 6: North America Polyolefins Industry Volume Share (%), by Country 2024 & 2032
- Figure 7: Europe Polyolefins Industry Revenue (Million), by Country 2024 & 2032
- Figure 8: Europe Polyolefins Industry Volume (K Tons), by Country 2024 & 2032
- Figure 9: Europe Polyolefins Industry Revenue Share (%), by Country 2024 & 2032
- Figure 10: Europe Polyolefins Industry Volume Share (%), by Country 2024 & 2032
- Figure 11: Asia Pacific Polyolefins Industry Revenue (Million), by Country 2024 & 2032
- Figure 12: Asia Pacific Polyolefins Industry Volume (K Tons), by Country 2024 & 2032
- Figure 13: Asia Pacific Polyolefins Industry Revenue Share (%), by Country 2024 & 2032
- Figure 14: Asia Pacific Polyolefins Industry Volume Share (%), by Country 2024 & 2032
- Figure 15: South America Polyolefins Industry Revenue (Million), by Country 2024 & 2032
- Figure 16: South America Polyolefins Industry Volume (K Tons), by Country 2024 & 2032
- Figure 17: South America Polyolefins Industry Revenue Share (%), by Country 2024 & 2032
- Figure 18: South America Polyolefins Industry Volume Share (%), by Country 2024 & 2032
- Figure 19: MEA Polyolefins Industry Revenue (Million), by Country 2024 & 2032
- Figure 20: MEA Polyolefins Industry Volume (K Tons), by Country 2024 & 2032
- Figure 21: MEA Polyolefins Industry Revenue Share (%), by Country 2024 & 2032
- Figure 22: MEA Polyolefins Industry Volume Share (%), by Country 2024 & 2032
- Figure 23: Asia Pacific Polyolefins Industry Revenue (Million), by Material Type 2024 & 2032
- Figure 24: Asia Pacific Polyolefins Industry Volume (K Tons), by Material Type 2024 & 2032
- Figure 25: Asia Pacific Polyolefins Industry Revenue Share (%), by Material Type 2024 & 2032
- Figure 26: Asia Pacific Polyolefins Industry Volume Share (%), by Material Type 2024 & 2032
- Figure 27: Asia Pacific Polyolefins Industry Revenue (Million), by Application 2024 & 2032
- Figure 28: Asia Pacific Polyolefins Industry Volume (K Tons), by Application 2024 & 2032
- Figure 29: Asia Pacific Polyolefins Industry Revenue Share (%), by Application 2024 & 2032
- Figure 30: Asia Pacific Polyolefins Industry Volume Share (%), by Application 2024 & 2032
- Figure 31: Asia Pacific Polyolefins Industry Revenue (Million), by Country 2024 & 2032
- Figure 32: Asia Pacific Polyolefins Industry Volume (K Tons), by Country 2024 & 2032
- Figure 33: Asia Pacific Polyolefins Industry Revenue Share (%), by Country 2024 & 2032
- Figure 34: Asia Pacific Polyolefins Industry Volume Share (%), by Country 2024 & 2032
- Figure 35: North America Polyolefins Industry Revenue (Million), by Material Type 2024 & 2032
- Figure 36: North America Polyolefins Industry Volume (K Tons), by Material Type 2024 & 2032
- Figure 37: North America Polyolefins Industry Revenue Share (%), by Material Type 2024 & 2032
- Figure 38: North America Polyolefins Industry Volume Share (%), by Material Type 2024 & 2032
- Figure 39: North America Polyolefins Industry Revenue (Million), by Application 2024 & 2032
- Figure 40: North America Polyolefins Industry Volume (K Tons), by Application 2024 & 2032
- Figure 41: North America Polyolefins Industry Revenue Share (%), by Application 2024 & 2032
- Figure 42: North America Polyolefins Industry Volume Share (%), by Application 2024 & 2032
- Figure 43: North America Polyolefins Industry Revenue (Million), by Country 2024 & 2032
- Figure 44: North America Polyolefins Industry Volume (K Tons), by Country 2024 & 2032
- Figure 45: North America Polyolefins Industry Revenue Share (%), by Country 2024 & 2032
- Figure 46: North America Polyolefins Industry Volume Share (%), by Country 2024 & 2032
- Figure 47: Europe Polyolefins Industry Revenue (Million), by Material Type 2024 & 2032
- Figure 48: Europe Polyolefins Industry Volume (K Tons), by Material Type 2024 & 2032
- Figure 49: Europe Polyolefins Industry Revenue Share (%), by Material Type 2024 & 2032
- Figure 50: Europe Polyolefins Industry Volume Share (%), by Material Type 2024 & 2032
- Figure 51: Europe Polyolefins Industry Revenue (Million), by Application 2024 & 2032
- Figure 52: Europe Polyolefins Industry Volume (K Tons), by Application 2024 & 2032
- Figure 53: Europe Polyolefins Industry Revenue Share (%), by Application 2024 & 2032
- Figure 54: Europe Polyolefins Industry Volume Share (%), by Application 2024 & 2032
- Figure 55: Europe Polyolefins Industry Revenue (Million), by Country 2024 & 2032
- Figure 56: Europe Polyolefins Industry Volume (K Tons), by Country 2024 & 2032
- Figure 57: Europe Polyolefins Industry Revenue Share (%), by Country 2024 & 2032
- Figure 58: Europe Polyolefins Industry Volume Share (%), by Country 2024 & 2032
- Figure 59: South America Polyolefins Industry Revenue (Million), by Material Type 2024 & 2032
- Figure 60: South America Polyolefins Industry Volume (K Tons), by Material Type 2024 & 2032
- Figure 61: South America Polyolefins Industry Revenue Share (%), by Material Type 2024 & 2032
- Figure 62: South America Polyolefins Industry Volume Share (%), by Material Type 2024 & 2032
- Figure 63: South America Polyolefins Industry Revenue (Million), by Application 2024 & 2032
- Figure 64: South America Polyolefins Industry Volume (K Tons), by Application 2024 & 2032
- Figure 65: South America Polyolefins Industry Revenue Share (%), by Application 2024 & 2032
- Figure 66: South America Polyolefins Industry Volume Share (%), by Application 2024 & 2032
- Figure 67: South America Polyolefins Industry Revenue (Million), by Country 2024 & 2032
- Figure 68: South America Polyolefins Industry Volume (K Tons), by Country 2024 & 2032
- Figure 69: South America Polyolefins Industry Revenue Share (%), by Country 2024 & 2032
- Figure 70: South America Polyolefins Industry Volume Share (%), by Country 2024 & 2032
- Figure 71: Middle East and Africa Polyolefins Industry Revenue (Million), by Material Type 2024 & 2032
- Figure 72: Middle East and Africa Polyolefins Industry Volume (K Tons), by Material Type 2024 & 2032
- Figure 73: Middle East and Africa Polyolefins Industry Revenue Share (%), by Material Type 2024 & 2032
- Figure 74: Middle East and Africa Polyolefins Industry Volume Share (%), by Material Type 2024 & 2032
- Figure 75: Middle East and Africa Polyolefins Industry Revenue (Million), by Application 2024 & 2032
- Figure 76: Middle East and Africa Polyolefins Industry Volume (K Tons), by Application 2024 & 2032
- Figure 77: Middle East and Africa Polyolefins Industry Revenue Share (%), by Application 2024 & 2032
- Figure 78: Middle East and Africa Polyolefins Industry Volume Share (%), by Application 2024 & 2032
- Figure 79: Middle East and Africa Polyolefins Industry Revenue (Million), by Country 2024 & 2032
- Figure 80: Middle East and Africa Polyolefins Industry Volume (K Tons), by Country 2024 & 2032
- Figure 81: Middle East and Africa Polyolefins Industry Revenue Share (%), by Country 2024 & 2032
- Figure 82: Middle East and Africa Polyolefins Industry Volume Share (%), by Country 2024 & 2032
List of Tables
- Table 1: Global Polyolefins Industry Revenue Million Forecast, by Region 2019 & 2032
- Table 2: Global Polyolefins Industry Volume K Tons Forecast, by Region 2019 & 2032
- Table 3: Global Polyolefins Industry Revenue Million Forecast, by Material Type 2019 & 2032
- Table 4: Global Polyolefins Industry Volume K Tons Forecast, by Material Type 2019 & 2032
- Table 5: Global Polyolefins Industry Revenue Million Forecast, by Application 2019 & 2032
- Table 6: Global Polyolefins Industry Volume K Tons Forecast, by Application 2019 & 2032
- Table 7: Global Polyolefins Industry Revenue Million Forecast, by Region 2019 & 2032
- Table 8: Global Polyolefins Industry Volume K Tons Forecast, by Region 2019 & 2032
- Table 9: Global Polyolefins Industry Revenue Million Forecast, by Country 2019 & 2032
- Table 10: Global Polyolefins Industry Volume K Tons Forecast, by Country 2019 & 2032
- Table 11: United States Polyolefins Industry Revenue (Million) Forecast, by Application 2019 & 2032
- Table 12: United States Polyolefins Industry Volume (K Tons) Forecast, by Application 2019 & 2032
- Table 13: Canada Polyolefins Industry Revenue (Million) Forecast, by Application 2019 & 2032
- Table 14: Canada Polyolefins Industry Volume (K Tons) Forecast, by Application 2019 & 2032
- Table 15: Mexico Polyolefins Industry Revenue (Million) Forecast, by Application 2019 & 2032
- Table 16: Mexico Polyolefins Industry Volume (K Tons) Forecast, by Application 2019 & 2032
- Table 17: Global Polyolefins Industry Revenue Million Forecast, by Country 2019 & 2032
- Table 18: Global Polyolefins Industry Volume K Tons Forecast, by Country 2019 & 2032
- Table 19: Germany Polyolefins Industry Revenue (Million) Forecast, by Application 2019 & 2032
- Table 20: Germany Polyolefins Industry Volume (K Tons) Forecast, by Application 2019 & 2032
- Table 21: France Polyolefins Industry Revenue (Million) Forecast, by Application 2019 & 2032
- Table 22: France Polyolefins Industry Volume (K Tons) Forecast, by Application 2019 & 2032
- Table 23: Italy Polyolefins Industry Revenue (Million) Forecast, by Application 2019 & 2032
- Table 24: Italy Polyolefins Industry Volume (K Tons) Forecast, by Application 2019 & 2032
- Table 25: United Kingdom Polyolefins Industry Revenue (Million) Forecast, by Application 2019 & 2032
- Table 26: United Kingdom Polyolefins Industry Volume (K Tons) Forecast, by Application 2019 & 2032
- Table 27: Netherlands Polyolefins Industry Revenue (Million) Forecast, by Application 2019 & 2032
- Table 28: Netherlands Polyolefins Industry Volume (K Tons) Forecast, by Application 2019 & 2032
- Table 29: Rest of Europe Polyolefins Industry Revenue (Million) Forecast, by Application 2019 & 2032
- Table 30: Rest of Europe Polyolefins Industry Volume (K Tons) Forecast, by Application 2019 & 2032
- Table 31: Global Polyolefins Industry Revenue Million Forecast, by Country 2019 & 2032
- Table 32: Global Polyolefins Industry Volume K Tons Forecast, by Country 2019 & 2032
- Table 33: China Polyolefins Industry Revenue (Million) Forecast, by Application 2019 & 2032
- Table 34: China Polyolefins Industry Volume (K Tons) Forecast, by Application 2019 & 2032
- Table 35: Japan Polyolefins Industry Revenue (Million) Forecast, by Application 2019 & 2032
- Table 36: Japan Polyolefins Industry Volume (K Tons) Forecast, by Application 2019 & 2032
- Table 37: India Polyolefins Industry Revenue (Million) Forecast, by Application 2019 & 2032
- Table 38: India Polyolefins Industry Volume (K Tons) Forecast, by Application 2019 & 2032
- Table 39: South Korea Polyolefins Industry Revenue (Million) Forecast, by Application 2019 & 2032
- Table 40: South Korea Polyolefins Industry Volume (K Tons) Forecast, by Application 2019 & 2032
- Table 41: Taiwan Polyolefins Industry Revenue (Million) Forecast, by Application 2019 & 2032
- Table 42: Taiwan Polyolefins Industry Volume (K Tons) Forecast, by Application 2019 & 2032
- Table 43: Australia Polyolefins Industry Revenue (Million) Forecast, by Application 2019 & 2032
- Table 44: Australia Polyolefins Industry Volume (K Tons) Forecast, by Application 2019 & 2032
- Table 45: Rest of Asia-Pacific Polyolefins Industry Revenue (Million) Forecast, by Application 2019 & 2032
- Table 46: Rest of Asia-Pacific Polyolefins Industry Volume (K Tons) Forecast, by Application 2019 & 2032
- Table 47: Global Polyolefins Industry Revenue Million Forecast, by Country 2019 & 2032
- Table 48: Global Polyolefins Industry Volume K Tons Forecast, by Country 2019 & 2032
- Table 49: Brazil Polyolefins Industry Revenue (Million) Forecast, by Application 2019 & 2032
- Table 50: Brazil Polyolefins Industry Volume (K Tons) Forecast, by Application 2019 & 2032
- Table 51: Argentina Polyolefins Industry Revenue (Million) Forecast, by Application 2019 & 2032
- Table 52: Argentina Polyolefins Industry Volume (K Tons) Forecast, by Application 2019 & 2032
- Table 53: Rest of South America Polyolefins Industry Revenue (Million) Forecast, by Application 2019 & 2032
- Table 54: Rest of South America Polyolefins Industry Volume (K Tons) Forecast, by Application 2019 & 2032
- Table 55: Global Polyolefins Industry Revenue Million Forecast, by Country 2019 & 2032
- Table 56: Global Polyolefins Industry Volume K Tons Forecast, by Country 2019 & 2032
- Table 57: Middle East Polyolefins Industry Revenue (Million) Forecast, by Application 2019 & 2032
- Table 58: Middle East Polyolefins Industry Volume (K Tons) Forecast, by Application 2019 & 2032
- Table 59: Africa Polyolefins Industry Revenue (Million) Forecast, by Application 2019 & 2032
- Table 60: Africa Polyolefins Industry Volume (K Tons) Forecast, by Application 2019 & 2032
- Table 61: Global Polyolefins Industry Revenue Million Forecast, by Material Type 2019 & 2032
- Table 62: Global Polyolefins Industry Volume K Tons Forecast, by Material Type 2019 & 2032
- Table 63: Global Polyolefins Industry Revenue Million Forecast, by Application 2019 & 2032
- Table 64: Global Polyolefins Industry Volume K Tons Forecast, by Application 2019 & 2032
- Table 65: Global Polyolefins Industry Revenue Million Forecast, by Country 2019 & 2032
- Table 66: Global Polyolefins Industry Volume K Tons Forecast, by Country 2019 & 2032
- Table 67: China Polyolefins Industry Revenue (Million) Forecast, by Application 2019 & 2032
- Table 68: China Polyolefins Industry Volume (K Tons) Forecast, by Application 2019 & 2032
- Table 69: India Polyolefins Industry Revenue (Million) Forecast, by Application 2019 & 2032
- Table 70: India Polyolefins Industry Volume (K Tons) Forecast, by Application 2019 & 2032
- Table 71: Japan Polyolefins Industry Revenue (Million) Forecast, by Application 2019 & 2032
- Table 72: Japan Polyolefins Industry Volume (K Tons) Forecast, by Application 2019 & 2032
- Table 73: South Korea Polyolefins Industry Revenue (Million) Forecast, by Application 2019 & 2032
- Table 74: South Korea Polyolefins Industry Volume (K Tons) Forecast, by Application 2019 & 2032
- Table 75: Rest of Asia Pacific Polyolefins Industry Revenue (Million) Forecast, by Application 2019 & 2032
- Table 76: Rest of Asia Pacific Polyolefins Industry Volume (K Tons) Forecast, by Application 2019 & 2032
- Table 77: Global Polyolefins Industry Revenue Million Forecast, by Material Type 2019 & 2032
- Table 78: Global Polyolefins Industry Volume K Tons Forecast, by Material Type 2019 & 2032
- Table 79: Global Polyolefins Industry Revenue Million Forecast, by Application 2019 & 2032
- Table 80: Global Polyolefins Industry Volume K Tons Forecast, by Application 2019 & 2032
- Table 81: Global Polyolefins Industry Revenue Million Forecast, by Country 2019 & 2032
- Table 82: Global Polyolefins Industry Volume K Tons Forecast, by Country 2019 & 2032
- Table 83: United States Polyolefins Industry Revenue (Million) Forecast, by Application 2019 & 2032
- Table 84: United States Polyolefins Industry Volume (K Tons) Forecast, by Application 2019 & 2032
- Table 85: Canada Polyolefins Industry Revenue (Million) Forecast, by Application 2019 & 2032
- Table 86: Canada Polyolefins Industry Volume (K Tons) Forecast, by Application 2019 & 2032
- Table 87: Mexico Polyolefins Industry Revenue (Million) Forecast, by Application 2019 & 2032
- Table 88: Mexico Polyolefins Industry Volume (K Tons) Forecast, by Application 2019 & 2032
- Table 89: Global Polyolefins Industry Revenue Million Forecast, by Material Type 2019 & 2032
- Table 90: Global Polyolefins Industry Volume K Tons Forecast, by Material Type 2019 & 2032
- Table 91: Global Polyolefins Industry Revenue Million Forecast, by Application 2019 & 2032
- Table 92: Global Polyolefins Industry Volume K Tons Forecast, by Application 2019 & 2032
- Table 93: Global Polyolefins Industry Revenue Million Forecast, by Country 2019 & 2032
- Table 94: Global Polyolefins Industry Volume K Tons Forecast, by Country 2019 & 2032
- Table 95: Germany Polyolefins Industry Revenue (Million) Forecast, by Application 2019 & 2032
- Table 96: Germany Polyolefins Industry Volume (K Tons) Forecast, by Application 2019 & 2032
- Table 97: United Kingdom Polyolefins Industry Revenue (Million) Forecast, by Application 2019 & 2032
- Table 98: United Kingdom Polyolefins Industry Volume (K Tons) Forecast, by Application 2019 & 2032
- Table 99: Italy Polyolefins Industry Revenue (Million) Forecast, by Application 2019 & 2032
- Table 100: Italy Polyolefins Industry Volume (K Tons) Forecast, by Application 2019 & 2032
- Table 101: France Polyolefins Industry Revenue (Million) Forecast, by Application 2019 & 2032
- Table 102: France Polyolefins Industry Volume (K Tons) Forecast, by Application 2019 & 2032
- Table 103: Rest of Europe Polyolefins Industry Revenue (Million) Forecast, by Application 2019 & 2032
- Table 104: Rest of Europe Polyolefins Industry Volume (K Tons) Forecast, by Application 2019 & 2032
- Table 105: Global Polyolefins Industry Revenue Million Forecast, by Material Type 2019 & 2032
- Table 106: Global Polyolefins Industry Volume K Tons Forecast, by Material Type 2019 & 2032
- Table 107: Global Polyolefins Industry Revenue Million Forecast, by Application 2019 & 2032
- Table 108: Global Polyolefins Industry Volume K Tons Forecast, by Application 2019 & 2032
- Table 109: Global Polyolefins Industry Revenue Million Forecast, by Country 2019 & 2032
- Table 110: Global Polyolefins Industry Volume K Tons Forecast, by Country 2019 & 2032
- Table 111: Brazil Polyolefins Industry Revenue (Million) Forecast, by Application 2019 & 2032
- Table 112: Brazil Polyolefins Industry Volume (K Tons) Forecast, by Application 2019 & 2032
- Table 113: Argentina Polyolefins Industry Revenue (Million) Forecast, by Application 2019 & 2032
- Table 114: Argentina Polyolefins Industry Volume (K Tons) Forecast, by Application 2019 & 2032
- Table 115: Rest of South America Polyolefins Industry Revenue (Million) Forecast, by Application 2019 & 2032
- Table 116: Rest of South America Polyolefins Industry Volume (K Tons) Forecast, by Application 2019 & 2032
- Table 117: Global Polyolefins Industry Revenue Million Forecast, by Material Type 2019 & 2032
- Table 118: Global Polyolefins Industry Volume K Tons Forecast, by Material Type 2019 & 2032
- Table 119: Global Polyolefins Industry Revenue Million Forecast, by Application 2019 & 2032
- Table 120: Global Polyolefins Industry Volume K Tons Forecast, by Application 2019 & 2032
- Table 121: Global Polyolefins Industry Revenue Million Forecast, by Country 2019 & 2032
- Table 122: Global Polyolefins Industry Volume K Tons Forecast, by Country 2019 & 2032
- Table 123: Saudi Arabia Polyolefins Industry Revenue (Million) Forecast, by Application 2019 & 2032
- Table 124: Saudi Arabia Polyolefins Industry Volume (K Tons) Forecast, by Application 2019 & 2032
- Table 125: South Africa Polyolefins Industry Revenue (Million) Forecast, by Application 2019 & 2032
- Table 126: South Africa Polyolefins Industry Volume (K Tons) Forecast, by Application 2019 & 2032
- Table 127: Rest of Middle East and Africa Polyolefins Industry Revenue (Million) Forecast, by Application 2019 & 2032
- Table 128: Rest of Middle East and Africa Polyolefins Industry Volume (K Tons) Forecast, by Application 2019 & 2032
Frequently Asked Questions
1. What is the projected Compound Annual Growth Rate (CAGR) of the Polyolefins Industry?
The projected CAGR is approximately 9.69%.
2. Which companies are prominent players in the Polyolefins Industry?
Key companies in the market include Chevron Phillips Chemical Company, ExxonMobil Corporation, Nova Chemicals Corporation, China Petrochemical Corporation, Japan Polypropylene Corporation, Braskem, Sasol Ltd, LG Chem Ltd, Reliance Industries Limited, Daelim, China National Petroleum Corporation, PetroChina Company Limited, BASF SE, Arkema Group, Dow, Mitsubishi Chemical Holdings Corporation, Formosa Plastics Corporation, LyondellBasell Industries Holdings BV, Tosoh Corporation, SABIC (Saudi Basic Industries Corporation), Mitsui Chemicals Incorporated.
3. What are the main segments of the Polyolefins Industry?
The market segments include Material Type, Application.
4. Can you provide details about the market size?
The market size is estimated to be USD 268.25 Million as of 2022.
5. What are some drivers contributing to market growth?
Shift in Preferences from Rigid Packaging to Flexible Packaging; Growing Demand for Low-Cost Interior Furnishings.
6. What are the notable trends driving market growth?
Increasing Demand from Films and Sheets.
7. Are there any restraints impacting market growth?
Growing Environmental Regulations.
8. Can you provide examples of recent developments in the market?
November 2022: Stavian Quang Yen Petrochemical, Ltd. selected LyondellBasell's polypropylene (PP) technology for a new world-scale production facility. A 600-kiloton-per-annum PP plant equipped with LyondellBasell's Spheripol technology would fit in the facility. With this partnership, LyondellBasell became the polypropylene licensor for the group's first polyolefin facility.
9. What pricing options are available for accessing the report?
Pricing options include single-user, multi-user, and enterprise licenses priced at USD 4750, USD 5250, and USD 8750 respectively.
10. Is the market size provided in terms of value or volume?
The market size is provided in terms of value, measured in Million and volume, measured in K Tons.
11. Are there any specific market keywords associated with the report?
Yes, the market keyword associated with the report is "Polyolefins Industry," which aids in identifying and referencing the specific market segment covered.
12. How do I determine which pricing option suits my needs best?
The pricing options vary based on user requirements and access needs. Individual users may opt for single-user licenses, while businesses requiring broader access may choose multi-user or enterprise licenses for cost-effective access to the report.
13. Are there any additional resources or data provided in the Polyolefins Industry report?
While the report offers comprehensive insights, it's advisable to review the specific contents or supplementary materials provided to ascertain if additional resources or data are available.
14. How can I stay updated on further developments or reports in the Polyolefins Industry?
To stay informed about further developments, trends, and reports in the Polyolefins Industry, consider subscribing to industry newsletters, following relevant companies and organizations, or regularly checking reputable industry news sources and publications.
Methodology
Step 1 - Identification of Relevant Samples Size from Population Database


Step 2 - Approaches for Defining Global Market Size (Value, Volume* & Price*)

Note*: In applicable scenarios
Step 3 - Data Sources
Primary Research
- Web Analytics
- Survey Reports
- Research Institute
- Latest Research Reports
- Opinion Leaders
Secondary Research
- Annual Reports
- White Paper
- Latest Press Release
- Industry Association
- Paid Database
- Investor Presentations

Step 4 - Data Triangulation
Involves using different sources of information in order to increase the validity of a study
These sources are likely to be stakeholders in a program - participants, other researchers, program staff, other community members, and so on.
Then we put all data in single framework & apply various statistical tools to find out the dynamic on the market.
During the analysis stage, feedback from the stakeholder groups would be compared to determine areas of agreement as well as areas of divergence


