
Key Insights
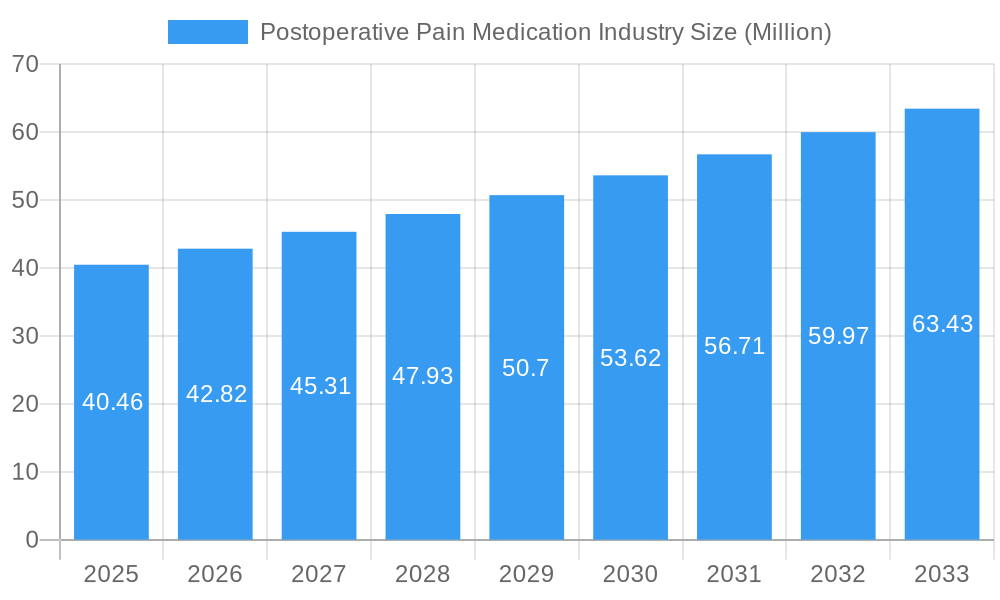
The global Postoperative Pain Medication market is poised for significant expansion, with a current market size estimated at approximately USD 40.46 billion in 2025. This robust growth is projected to continue at a Compound Annual Growth Rate (CAGR) of 5.79% through 2033, indicating a dynamic and expanding industry. The primary drivers fueling this growth are the increasing volume of surgical procedures across diverse medical specialties, a greater emphasis on patient recovery and pain management to improve outcomes and reduce hospital stays, and advancements in drug development leading to more effective and targeted pain relief solutions. The rising global population and an aging demographic also contribute to the increased demand for surgical interventions and subsequent pain management. Furthermore, the growing awareness among healthcare professionals and patients about the importance of adequate postoperative pain control is a key factor propelling market expansion.

Postoperative Pain Medication Industry Market Size (In Million)

The market's trajectory is further shaped by evolving trends such as the growing preference for multimodal analgesia, which combines different classes of drugs and non-pharmacological approaches to achieve optimal pain relief with fewer side effects. The development and adoption of novel drug delivery systems, including long-acting injectables and patient-controlled analgesia (PCA) devices, are also contributing to market momentum by enhancing convenience and patient compliance. Geographically, North America and Europe are expected to remain dominant markets, driven by high healthcare expenditure, advanced medical infrastructure, and a high prevalence of elective surgeries. However, the Asia Pacific region is anticipated to witness the fastest growth, fueled by increasing healthcare access, a rising middle class, and a burgeoning medical tourism sector. Despite the positive outlook, restraints such as the potential for opioid addiction and abuse, stringent regulatory frameworks for drug approval, and the development of effective pain management alternatives could pose challenges to sustained growth.
Postoperative Pain Medication Industry Company Market Share
Postoperative Pain Medication Industry Market Concentration & Innovation
The postoperative pain management market exhibits a moderate concentration, with a few key players holding significant market share, estimated at over 80% of the total market value. Innovation is a primary driver, spurred by the urgent need for safer, more effective, and less addictive pain relief solutions. Regulatory frameworks, particularly stringent guidelines from agencies like the FDA and EMA regarding opioid prescribing and abuse, are reshaping product development towards non-opioid alternatives and extended-release formulations. Product substitutes, ranging from conventional analgesics to non-pharmacological interventions, exert some pressure, but the demand for robust postoperative pain control remains high. End-user trends reflect a growing preference for multimodal analgesia, minimizing reliance on single drug classes. Merger and acquisition (M&A) activities, valued at an estimated $5 Million historically, are anticipated to increase as companies seek to bolster their portfolios with novel technologies and expand their market reach.
Postoperative Pain Medication Industry Industry Trends & Insights
The global postoperative pain medication market is experiencing robust growth, driven by an increasing number of surgical procedures worldwide, an aging population, and heightened awareness regarding effective pain management. The compound annual growth rate (CAGR) is projected to be 6.5% from 2025 to 2033. Technological disruptions are central to this growth, with significant investment in developing long-acting injectable formulations, localized anesthetic delivery systems, and non-opioid analgesics. These innovations aim to reduce the incidence of chronic postoperative pain and mitigate the risks associated with traditional opioid therapies, such as addiction and side effects. Consumer preferences are shifting towards patient-centric care, emphasizing faster recovery times and reduced hospital stays, which directly influences the demand for advanced pain management solutions. Competitive dynamics are intensifying, with pharmaceutical giants and innovative biotechs vying for market dominance through extensive R&D and strategic partnerships. The market penetration of novel drug delivery systems is steadily increasing, reflecting a growing acceptance of these advanced therapeutic approaches by both healthcare providers and patients. The rising prevalence of chronic pain conditions post-surgery further fuels the demand for effective and sustained pain relief.
Dominant Markets & Segments in Postoperative Pain Medication Industry
The Injectable route of administration is currently the dominant segment within the postoperative pain medication industry, driven by its rapid onset of action and efficacy in acute postoperative settings. This segment is projected to account for over 45% of the market revenue by 2033.
- Key Drivers for Injectable Dominance:
- Immediate pain relief requirements following surgical procedures.
- Precise dosage control and targeted delivery.
- Established clinical practice and healthcare professional familiarity.
The Opioids drug class, despite ongoing regulatory scrutiny and a push for alternatives, continues to hold a significant market share due to its potent analgesic properties, particularly for severe pain. However, its growth is expected to be tempered by the rise of non-opioid alternatives.
- Key Drivers for Opioid Market Share:
- Unmatched efficacy for severe and moderate-to-severe pain.
- Widespread availability and physician familiarity.
- Acute pain management needs that sometimes necessitate opioid use.
Hospital Pharmacies represent the primary distribution channel, reflecting the direct administration and dispensing of postoperative pain medications within healthcare facilities.
- Key Drivers for Hospital Pharmacy Dominance:
- Direct patient access post-surgery.
- Specialized handling and storage requirements for certain medications.
- Inclusion in hospital formularies and procurement processes.
North America, particularly the United States, leads the market due to a high volume of surgical procedures, advanced healthcare infrastructure, and significant investment in pain management research and development.
- Detailed Dominance Analysis:
- Drug Class: While Opioids remain strong, Non-steroidal anti-inflammatory drugs (NSAIDs) are witnessing substantial growth, driven by their favorable safety profiles and efficacy in mild to moderate pain, often used in combination therapy. Cyclooxygenase-2 (COX-2) inhibitors, a subset of NSAIDs, are gaining traction due to their targeted mechanism and reduced gastrointestinal side effects.
- Route of Administration: Injectable formulations, including intravenous and intramuscular options, offer rapid pain relief, making them indispensable in the immediate postoperative period. Long-acting injectable formulations are emerging as a key innovation, extending analgesic duration and reducing the need for frequent dosing. Oral medications are crucial for ongoing pain management post-discharge. Topical formulations are gaining popularity for localized pain relief, reducing systemic exposure and side effects.
- Distribution Channel: Hospital pharmacies are critical for in-patient care and initial pain management. Retail pharmacies play a vital role in supplying post-discharge medications. The increasing trend of ambulatory surgery centers also influences distribution patterns, with a growing reliance on retail channels for outpatient pain management.
Postoperative Pain Medication Industry Product Developments
Product developments in the postoperative pain medication industry are increasingly focused on non-opioid alternatives and advanced drug delivery systems. Innovations like long-acting injectable ropivacaine (CPL-01) by Cali Biosciences and combination therapies like Heron Therapeutics' ZYNRELEF, which combines a local anesthetic with an NSAID, offer improved efficacy and reduced side effect profiles. These developments aim to provide sustained pain relief, enhance patient recovery, and address the global opioid crisis by offering safer and more effective pain management solutions. The competitive advantage lies in formulations that minimize systemic absorption, reduce the need for frequent dosing, and offer a favorable risk-benefit profile for patients undergoing surgery.
Report Scope & Segmentation Analysis
This report analyzes the Postoperative Pain Medication Industry across key segmentations to provide a comprehensive market overview. Drug Class: The market is segmented into Opioids, Non-steroidal anti-inflammatory drugs (NSAIDs), Cyclooxygenase-2 (COX-2) inhibitors, and Other Drug Classes, with projected growth rates varying based on regulatory trends and innovation in each category. Route of Administration: Segmentation includes Injectable, Oral, Topical, and Other Routes of Administration. Injectables are expected to lead in the initial forecast period, with significant growth anticipated in long-acting formulations. Distribution Channel: The report examines Hospital Pharmacies, Retail Pharmacies, and Other Distribution Channels, highlighting the evolving landscape of pharmaceutical distribution in healthcare settings. Each segment is analyzed for its market size, growth projections, and competitive dynamics, offering insights into their respective contributions to the overall industry.
Key Drivers of Postoperative Pain Medication Industry Growth
Several key factors are propelling the growth of the postoperative pain medication industry. The increasing number of elective and emergency surgical procedures globally, driven by an aging population and rising prevalence of chronic diseases, directly translates to higher demand for effective pain management. Advancements in medical technology have led to minimally invasive surgical techniques, which, while reducing recovery time, still necessitate robust pain control to ensure patient comfort and mobility. Furthermore, heightened awareness among healthcare professionals and patients regarding the importance of adequate postoperative pain management, coupled with the drive to reduce opioid dependency, is spurring innovation and adoption of alternative analgesic strategies. Regulatory support for the development of non-opioid pain relievers also plays a crucial role in shaping market dynamics.
Challenges in the Postoperative Pain Medication Industry Sector
The postoperative pain medication industry faces significant challenges. The ongoing opioid crisis has led to stringent regulations and prescription limitations, impacting the market for opioid-based analgesics. Developing and gaining regulatory approval for novel non-opioid pain medications is a lengthy and costly process, often involving extensive clinical trials and navigating complex regulatory pathways. The high cost of developing advanced drug delivery systems and novel formulations can also be a barrier to widespread adoption, particularly in price-sensitive markets. Additionally, the threat of product substitution from over-the-counter analgesics and alternative therapies requires continuous innovation and demonstration of superior efficacy and safety profiles. Supply chain disruptions and the increasing complexity of global pharmaceutical manufacturing can also pose challenges.
Emerging Opportunities in Postoperative Pain Medication Industry
Emerging opportunities in the postoperative pain medication industry are largely centered around innovation and addressing unmet patient needs. The development of long-acting injectable formulations that provide sustained pain relief for extended periods post-surgery presents a significant opportunity to reduce opioid reliance and improve patient compliance. The growing demand for personalized pain management approaches, tailored to individual patient profiles and pain thresholds, opens avenues for targeted therapies and combination drug strategies. Furthermore, advancements in localized drug delivery systems, such as targeted infiltration techniques and implantable devices, offer potential for highly effective pain control with minimized systemic side effects. The increasing focus on managing chronic postoperative pain and enhancing patient recovery outcomes also presents a fertile ground for new product development and market expansion.
Leading Players in the Postoperative Pain Medication Industry Market
Innocoll Bayer AG Johnson & Johnson (Janssen Pharmaceuticals) Cali Biosciences Alembic Pharmaceuticals AFT Pharmaceuticals SiteOne Therapeutics Pfizer Inc Haleon PLC (GSK) AbbVie (Allergan) Cipla Inc (InvaGen Pharmaceuticals Inc) Heron Therapeutics Pacira Pharmaceuticals Inc
Key Developments in Postoperative Pain Medication Industry Industry
- April 2023: Cali Biosciences Co., Ltd. initiated Phase III studies of its core product, CPL-01 (long-acting ropivacaine), with dosing in hernia patients already begun and dosing in bunion patients scheduled to start next month.
- March 2022: Health Canada issued a Notice of Compliance (NOC) to commercialize Heron Therapeutics' ZYNRELEF (bupivacaine, an amide local anesthetic, and meloxicam, a nonsteroidal anti-inflammatory drug (NSAID) extended-release solution) for instillation into the surgical wound for postoperative analgesia after a bunionectomy, open inguinal herniorrhaphy, and total knee arthroplasty surgical procedures.
Strategic Outlook for Postoperative Pain Medication Industry Market
The strategic outlook for the postoperative pain medication industry is overwhelmingly positive, driven by continuous innovation and a growing demand for safer, more effective pain management solutions. The shift away from opioids towards non-opioid analgesics and advanced drug delivery systems represents a significant growth catalyst. Companies investing in research and development for long-acting injectables, localized therapies, and multimodal pain management strategies are well-positioned for success. The increasing global surgical volume and the aging population will further fuel market expansion. Strategic collaborations, mergers, and acquisitions are anticipated as key players seek to strengthen their product portfolios and market reach. The industry is poised for sustained growth as it addresses the critical need for improved patient outcomes and a reduced burden of postoperative pain.
Postoperative Pain Medication Industry Segmentation
-
1. Drug Class
- 1.1. Opioids
- 1.2. Non-steroidal anti-inflammatory drugs (NSAIDS)
- 1.3. Cyclooxy
- 1.4. Other Drug Classes
-
2. Route of Administration
- 2.1. Injectable
- 2.2. Oral
- 2.3. Topical
- 2.4. Other Routes of Administration
-
3. Distribution Channel
- 3.1. Hospital Pharmacies
- 3.2. Retail Pharmacies
- 3.3. Other Distribution Channels
Postoperative Pain Medication Industry Segmentation By Geography
-
1. North America
- 1.1. United States
- 1.2. Canada
- 1.3. Mexico
-
2. Europe
- 2.1. Germany
- 2.2. United Kingdom
- 2.3. France
- 2.4. Italy
- 2.5. Spain
- 2.6. Rest of Europe
-
3. Asia Pacific
- 3.1. China
- 3.2. Japan
- 3.3. India
- 3.4. Australia
- 3.5. South Korea
- 3.6. Rest of Asia Pacific
-
4. Middle East and Africa
- 4.1. GCC
- 4.2. South Africa
- 4.3. Rest of Middle East and Africa
-
5. South America
- 5.1. Brazil
- 5.2. Argentina
- 5.3. Rest of South America

Postoperative Pain Medication Industry Regional Market Share
Geographic Coverage of Postoperative Pain Medication Industry
Postoperative Pain Medication Industry REPORT HIGHLIGHTS
| Aspects | Details |
|---|---|
| Study Period | 2020-2034 |
| Base Year | 2025 |
| Estimated Year | 2026 |
| Forecast Period | 2026-2034 |
| Historical Period | 2020-2025 |
| Growth Rate | CAGR of 5.79% from 2020-2034 |
| Segmentation |
|
Table of Contents
- 1. Introduction
- 1.1. Research Scope
- 1.2. Market Segmentation
- 1.3. Research Methodology
- 1.4. Definitions and Assumptions
- 2. Executive Summary
- 2.1. Introduction
- 3. Market Dynamics
- 3.1. Introduction
- 3.2. Market Drivers
- 3.2.1. Growing Number of Surgical Procedures; Increasing Demand for Non-Opioid Based Anaelgesics; Increasing Focus Towards Palliative Care
- 3.3. Market Restrains
- 3.3.1. Concerns Pertaining to the Overuse of Opioids
- 3.4. Market Trends
- 3.4.1. Non-steroidal anti-inflammatory drugs (NSAIDs) Segment is Expected to Hold a Significant Share in the Postoperative Pain Management Market
- 4. Market Factor Analysis
- 4.1. Porters Five Forces
- 4.2. Supply/Value Chain
- 4.3. PESTEL analysis
- 4.4. Market Entropy
- 4.5. Patent/Trademark Analysis
- 5. Global Postoperative Pain Medication Industry Analysis, Insights and Forecast, 2020-2032
- 5.1. Market Analysis, Insights and Forecast - by Drug Class
- 5.1.1. Opioids
- 5.1.2. Non-steroidal anti-inflammatory drugs (NSAIDS)
- 5.1.3. Cyclooxy
- 5.1.4. Other Drug Classes
- 5.2. Market Analysis, Insights and Forecast - by Route of Administration
- 5.2.1. Injectable
- 5.2.2. Oral
- 5.2.3. Topical
- 5.2.4. Other Routes of Administration
- 5.3. Market Analysis, Insights and Forecast - by Distribution Channel
- 5.3.1. Hospital Pharmacies
- 5.3.2. Retail Pharmacies
- 5.3.3. Other Distribution Channels
- 5.4. Market Analysis, Insights and Forecast - by Region
- 5.4.1. North America
- 5.4.2. Europe
- 5.4.3. Asia Pacific
- 5.4.4. Middle East and Africa
- 5.4.5. South America
- 5.1. Market Analysis, Insights and Forecast - by Drug Class
- 6. North America Postoperative Pain Medication Industry Analysis, Insights and Forecast, 2020-2032
- 6.1. Market Analysis, Insights and Forecast - by Drug Class
- 6.1.1. Opioids
- 6.1.2. Non-steroidal anti-inflammatory drugs (NSAIDS)
- 6.1.3. Cyclooxy
- 6.1.4. Other Drug Classes
- 6.2. Market Analysis, Insights and Forecast - by Route of Administration
- 6.2.1. Injectable
- 6.2.2. Oral
- 6.2.3. Topical
- 6.2.4. Other Routes of Administration
- 6.3. Market Analysis, Insights and Forecast - by Distribution Channel
- 6.3.1. Hospital Pharmacies
- 6.3.2. Retail Pharmacies
- 6.3.3. Other Distribution Channels
- 6.1. Market Analysis, Insights and Forecast - by Drug Class
- 7. Europe Postoperative Pain Medication Industry Analysis, Insights and Forecast, 2020-2032
- 7.1. Market Analysis, Insights and Forecast - by Drug Class
- 7.1.1. Opioids
- 7.1.2. Non-steroidal anti-inflammatory drugs (NSAIDS)
- 7.1.3. Cyclooxy
- 7.1.4. Other Drug Classes
- 7.2. Market Analysis, Insights and Forecast - by Route of Administration
- 7.2.1. Injectable
- 7.2.2. Oral
- 7.2.3. Topical
- 7.2.4. Other Routes of Administration
- 7.3. Market Analysis, Insights and Forecast - by Distribution Channel
- 7.3.1. Hospital Pharmacies
- 7.3.2. Retail Pharmacies
- 7.3.3. Other Distribution Channels
- 7.1. Market Analysis, Insights and Forecast - by Drug Class
- 8. Asia Pacific Postoperative Pain Medication Industry Analysis, Insights and Forecast, 2020-2032
- 8.1. Market Analysis, Insights and Forecast - by Drug Class
- 8.1.1. Opioids
- 8.1.2. Non-steroidal anti-inflammatory drugs (NSAIDS)
- 8.1.3. Cyclooxy
- 8.1.4. Other Drug Classes
- 8.2. Market Analysis, Insights and Forecast - by Route of Administration
- 8.2.1. Injectable
- 8.2.2. Oral
- 8.2.3. Topical
- 8.2.4. Other Routes of Administration
- 8.3. Market Analysis, Insights and Forecast - by Distribution Channel
- 8.3.1. Hospital Pharmacies
- 8.3.2. Retail Pharmacies
- 8.3.3. Other Distribution Channels
- 8.1. Market Analysis, Insights and Forecast - by Drug Class
- 9. Middle East and Africa Postoperative Pain Medication Industry Analysis, Insights and Forecast, 2020-2032
- 9.1. Market Analysis, Insights and Forecast - by Drug Class
- 9.1.1. Opioids
- 9.1.2. Non-steroidal anti-inflammatory drugs (NSAIDS)
- 9.1.3. Cyclooxy
- 9.1.4. Other Drug Classes
- 9.2. Market Analysis, Insights and Forecast - by Route of Administration
- 9.2.1. Injectable
- 9.2.2. Oral
- 9.2.3. Topical
- 9.2.4. Other Routes of Administration
- 9.3. Market Analysis, Insights and Forecast - by Distribution Channel
- 9.3.1. Hospital Pharmacies
- 9.3.2. Retail Pharmacies
- 9.3.3. Other Distribution Channels
- 9.1. Market Analysis, Insights and Forecast - by Drug Class
- 10. South America Postoperative Pain Medication Industry Analysis, Insights and Forecast, 2020-2032
- 10.1. Market Analysis, Insights and Forecast - by Drug Class
- 10.1.1. Opioids
- 10.1.2. Non-steroidal anti-inflammatory drugs (NSAIDS)
- 10.1.3. Cyclooxy
- 10.1.4. Other Drug Classes
- 10.2. Market Analysis, Insights and Forecast - by Route of Administration
- 10.2.1. Injectable
- 10.2.2. Oral
- 10.2.3. Topical
- 10.2.4. Other Routes of Administration
- 10.3. Market Analysis, Insights and Forecast - by Distribution Channel
- 10.3.1. Hospital Pharmacies
- 10.3.2. Retail Pharmacies
- 10.3.3. Other Distribution Channels
- 10.1. Market Analysis, Insights and Forecast - by Drug Class
- 11. Competitive Analysis
- 11.1. Global Market Share Analysis 2025
- 11.2. Company Profiles
- 11.2.1 Innocoll
- 11.2.1.1. Overview
- 11.2.1.2. Products
- 11.2.1.3. SWOT Analysis
- 11.2.1.4. Recent Developments
- 11.2.1.5. Financials (Based on Availability)
- 11.2.2 Bayer AG
- 11.2.2.1. Overview
- 11.2.2.2. Products
- 11.2.2.3. SWOT Analysis
- 11.2.2.4. Recent Developments
- 11.2.2.5. Financials (Based on Availability)
- 11.2.3 Johnson & Johnson (Janssen Pharmaceuticals)
- 11.2.3.1. Overview
- 11.2.3.2. Products
- 11.2.3.3. SWOT Analysis
- 11.2.3.4. Recent Developments
- 11.2.3.5. Financials (Based on Availability)
- 11.2.4 Cali Biosciences
- 11.2.4.1. Overview
- 11.2.4.2. Products
- 11.2.4.3. SWOT Analysis
- 11.2.4.4. Recent Developments
- 11.2.4.5. Financials (Based on Availability)
- 11.2.5 Alembic Pharmaceuticals
- 11.2.5.1. Overview
- 11.2.5.2. Products
- 11.2.5.3. SWOT Analysis
- 11.2.5.4. Recent Developments
- 11.2.5.5. Financials (Based on Availability)
- 11.2.6 AFT Pharmaceuticals
- 11.2.6.1. Overview
- 11.2.6.2. Products
- 11.2.6.3. SWOT Analysis
- 11.2.6.4. Recent Developments
- 11.2.6.5. Financials (Based on Availability)
- 11.2.7 SiteOne Therapeutics
- 11.2.7.1. Overview
- 11.2.7.2. Products
- 11.2.7.3. SWOT Analysis
- 11.2.7.4. Recent Developments
- 11.2.7.5. Financials (Based on Availability)
- 11.2.8 Pfizer Inc
- 11.2.8.1. Overview
- 11.2.8.2. Products
- 11.2.8.3. SWOT Analysis
- 11.2.8.4. Recent Developments
- 11.2.8.5. Financials (Based on Availability)
- 11.2.9 Haleon PLC (GSK)
- 11.2.9.1. Overview
- 11.2.9.2. Products
- 11.2.9.3. SWOT Analysis
- 11.2.9.4. Recent Developments
- 11.2.9.5. Financials (Based on Availability)
- 11.2.10 AbbVie (Allergan)
- 11.2.10.1. Overview
- 11.2.10.2. Products
- 11.2.10.3. SWOT Analysis
- 11.2.10.4. Recent Developments
- 11.2.10.5. Financials (Based on Availability)
- 11.2.11 Cipla Inc (InvaGen Pharmaceuticals Inc )
- 11.2.11.1. Overview
- 11.2.11.2. Products
- 11.2.11.3. SWOT Analysis
- 11.2.11.4. Recent Developments
- 11.2.11.5. Financials (Based on Availability)
- 11.2.12 Heron Therapeutics
- 11.2.12.1. Overview
- 11.2.12.2. Products
- 11.2.12.3. SWOT Analysis
- 11.2.12.4. Recent Developments
- 11.2.12.5. Financials (Based on Availability)
- 11.2.13 Pacira Pharmaceuticals Inc
- 11.2.13.1. Overview
- 11.2.13.2. Products
- 11.2.13.3. SWOT Analysis
- 11.2.13.4. Recent Developments
- 11.2.13.5. Financials (Based on Availability)
- 11.2.1 Innocoll
List of Figures
- Figure 1: Global Postoperative Pain Medication Industry Revenue Breakdown (Million, %) by Region 2025 & 2033
- Figure 2: Global Postoperative Pain Medication Industry Volume Breakdown (K Unit, %) by Region 2025 & 2033
- Figure 3: North America Postoperative Pain Medication Industry Revenue (Million), by Drug Class 2025 & 2033
- Figure 4: North America Postoperative Pain Medication Industry Volume (K Unit), by Drug Class 2025 & 2033
- Figure 5: North America Postoperative Pain Medication Industry Revenue Share (%), by Drug Class 2025 & 2033
- Figure 6: North America Postoperative Pain Medication Industry Volume Share (%), by Drug Class 2025 & 2033
- Figure 7: North America Postoperative Pain Medication Industry Revenue (Million), by Route of Administration 2025 & 2033
- Figure 8: North America Postoperative Pain Medication Industry Volume (K Unit), by Route of Administration 2025 & 2033
- Figure 9: North America Postoperative Pain Medication Industry Revenue Share (%), by Route of Administration 2025 & 2033
- Figure 10: North America Postoperative Pain Medication Industry Volume Share (%), by Route of Administration 2025 & 2033
- Figure 11: North America Postoperative Pain Medication Industry Revenue (Million), by Distribution Channel 2025 & 2033
- Figure 12: North America Postoperative Pain Medication Industry Volume (K Unit), by Distribution Channel 2025 & 2033
- Figure 13: North America Postoperative Pain Medication Industry Revenue Share (%), by Distribution Channel 2025 & 2033
- Figure 14: North America Postoperative Pain Medication Industry Volume Share (%), by Distribution Channel 2025 & 2033
- Figure 15: North America Postoperative Pain Medication Industry Revenue (Million), by Country 2025 & 2033
- Figure 16: North America Postoperative Pain Medication Industry Volume (K Unit), by Country 2025 & 2033
- Figure 17: North America Postoperative Pain Medication Industry Revenue Share (%), by Country 2025 & 2033
- Figure 18: North America Postoperative Pain Medication Industry Volume Share (%), by Country 2025 & 2033
- Figure 19: Europe Postoperative Pain Medication Industry Revenue (Million), by Drug Class 2025 & 2033
- Figure 20: Europe Postoperative Pain Medication Industry Volume (K Unit), by Drug Class 2025 & 2033
- Figure 21: Europe Postoperative Pain Medication Industry Revenue Share (%), by Drug Class 2025 & 2033
- Figure 22: Europe Postoperative Pain Medication Industry Volume Share (%), by Drug Class 2025 & 2033
- Figure 23: Europe Postoperative Pain Medication Industry Revenue (Million), by Route of Administration 2025 & 2033
- Figure 24: Europe Postoperative Pain Medication Industry Volume (K Unit), by Route of Administration 2025 & 2033
- Figure 25: Europe Postoperative Pain Medication Industry Revenue Share (%), by Route of Administration 2025 & 2033
- Figure 26: Europe Postoperative Pain Medication Industry Volume Share (%), by Route of Administration 2025 & 2033
- Figure 27: Europe Postoperative Pain Medication Industry Revenue (Million), by Distribution Channel 2025 & 2033
- Figure 28: Europe Postoperative Pain Medication Industry Volume (K Unit), by Distribution Channel 2025 & 2033
- Figure 29: Europe Postoperative Pain Medication Industry Revenue Share (%), by Distribution Channel 2025 & 2033
- Figure 30: Europe Postoperative Pain Medication Industry Volume Share (%), by Distribution Channel 2025 & 2033
- Figure 31: Europe Postoperative Pain Medication Industry Revenue (Million), by Country 2025 & 2033
- Figure 32: Europe Postoperative Pain Medication Industry Volume (K Unit), by Country 2025 & 2033
- Figure 33: Europe Postoperative Pain Medication Industry Revenue Share (%), by Country 2025 & 2033
- Figure 34: Europe Postoperative Pain Medication Industry Volume Share (%), by Country 2025 & 2033
- Figure 35: Asia Pacific Postoperative Pain Medication Industry Revenue (Million), by Drug Class 2025 & 2033
- Figure 36: Asia Pacific Postoperative Pain Medication Industry Volume (K Unit), by Drug Class 2025 & 2033
- Figure 37: Asia Pacific Postoperative Pain Medication Industry Revenue Share (%), by Drug Class 2025 & 2033
- Figure 38: Asia Pacific Postoperative Pain Medication Industry Volume Share (%), by Drug Class 2025 & 2033
- Figure 39: Asia Pacific Postoperative Pain Medication Industry Revenue (Million), by Route of Administration 2025 & 2033
- Figure 40: Asia Pacific Postoperative Pain Medication Industry Volume (K Unit), by Route of Administration 2025 & 2033
- Figure 41: Asia Pacific Postoperative Pain Medication Industry Revenue Share (%), by Route of Administration 2025 & 2033
- Figure 42: Asia Pacific Postoperative Pain Medication Industry Volume Share (%), by Route of Administration 2025 & 2033
- Figure 43: Asia Pacific Postoperative Pain Medication Industry Revenue (Million), by Distribution Channel 2025 & 2033
- Figure 44: Asia Pacific Postoperative Pain Medication Industry Volume (K Unit), by Distribution Channel 2025 & 2033
- Figure 45: Asia Pacific Postoperative Pain Medication Industry Revenue Share (%), by Distribution Channel 2025 & 2033
- Figure 46: Asia Pacific Postoperative Pain Medication Industry Volume Share (%), by Distribution Channel 2025 & 2033
- Figure 47: Asia Pacific Postoperative Pain Medication Industry Revenue (Million), by Country 2025 & 2033
- Figure 48: Asia Pacific Postoperative Pain Medication Industry Volume (K Unit), by Country 2025 & 2033
- Figure 49: Asia Pacific Postoperative Pain Medication Industry Revenue Share (%), by Country 2025 & 2033
- Figure 50: Asia Pacific Postoperative Pain Medication Industry Volume Share (%), by Country 2025 & 2033
- Figure 51: Middle East and Africa Postoperative Pain Medication Industry Revenue (Million), by Drug Class 2025 & 2033
- Figure 52: Middle East and Africa Postoperative Pain Medication Industry Volume (K Unit), by Drug Class 2025 & 2033
- Figure 53: Middle East and Africa Postoperative Pain Medication Industry Revenue Share (%), by Drug Class 2025 & 2033
- Figure 54: Middle East and Africa Postoperative Pain Medication Industry Volume Share (%), by Drug Class 2025 & 2033
- Figure 55: Middle East and Africa Postoperative Pain Medication Industry Revenue (Million), by Route of Administration 2025 & 2033
- Figure 56: Middle East and Africa Postoperative Pain Medication Industry Volume (K Unit), by Route of Administration 2025 & 2033
- Figure 57: Middle East and Africa Postoperative Pain Medication Industry Revenue Share (%), by Route of Administration 2025 & 2033
- Figure 58: Middle East and Africa Postoperative Pain Medication Industry Volume Share (%), by Route of Administration 2025 & 2033
- Figure 59: Middle East and Africa Postoperative Pain Medication Industry Revenue (Million), by Distribution Channel 2025 & 2033
- Figure 60: Middle East and Africa Postoperative Pain Medication Industry Volume (K Unit), by Distribution Channel 2025 & 2033
- Figure 61: Middle East and Africa Postoperative Pain Medication Industry Revenue Share (%), by Distribution Channel 2025 & 2033
- Figure 62: Middle East and Africa Postoperative Pain Medication Industry Volume Share (%), by Distribution Channel 2025 & 2033
- Figure 63: Middle East and Africa Postoperative Pain Medication Industry Revenue (Million), by Country 2025 & 2033
- Figure 64: Middle East and Africa Postoperative Pain Medication Industry Volume (K Unit), by Country 2025 & 2033
- Figure 65: Middle East and Africa Postoperative Pain Medication Industry Revenue Share (%), by Country 2025 & 2033
- Figure 66: Middle East and Africa Postoperative Pain Medication Industry Volume Share (%), by Country 2025 & 2033
- Figure 67: South America Postoperative Pain Medication Industry Revenue (Million), by Drug Class 2025 & 2033
- Figure 68: South America Postoperative Pain Medication Industry Volume (K Unit), by Drug Class 2025 & 2033
- Figure 69: South America Postoperative Pain Medication Industry Revenue Share (%), by Drug Class 2025 & 2033
- Figure 70: South America Postoperative Pain Medication Industry Volume Share (%), by Drug Class 2025 & 2033
- Figure 71: South America Postoperative Pain Medication Industry Revenue (Million), by Route of Administration 2025 & 2033
- Figure 72: South America Postoperative Pain Medication Industry Volume (K Unit), by Route of Administration 2025 & 2033
- Figure 73: South America Postoperative Pain Medication Industry Revenue Share (%), by Route of Administration 2025 & 2033
- Figure 74: South America Postoperative Pain Medication Industry Volume Share (%), by Route of Administration 2025 & 2033
- Figure 75: South America Postoperative Pain Medication Industry Revenue (Million), by Distribution Channel 2025 & 2033
- Figure 76: South America Postoperative Pain Medication Industry Volume (K Unit), by Distribution Channel 2025 & 2033
- Figure 77: South America Postoperative Pain Medication Industry Revenue Share (%), by Distribution Channel 2025 & 2033
- Figure 78: South America Postoperative Pain Medication Industry Volume Share (%), by Distribution Channel 2025 & 2033
- Figure 79: South America Postoperative Pain Medication Industry Revenue (Million), by Country 2025 & 2033
- Figure 80: South America Postoperative Pain Medication Industry Volume (K Unit), by Country 2025 & 2033
- Figure 81: South America Postoperative Pain Medication Industry Revenue Share (%), by Country 2025 & 2033
- Figure 82: South America Postoperative Pain Medication Industry Volume Share (%), by Country 2025 & 2033
List of Tables
- Table 1: Global Postoperative Pain Medication Industry Revenue Million Forecast, by Drug Class 2020 & 2033
- Table 2: Global Postoperative Pain Medication Industry Volume K Unit Forecast, by Drug Class 2020 & 2033
- Table 3: Global Postoperative Pain Medication Industry Revenue Million Forecast, by Route of Administration 2020 & 2033
- Table 4: Global Postoperative Pain Medication Industry Volume K Unit Forecast, by Route of Administration 2020 & 2033
- Table 5: Global Postoperative Pain Medication Industry Revenue Million Forecast, by Distribution Channel 2020 & 2033
- Table 6: Global Postoperative Pain Medication Industry Volume K Unit Forecast, by Distribution Channel 2020 & 2033
- Table 7: Global Postoperative Pain Medication Industry Revenue Million Forecast, by Region 2020 & 2033
- Table 8: Global Postoperative Pain Medication Industry Volume K Unit Forecast, by Region 2020 & 2033
- Table 9: Global Postoperative Pain Medication Industry Revenue Million Forecast, by Drug Class 2020 & 2033
- Table 10: Global Postoperative Pain Medication Industry Volume K Unit Forecast, by Drug Class 2020 & 2033
- Table 11: Global Postoperative Pain Medication Industry Revenue Million Forecast, by Route of Administration 2020 & 2033
- Table 12: Global Postoperative Pain Medication Industry Volume K Unit Forecast, by Route of Administration 2020 & 2033
- Table 13: Global Postoperative Pain Medication Industry Revenue Million Forecast, by Distribution Channel 2020 & 2033
- Table 14: Global Postoperative Pain Medication Industry Volume K Unit Forecast, by Distribution Channel 2020 & 2033
- Table 15: Global Postoperative Pain Medication Industry Revenue Million Forecast, by Country 2020 & 2033
- Table 16: Global Postoperative Pain Medication Industry Volume K Unit Forecast, by Country 2020 & 2033
- Table 17: United States Postoperative Pain Medication Industry Revenue (Million) Forecast, by Application 2020 & 2033
- Table 18: United States Postoperative Pain Medication Industry Volume (K Unit) Forecast, by Application 2020 & 2033
- Table 19: Canada Postoperative Pain Medication Industry Revenue (Million) Forecast, by Application 2020 & 2033
- Table 20: Canada Postoperative Pain Medication Industry Volume (K Unit) Forecast, by Application 2020 & 2033
- Table 21: Mexico Postoperative Pain Medication Industry Revenue (Million) Forecast, by Application 2020 & 2033
- Table 22: Mexico Postoperative Pain Medication Industry Volume (K Unit) Forecast, by Application 2020 & 2033
- Table 23: Global Postoperative Pain Medication Industry Revenue Million Forecast, by Drug Class 2020 & 2033
- Table 24: Global Postoperative Pain Medication Industry Volume K Unit Forecast, by Drug Class 2020 & 2033
- Table 25: Global Postoperative Pain Medication Industry Revenue Million Forecast, by Route of Administration 2020 & 2033
- Table 26: Global Postoperative Pain Medication Industry Volume K Unit Forecast, by Route of Administration 2020 & 2033
- Table 27: Global Postoperative Pain Medication Industry Revenue Million Forecast, by Distribution Channel 2020 & 2033
- Table 28: Global Postoperative Pain Medication Industry Volume K Unit Forecast, by Distribution Channel 2020 & 2033
- Table 29: Global Postoperative Pain Medication Industry Revenue Million Forecast, by Country 2020 & 2033
- Table 30: Global Postoperative Pain Medication Industry Volume K Unit Forecast, by Country 2020 & 2033
- Table 31: Germany Postoperative Pain Medication Industry Revenue (Million) Forecast, by Application 2020 & 2033
- Table 32: Germany Postoperative Pain Medication Industry Volume (K Unit) Forecast, by Application 2020 & 2033
- Table 33: United Kingdom Postoperative Pain Medication Industry Revenue (Million) Forecast, by Application 2020 & 2033
- Table 34: United Kingdom Postoperative Pain Medication Industry Volume (K Unit) Forecast, by Application 2020 & 2033
- Table 35: France Postoperative Pain Medication Industry Revenue (Million) Forecast, by Application 2020 & 2033
- Table 36: France Postoperative Pain Medication Industry Volume (K Unit) Forecast, by Application 2020 & 2033
- Table 37: Italy Postoperative Pain Medication Industry Revenue (Million) Forecast, by Application 2020 & 2033
- Table 38: Italy Postoperative Pain Medication Industry Volume (K Unit) Forecast, by Application 2020 & 2033
- Table 39: Spain Postoperative Pain Medication Industry Revenue (Million) Forecast, by Application 2020 & 2033
- Table 40: Spain Postoperative Pain Medication Industry Volume (K Unit) Forecast, by Application 2020 & 2033
- Table 41: Rest of Europe Postoperative Pain Medication Industry Revenue (Million) Forecast, by Application 2020 & 2033
- Table 42: Rest of Europe Postoperative Pain Medication Industry Volume (K Unit) Forecast, by Application 2020 & 2033
- Table 43: Global Postoperative Pain Medication Industry Revenue Million Forecast, by Drug Class 2020 & 2033
- Table 44: Global Postoperative Pain Medication Industry Volume K Unit Forecast, by Drug Class 2020 & 2033
- Table 45: Global Postoperative Pain Medication Industry Revenue Million Forecast, by Route of Administration 2020 & 2033
- Table 46: Global Postoperative Pain Medication Industry Volume K Unit Forecast, by Route of Administration 2020 & 2033
- Table 47: Global Postoperative Pain Medication Industry Revenue Million Forecast, by Distribution Channel 2020 & 2033
- Table 48: Global Postoperative Pain Medication Industry Volume K Unit Forecast, by Distribution Channel 2020 & 2033
- Table 49: Global Postoperative Pain Medication Industry Revenue Million Forecast, by Country 2020 & 2033
- Table 50: Global Postoperative Pain Medication Industry Volume K Unit Forecast, by Country 2020 & 2033
- Table 51: China Postoperative Pain Medication Industry Revenue (Million) Forecast, by Application 2020 & 2033
- Table 52: China Postoperative Pain Medication Industry Volume (K Unit) Forecast, by Application 2020 & 2033
- Table 53: Japan Postoperative Pain Medication Industry Revenue (Million) Forecast, by Application 2020 & 2033
- Table 54: Japan Postoperative Pain Medication Industry Volume (K Unit) Forecast, by Application 2020 & 2033
- Table 55: India Postoperative Pain Medication Industry Revenue (Million) Forecast, by Application 2020 & 2033
- Table 56: India Postoperative Pain Medication Industry Volume (K Unit) Forecast, by Application 2020 & 2033
- Table 57: Australia Postoperative Pain Medication Industry Revenue (Million) Forecast, by Application 2020 & 2033
- Table 58: Australia Postoperative Pain Medication Industry Volume (K Unit) Forecast, by Application 2020 & 2033
- Table 59: South Korea Postoperative Pain Medication Industry Revenue (Million) Forecast, by Application 2020 & 2033
- Table 60: South Korea Postoperative Pain Medication Industry Volume (K Unit) Forecast, by Application 2020 & 2033
- Table 61: Rest of Asia Pacific Postoperative Pain Medication Industry Revenue (Million) Forecast, by Application 2020 & 2033
- Table 62: Rest of Asia Pacific Postoperative Pain Medication Industry Volume (K Unit) Forecast, by Application 2020 & 2033
- Table 63: Global Postoperative Pain Medication Industry Revenue Million Forecast, by Drug Class 2020 & 2033
- Table 64: Global Postoperative Pain Medication Industry Volume K Unit Forecast, by Drug Class 2020 & 2033
- Table 65: Global Postoperative Pain Medication Industry Revenue Million Forecast, by Route of Administration 2020 & 2033
- Table 66: Global Postoperative Pain Medication Industry Volume K Unit Forecast, by Route of Administration 2020 & 2033
- Table 67: Global Postoperative Pain Medication Industry Revenue Million Forecast, by Distribution Channel 2020 & 2033
- Table 68: Global Postoperative Pain Medication Industry Volume K Unit Forecast, by Distribution Channel 2020 & 2033
- Table 69: Global Postoperative Pain Medication Industry Revenue Million Forecast, by Country 2020 & 2033
- Table 70: Global Postoperative Pain Medication Industry Volume K Unit Forecast, by Country 2020 & 2033
- Table 71: GCC Postoperative Pain Medication Industry Revenue (Million) Forecast, by Application 2020 & 2033
- Table 72: GCC Postoperative Pain Medication Industry Volume (K Unit) Forecast, by Application 2020 & 2033
- Table 73: South Africa Postoperative Pain Medication Industry Revenue (Million) Forecast, by Application 2020 & 2033
- Table 74: South Africa Postoperative Pain Medication Industry Volume (K Unit) Forecast, by Application 2020 & 2033
- Table 75: Rest of Middle East and Africa Postoperative Pain Medication Industry Revenue (Million) Forecast, by Application 2020 & 2033
- Table 76: Rest of Middle East and Africa Postoperative Pain Medication Industry Volume (K Unit) Forecast, by Application 2020 & 2033
- Table 77: Global Postoperative Pain Medication Industry Revenue Million Forecast, by Drug Class 2020 & 2033
- Table 78: Global Postoperative Pain Medication Industry Volume K Unit Forecast, by Drug Class 2020 & 2033
- Table 79: Global Postoperative Pain Medication Industry Revenue Million Forecast, by Route of Administration 2020 & 2033
- Table 80: Global Postoperative Pain Medication Industry Volume K Unit Forecast, by Route of Administration 2020 & 2033
- Table 81: Global Postoperative Pain Medication Industry Revenue Million Forecast, by Distribution Channel 2020 & 2033
- Table 82: Global Postoperative Pain Medication Industry Volume K Unit Forecast, by Distribution Channel 2020 & 2033
- Table 83: Global Postoperative Pain Medication Industry Revenue Million Forecast, by Country 2020 & 2033
- Table 84: Global Postoperative Pain Medication Industry Volume K Unit Forecast, by Country 2020 & 2033
- Table 85: Brazil Postoperative Pain Medication Industry Revenue (Million) Forecast, by Application 2020 & 2033
- Table 86: Brazil Postoperative Pain Medication Industry Volume (K Unit) Forecast, by Application 2020 & 2033
- Table 87: Argentina Postoperative Pain Medication Industry Revenue (Million) Forecast, by Application 2020 & 2033
- Table 88: Argentina Postoperative Pain Medication Industry Volume (K Unit) Forecast, by Application 2020 & 2033
- Table 89: Rest of South America Postoperative Pain Medication Industry Revenue (Million) Forecast, by Application 2020 & 2033
- Table 90: Rest of South America Postoperative Pain Medication Industry Volume (K Unit) Forecast, by Application 2020 & 2033
Frequently Asked Questions
1. What is the projected Compound Annual Growth Rate (CAGR) of the Postoperative Pain Medication Industry?
The projected CAGR is approximately 5.79%.
2. Which companies are prominent players in the Postoperative Pain Medication Industry?
Key companies in the market include Innocoll, Bayer AG, Johnson & Johnson (Janssen Pharmaceuticals), Cali Biosciences, Alembic Pharmaceuticals, AFT Pharmaceuticals, SiteOne Therapeutics, Pfizer Inc , Haleon PLC (GSK), AbbVie (Allergan), Cipla Inc (InvaGen Pharmaceuticals Inc ), Heron Therapeutics, Pacira Pharmaceuticals Inc.
3. What are the main segments of the Postoperative Pain Medication Industry?
The market segments include Drug Class, Route of Administration, Distribution Channel.
4. Can you provide details about the market size?
The market size is estimated to be USD 40.46 Million as of 2022.
5. What are some drivers contributing to market growth?
Growing Number of Surgical Procedures; Increasing Demand for Non-Opioid Based Anaelgesics; Increasing Focus Towards Palliative Care.
6. What are the notable trends driving market growth?
Non-steroidal anti-inflammatory drugs (NSAIDs) Segment is Expected to Hold a Significant Share in the Postoperative Pain Management Market.
7. Are there any restraints impacting market growth?
Concerns Pertaining to the Overuse of Opioids.
8. Can you provide examples of recent developments in the market?
April 2023: Cali Biosciences Co., Ltd. initiated Phase III studies of its core product, CPL-01 (long-acting ropivacaine), with dosing in hernia patients already begun and dosing in bunion patients scheduled to start next month.
9. What pricing options are available for accessing the report?
Pricing options include single-user, multi-user, and enterprise licenses priced at USD 4750, USD 5250, and USD 8750 respectively.
10. Is the market size provided in terms of value or volume?
The market size is provided in terms of value, measured in Million and volume, measured in K Unit.
11. Are there any specific market keywords associated with the report?
Yes, the market keyword associated with the report is "Postoperative Pain Medication Industry," which aids in identifying and referencing the specific market segment covered.
12. How do I determine which pricing option suits my needs best?
The pricing options vary based on user requirements and access needs. Individual users may opt for single-user licenses, while businesses requiring broader access may choose multi-user or enterprise licenses for cost-effective access to the report.
13. Are there any additional resources or data provided in the Postoperative Pain Medication Industry report?
While the report offers comprehensive insights, it's advisable to review the specific contents or supplementary materials provided to ascertain if additional resources or data are available.
14. How can I stay updated on further developments or reports in the Postoperative Pain Medication Industry?
To stay informed about further developments, trends, and reports in the Postoperative Pain Medication Industry, consider subscribing to industry newsletters, following relevant companies and organizations, or regularly checking reputable industry news sources and publications.
Methodology
Step 1 - Identification of Relevant Samples Size from Population Database


Step 2 - Approaches for Defining Global Market Size (Value, Volume* & Price*)

Note*: In applicable scenarios
Step 3 - Data Sources
Primary Research
- Web Analytics
- Survey Reports
- Research Institute
- Latest Research Reports
- Opinion Leaders
Secondary Research
- Annual Reports
- White Paper
- Latest Press Release
- Industry Association
- Paid Database
- Investor Presentations

Step 4 - Data Triangulation
Involves using different sources of information in order to increase the validity of a study
These sources are likely to be stakeholders in a program - participants, other researchers, program staff, other community members, and so on.
Then we put all data in single framework & apply various statistical tools to find out the dynamic on the market.
During the analysis stage, feedback from the stakeholder groups would be compared to determine areas of agreement as well as areas of divergence

