


Key Insights
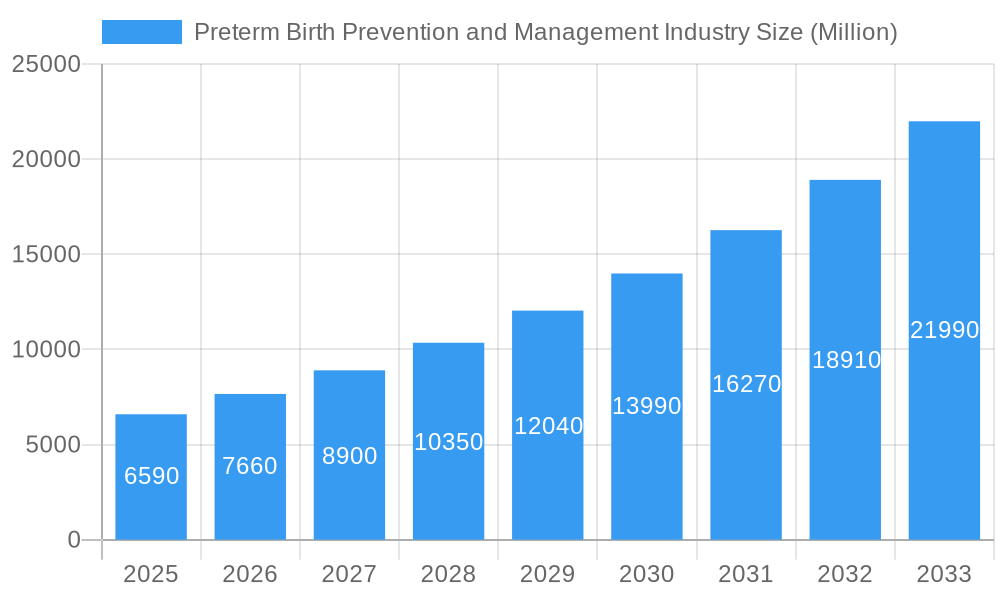
The Preterm Birth Prevention and Management market is poised for significant expansion, projected to reach USD 6.59 billion in 2025 with a robust CAGR of 16.02% through 2033. This impressive growth is fueled by a confluence of factors, including increasing awareness surrounding the long-term health implications of preterm birth, advancements in prenatal care technologies, and a rising incidence of prematurity globally. The escalating prevalence of maternal risk factors such as advanced maternal age, multiple pregnancies, and chronic health conditions like diabetes and hypertension directly contributes to the demand for effective prevention and management strategies. Furthermore, substantial investments in research and development by leading pharmaceutical companies are yielding innovative therapeutic solutions, including advanced tocolytics, corticosteroids for lung maturation, and novel progesterone therapies. Growing healthcare expenditure, particularly in developed economies, and the expansion of access to specialized maternal healthcare services further bolster market growth. The focus on reducing neonatal mortality and morbidity rates associated with preterm birth is also a critical driver, encouraging greater adoption of preventative measures and management protocols.
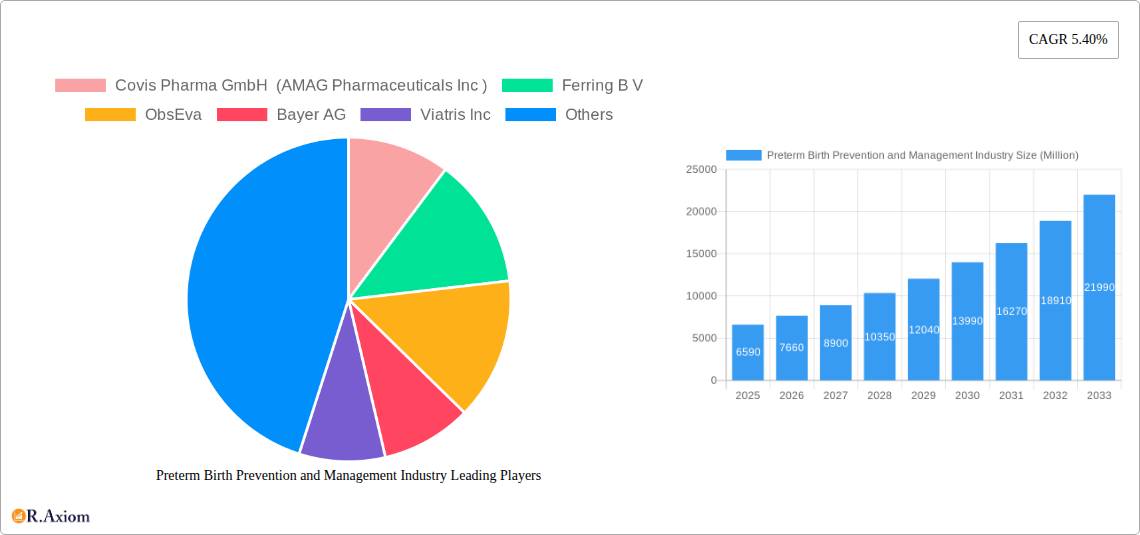
Preterm Birth Prevention and Management Industry Market Size (In Billion)

The market's trajectory is further shaped by evolving treatment paradigms and market segmentation. Progesterone therapy, recognized for its efficacy in preventing recurrent preterm birth, continues to be a cornerstone of treatment. Corticosteroids remain crucial for accelerating fetal lung development in cases where preterm birth is imminent. The market is also witnessing increased innovation in tocolytics aimed at delaying birth and allowing for the administration of other essential treatments. Distribution channels like hospital pharmacies are expected to dominate due to the critical nature of preterm birth management, while the growing outpatient care infrastructure will see a rise in demand through retail pharmacies. Regionally, North America and Europe are expected to lead the market due to advanced healthcare infrastructure and high patient awareness. However, the Asia Pacific region presents a significant growth opportunity, driven by increasing healthcare investments and a large at-risk population. Despite the positive outlook, challenges such as the high cost of certain advanced therapies and the need for greater accessibility in low-income regions may temper the growth in specific segments.
Preterm Birth Prevention and Management Industry Company Market Share
This in-depth report provides a comprehensive analysis of the global Preterm Birth Prevention and Management Industry, encompassing market dynamics, trends, growth drivers, challenges, and opportunities from 2019 to 2033, with a base year of 2025. Delve into key segments including Therapy Type (Progesterone Therapy, Corticosteroid Therapy, Tocolytics Therapy, Antibiotics Therapy, Heparin Profylaxis Therapy, Others), Route of Administration (Oral, Parenteral, Vaginal), and Distribution Channel (Hospital Pharmacies, Retail Pharmacies, Others). This report is essential for pharmaceutical companies, healthcare providers, researchers, investors, and policymakers seeking to understand and navigate the evolving preterm birth landscape.
Preterm Birth Prevention and Management Industry Market Concentration & Innovation
The Preterm Birth Prevention and Management Industry exhibits a moderate level of market concentration, with a few dominant players holding significant market share in key therapeutic areas. In 2025, the market is projected to reach over $20 billion, with Progesterone Therapy accounting for approximately 35% of this value, driven by its established efficacy and increasing adoption. Innovation is a critical driver, fueled by ongoing research into novel pharmacological interventions and advanced diagnostic tools. Regulatory frameworks, while stringent, are increasingly accommodating of innovative therapies aimed at reducing preterm birth rates, which impact over 15 million infants annually. Product substitutes, while present, often lack the specific efficacy and safety profiles of established treatments. End-user trends are shifting towards personalized medicine and early intervention strategies, further pushing innovation. Merger and acquisition (M&A) activities, though not currently at peak levels, are anticipated to increase as companies seek to consolidate market positions and acquire promising new technologies. For instance, potential M&A deal values could exceed $2 billion in the forecast period as larger players look to expand their portfolios.
- Key Innovation Drivers:
- Development of novel tocolytic agents with improved safety profiles.
- Advancements in personalized medicine to identify high-risk pregnancies.
- Research into biomarkers for early detection of preterm labor.
- Development of advanced drug delivery systems for enhanced therapeutic efficacy.
- Regulatory Landscape:
- Strict clinical trial requirements for efficacy and safety.
- Focus on post-market surveillance and pharmacovigilance.
- Streamlined approval pathways for drugs addressing critical unmet needs.
- Market Share Dynamics (Estimated 2025):
- Progesterone Therapy: ~35%
- Corticosteroid Therapy: ~25%
- Tocolytics Therapy: ~20%
- Antibiotics Therapy: ~15%
- Heparin Profylaxis Therapy & Others: ~5%
Preterm Birth Prevention and Management Industry Industry Trends & Insights
The global Preterm Birth Prevention and Management Industry is poised for substantial growth, driven by a confluence of escalating healthcare expenditure, increasing awareness of the long-term health consequences of preterm birth, and significant advancements in medical research and technology. The Compound Annual Growth Rate (CAGR) is projected to be robust, estimated at over 7% from 2025 to 2033, leading to a market size exceeding $35 billion by the end of the forecast period. Technological disruptions, such as the integration of artificial intelligence (AI) in predictive diagnostics and drug discovery, are revolutionizing how preterm birth is anticipated and managed. Consumer preferences are increasingly leaning towards evidence-based, minimally invasive treatments with fewer side effects, influencing product development and market strategies. The competitive dynamics are characterized by intense R&D efforts, strategic partnerships, and a growing emphasis on expanding access to effective interventions across diverse socioeconomic populations. Market penetration of advanced therapies is expected to rise, particularly in developed economies, while emerging markets present significant growth opportunities due to improving healthcare infrastructure and increasing demand for specialized obstetric care. The rising incidence of preterm births, linked to factors such as advanced maternal age, multiple pregnancies, and lifestyle choices, further fuels the demand for effective prevention and management solutions. Pharmaceutical companies are investing heavily in exploring new therapeutic targets, including epigenetic modifications and immunomodulatory agents, to address the complex multifactorial nature of preterm labor. The development of more targeted and effective antibiotics for managing intra-amniotic infections, a key contributor to preterm birth, also represents a significant trend. Furthermore, the increasing focus on maternal and child health by governmental and non-governmental organizations worldwide is creating a supportive environment for market expansion. The adoption of telehealth and remote monitoring technologies is also gaining traction, enabling continuous patient observation and timely intervention, which is crucial in managing high-risk pregnancies.
Dominant Markets & Segments in Preterm Birth Prevention and Management Industry
The Preterm Birth Prevention and Management Industry is experiencing significant dominance in North America and Europe, driven by advanced healthcare infrastructure, high disposable incomes, and robust research and development activities. In 2025, North America is estimated to hold a market share of over 35%, with the United States leading due to its well-established pharmaceutical market and significant investment in maternal health initiatives.
Therapy Type Dominance:
- Progesterone Therapy: This segment is a dominant force, projected to capture over 35% of the market share in 2025. The widespread availability of various progesterone formulations, coupled with strong clinical evidence supporting its efficacy in preventing recurrent preterm birth, drives its market leadership. Key drivers include ongoing research into optimal dosing and delivery methods, as well as increasing physician and patient acceptance.
- Corticosteroid Therapy: A significant segment, accounting for approximately 25% of the market. These therapies are crucial for accelerating fetal lung maturity in anticipated preterm births, reducing respiratory distress syndrome. The demand is driven by their proven life-saving benefits and integration into standard obstetric protocols.
- Tocolytics Therapy: Holding around 20% of the market, tocolytics play a vital role in delaying preterm labor, allowing for the administration of corticosteroids and transfer to specialized care centers. The development of newer agents with improved efficacy and reduced maternal side effects is a key growth factor.
- Antibiotics Therapy: This segment, representing about 15% of the market, is essential for managing infections that can precipitate preterm labor, such as chorioamnionitis. The emergence of antibiotic-resistant bacteria necessitates continuous innovation in this area.
- Heparin Profylaxis Therapy & Others: These segments, collectively around 5%, address specific prophylactic measures and emerging treatments, showing potential for growth as research uncovers new therapeutic avenues.
Route of Administration Dominance:
- Parenteral: This route, encompassing intravenous and intramuscular injections, currently dominates due to its rapid onset of action and high bioavailability, particularly for tocolytics and certain progesterone formulations. The market penetration is driven by the critical need for immediate therapeutic effects in emergency situations.
- Vaginal: Gaining traction for progesterone therapy, offering a more localized and potentially safer administration route with fewer systemic side effects.
- Oral: While less dominant for acute management, oral formulations are increasingly being developed and utilized for long-term prevention strategies, offering convenience and improved patient compliance.
Distribution Channel Dominance:
- Hospital Pharmacies: These are the primary distribution channels, reflecting the critical care nature of preterm birth management and the immediate need for medications within healthcare facilities. Their dominance is driven by direct patient access and integrated healthcare systems.
- Retail Pharmacies: Growing in importance for long-term management therapies and outpatient prescriptions, offering accessibility and convenience to patients.
- Others: This category includes specialty pharmacies and direct-to-patient programs, which are expected to see expansion with advancements in home healthcare services.
Preterm Birth Prevention and Management Industry Product Developments
Recent product developments in the Preterm Birth Prevention and Management Industry are focused on enhancing efficacy, improving safety profiles, and enabling more convenient administration. Innovations include extended-release formulations of progesterone to ensure consistent therapeutic levels, novel tocolytic agents with fewer cardiovascular side effects, and advanced antibiotic combinations to combat resistant infections. Pharmaceutical companies are also exploring non-pharmacological interventions and diagnostic tools for early risk stratification. These developments aim to provide more personalized and effective management strategies, ultimately reducing the incidence and complications of preterm birth. Competitive advantages are being gained through superior pharmacokinetic profiles, reduced adverse event rates, and improved patient adherence.
Report Scope & Segmentation Analysis
This report meticulously segments the Preterm Birth Prevention and Management Industry based on key parameters to provide a granular market view.
- Therapy Type: The market is analyzed across Progesterone Therapy, Corticosteroid Therapy, Tocolytics Therapy, Antibiotics Therapy, Heparin Profylaxis Therapy, and Other therapeutic approaches. Each segment is assessed for its market size, growth projections, and competitive dynamics, with Progesterone Therapy expected to maintain its leading position due to ongoing research and established efficacy.
- Route of Administration: Segmentation by Oral, Parenteral, and Vaginal routes of administration highlights the evolving preferences and technological advancements in drug delivery. Parenteral administration currently leads, but the vaginal route is gaining prominence for progesterone, offering improved patient comfort and safety.
- Distribution Channel: The analysis includes Hospital Pharmacies, Retail Pharmacies, and Other channels. Hospital pharmacies remain dominant due to the critical care nature of preterm birth management, while retail pharmacies are expected to see increased engagement for chronic and long-term treatment regimens.
Key Drivers of Preterm Birth Prevention and Management Industry Growth
The growth of the Preterm Birth Prevention and Management Industry is propelled by several interconnected factors. Increasing global awareness of the adverse long-term health and economic consequences of preterm birth is a significant driver, prompting greater investment in research and development. Advancements in medical technology, including sophisticated diagnostic tools for early detection and prediction of preterm labor, are enhancing preventive strategies. Furthermore, rising healthcare expenditure, particularly in emerging economies, coupled with improving access to quality maternal healthcare services, is expanding the market reach. Regulatory bodies are also showing increased support for innovative therapies that address this critical unmet medical need.
- Technological Advancements: Improved diagnostic tools, AI-driven risk prediction models.
- Economic Factors: Rising healthcare spending, increased disposable incomes in developing nations.
- Regulatory Support: Streamlined approval processes for effective preterm birth interventions.
- Awareness Campaigns: Growing public and governmental focus on maternal and child health.
Challenges in the Preterm Birth Prevention and Management Industry Sector
Despite its growth potential, the Preterm Birth Prevention and Management Industry faces several significant challenges. The complex multifactorial etiology of preterm birth makes developing universally effective preventative strategies difficult. Stringent regulatory approval processes, while essential for patient safety, can prolong the time to market for new therapies and increase development costs. The high cost of advanced treatments can also limit accessibility, particularly in low-resource settings, creating disparities in care. Moreover, the potential for adverse side effects associated with some existing treatments necessitates continuous research for safer alternatives. Supply chain disruptions and the threat of antibiotic resistance also pose ongoing concerns.
- Complex Etiology: Multifactorial causes of preterm birth pose treatment challenges.
- Regulatory Hurdles: Lengthy and costly approval processes for new drugs.
- Accessibility and Cost: High treatment costs limiting patient access in certain regions.
- Adverse Side Effects: Need for safer and better-tolerated therapeutic options.
- Supply Chain Vulnerabilities: Potential for disruptions in drug availability.
Emerging Opportunities in Preterm Birth Prevention and Management Industry
The Preterm Birth Prevention and Management Industry is ripe with emerging opportunities driven by ongoing scientific discoveries and evolving healthcare paradigms. The development of precision medicine approaches, utilizing genetic and epigenetic markers to identify high-risk pregnancies and tailor interventions, represents a significant growth area. Advances in microbiome research and its potential role in preterm birth offer novel therapeutic targets. Furthermore, the increasing adoption of digital health solutions, including remote patient monitoring and telemedicine, can enhance early detection and management, especially in underserved populations. Expansion into emerging markets with growing healthcare infrastructure and increasing demand for specialized obstetric care also presents substantial untapped potential.
- Precision Medicine: Personalized treatment strategies based on individual risk profiles.
- Microbiome Research: Exploring the gut and vaginal microbiome for new therapeutic avenues.
- Digital Health Integration: Remote monitoring and telemedicine for improved access and early intervention.
- Emerging Market Penetration: Tapping into the growing demand in developing countries.
- Biomarker Discovery: Development of novel diagnostic and prognostic markers.
Leading Players in the Preterm Birth Prevention and Management Industry Market
- Covis Pharma GmbH (AMAG Pharmaceuticals Inc)
- Ferring B V
- ObsEva
- Bayer AG
- Viatris Inc
- Merck & Co Inc
- AbbVie Inc
- Takeda Pharmaceutical Company Limited
- Pfizer Inc
Key Developments in Preterm Birth Prevention and Management Industry Industry
- September 2022: Bayer received approval from the MHLW in Japan for Eylea (aflibercept) intravitreal injection 40 mg/mL for the treatment of preterm infants with retinopathy of prematurity (ROP).
- June 2022: March of Dimes opened the March of Dimes Prematurity Research Center (PRC) at UC San Francisco (UCSF). The new PRC focuses on prematurity data sharing, computational drug discovery, and electronic medical record research as part of the organization's shift to speed up the pace of discovery to reduce rates of preterm birth in the United States.
Strategic Outlook for Preterm Birth Prevention and Management Industry Market
The strategic outlook for the Preterm Birth Prevention and Management Industry is highly promising, characterized by sustained growth and innovation. The market is expected to be driven by the continuous unmet need for more effective and safer interventions, coupled with increasing global health initiatives focused on maternal and infant well-being. Strategic partnerships between pharmaceutical companies, research institutions, and healthcare providers will be crucial for accelerating the development and adoption of novel therapies. Furthermore, the increasing integration of digital health technologies will play a pivotal role in enhancing patient care and expanding market reach. Companies focusing on personalized medicine, early diagnostic tools, and advanced drug delivery systems are well-positioned to capitalize on future market opportunities and contribute to a significant reduction in preterm birth rates worldwide. The robust forecast period (2025-2033) indicates a strong trajectory of market expansion.
Preterm Birth Prevention and Management Industry Segmentation
-
1. Therapy Type
- 1.1. Progesterone Therapy
- 1.2. Corticosteroid Therapy
- 1.3. Tocolytics Therapy
- 1.4. Antibiotics Therapy
- 1.5. Heparin Profylaxis Therapy
- 1.6. Others
-
2. Route of Administration
- 2.1. Oral
- 2.2. Parenteral
- 2.3. Vaginal
-
3. Distribution Channel
- 3.1. Hospital Pharmacies
- 3.2. Retail Pharmacies
- 3.3. Others
Preterm Birth Prevention and Management Industry Segmentation By Geography
-
1. North America
- 1.1. United States
- 1.2. Canada
- 1.3. Mexico
-
2. Europe
- 2.1. Germany
- 2.2. United Kingdom
- 2.3. France
- 2.4. Italy
- 2.5. Spain
- 2.6. Rest of Europe
-
3. Asia Pacific
- 3.1. China
- 3.2. Japan
- 3.3. India
- 3.4. Australia
- 3.5. South Korea
- 3.6. Rest of Asia Pacific
-
4. Middle East and Africa
- 4.1. GCC
- 4.2. South Africa
- 4.3. Rest of Middle East and Africa
-
5. South America
- 5.1. Brazil
- 5.2. Argentina
- 5.3. Rest of South America

Preterm Birth Prevention and Management Industry Regional Market Share
Geographic Coverage of Preterm Birth Prevention and Management Industry
Preterm Birth Prevention and Management Industry REPORT HIGHLIGHTS
| Aspects | Details |
|---|---|
| Study Period | 2020-2034 |
| Base Year | 2025 |
| Estimated Year | 2026 |
| Forecast Period | 2026-2034 |
| Historical Period | 2020-2025 |
| Growth Rate | CAGR of 16.02% from 2020-2034 |
| Segmentation |
|
Table of Contents
- 1. Introduction
- 1.1. Research Scope
- 1.2. Market Segmentation
- 1.3. Research Methodology
- 1.4. Definitions and Assumptions
- 2. Executive Summary
- 2.1. Introduction
- 3. Market Dynamics
- 3.1. Introduction
- 3.2. Market Drivers
- 3.2.1. Increasing Need for Preterm Birth Prevention and Management Drugs; Growing Focus on Targeted Therapies and Standard of Care
- 3.3. Market Restrains
- 3.3.1. Adverse Effects Associated with Medication
- 3.4. Market Trends
- 3.4.1. Tocolytics Therapy Segment Holds Significant Share Over the Forecast Period
- 4. Market Factor Analysis
- 4.1. Porters Five Forces
- 4.2. Supply/Value Chain
- 4.3. PESTEL analysis
- 4.4. Market Entropy
- 4.5. Patent/Trademark Analysis
- 5. Global Preterm Birth Prevention and Management Industry Analysis, Insights and Forecast, 2020-2032
- 5.1. Market Analysis, Insights and Forecast - by Therapy Type
- 5.1.1. Progesterone Therapy
- 5.1.2. Corticosteroid Therapy
- 5.1.3. Tocolytics Therapy
- 5.1.4. Antibiotics Therapy
- 5.1.5. Heparin Profylaxis Therapy
- 5.1.6. Others
- 5.2. Market Analysis, Insights and Forecast - by Route of Administration
- 5.2.1. Oral
- 5.2.2. Parenteral
- 5.2.3. Vaginal
- 5.3. Market Analysis, Insights and Forecast - by Distribution Channel
- 5.3.1. Hospital Pharmacies
- 5.3.2. Retail Pharmacies
- 5.3.3. Others
- 5.4. Market Analysis, Insights and Forecast - by Region
- 5.4.1. North America
- 5.4.2. Europe
- 5.4.3. Asia Pacific
- 5.4.4. Middle East and Africa
- 5.4.5. South America
- 5.1. Market Analysis, Insights and Forecast - by Therapy Type
- 6. North America Preterm Birth Prevention and Management Industry Analysis, Insights and Forecast, 2020-2032
- 6.1. Market Analysis, Insights and Forecast - by Therapy Type
- 6.1.1. Progesterone Therapy
- 6.1.2. Corticosteroid Therapy
- 6.1.3. Tocolytics Therapy
- 6.1.4. Antibiotics Therapy
- 6.1.5. Heparin Profylaxis Therapy
- 6.1.6. Others
- 6.2. Market Analysis, Insights and Forecast - by Route of Administration
- 6.2.1. Oral
- 6.2.2. Parenteral
- 6.2.3. Vaginal
- 6.3. Market Analysis, Insights and Forecast - by Distribution Channel
- 6.3.1. Hospital Pharmacies
- 6.3.2. Retail Pharmacies
- 6.3.3. Others
- 6.1. Market Analysis, Insights and Forecast - by Therapy Type
- 7. Europe Preterm Birth Prevention and Management Industry Analysis, Insights and Forecast, 2020-2032
- 7.1. Market Analysis, Insights and Forecast - by Therapy Type
- 7.1.1. Progesterone Therapy
- 7.1.2. Corticosteroid Therapy
- 7.1.3. Tocolytics Therapy
- 7.1.4. Antibiotics Therapy
- 7.1.5. Heparin Profylaxis Therapy
- 7.1.6. Others
- 7.2. Market Analysis, Insights and Forecast - by Route of Administration
- 7.2.1. Oral
- 7.2.2. Parenteral
- 7.2.3. Vaginal
- 7.3. Market Analysis, Insights and Forecast - by Distribution Channel
- 7.3.1. Hospital Pharmacies
- 7.3.2. Retail Pharmacies
- 7.3.3. Others
- 7.1. Market Analysis, Insights and Forecast - by Therapy Type
- 8. Asia Pacific Preterm Birth Prevention and Management Industry Analysis, Insights and Forecast, 2020-2032
- 8.1. Market Analysis, Insights and Forecast - by Therapy Type
- 8.1.1. Progesterone Therapy
- 8.1.2. Corticosteroid Therapy
- 8.1.3. Tocolytics Therapy
- 8.1.4. Antibiotics Therapy
- 8.1.5. Heparin Profylaxis Therapy
- 8.1.6. Others
- 8.2. Market Analysis, Insights and Forecast - by Route of Administration
- 8.2.1. Oral
- 8.2.2. Parenteral
- 8.2.3. Vaginal
- 8.3. Market Analysis, Insights and Forecast - by Distribution Channel
- 8.3.1. Hospital Pharmacies
- 8.3.2. Retail Pharmacies
- 8.3.3. Others
- 8.1. Market Analysis, Insights and Forecast - by Therapy Type
- 9. Middle East and Africa Preterm Birth Prevention and Management Industry Analysis, Insights and Forecast, 2020-2032
- 9.1. Market Analysis, Insights and Forecast - by Therapy Type
- 9.1.1. Progesterone Therapy
- 9.1.2. Corticosteroid Therapy
- 9.1.3. Tocolytics Therapy
- 9.1.4. Antibiotics Therapy
- 9.1.5. Heparin Profylaxis Therapy
- 9.1.6. Others
- 9.2. Market Analysis, Insights and Forecast - by Route of Administration
- 9.2.1. Oral
- 9.2.2. Parenteral
- 9.2.3. Vaginal
- 9.3. Market Analysis, Insights and Forecast - by Distribution Channel
- 9.3.1. Hospital Pharmacies
- 9.3.2. Retail Pharmacies
- 9.3.3. Others
- 9.1. Market Analysis, Insights and Forecast - by Therapy Type
- 10. South America Preterm Birth Prevention and Management Industry Analysis, Insights and Forecast, 2020-2032
- 10.1. Market Analysis, Insights and Forecast - by Therapy Type
- 10.1.1. Progesterone Therapy
- 10.1.2. Corticosteroid Therapy
- 10.1.3. Tocolytics Therapy
- 10.1.4. Antibiotics Therapy
- 10.1.5. Heparin Profylaxis Therapy
- 10.1.6. Others
- 10.2. Market Analysis, Insights and Forecast - by Route of Administration
- 10.2.1. Oral
- 10.2.2. Parenteral
- 10.2.3. Vaginal
- 10.3. Market Analysis, Insights and Forecast - by Distribution Channel
- 10.3.1. Hospital Pharmacies
- 10.3.2. Retail Pharmacies
- 10.3.3. Others
- 10.1. Market Analysis, Insights and Forecast - by Therapy Type
- 11. Competitive Analysis
- 11.1. Global Market Share Analysis 2025
- 11.2. Company Profiles
- 11.2.1 Covis Pharma GmbH (AMAG Pharmaceuticals Inc )
- 11.2.1.1. Overview
- 11.2.1.2. Products
- 11.2.1.3. SWOT Analysis
- 11.2.1.4. Recent Developments
- 11.2.1.5. Financials (Based on Availability)
- 11.2.2 Ferring B V
- 11.2.2.1. Overview
- 11.2.2.2. Products
- 11.2.2.3. SWOT Analysis
- 11.2.2.4. Recent Developments
- 11.2.2.5. Financials (Based on Availability)
- 11.2.3 ObsEva
- 11.2.3.1. Overview
- 11.2.3.2. Products
- 11.2.3.3. SWOT Analysis
- 11.2.3.4. Recent Developments
- 11.2.3.5. Financials (Based on Availability)
- 11.2.4 Bayer AG
- 11.2.4.1. Overview
- 11.2.4.2. Products
- 11.2.4.3. SWOT Analysis
- 11.2.4.4. Recent Developments
- 11.2.4.5. Financials (Based on Availability)
- 11.2.5 Viatris Inc
- 11.2.5.1. Overview
- 11.2.5.2. Products
- 11.2.5.3. SWOT Analysis
- 11.2.5.4. Recent Developments
- 11.2.5.5. Financials (Based on Availability)
- 11.2.6 Merck & Co Inc
- 11.2.6.1. Overview
- 11.2.6.2. Products
- 11.2.6.3. SWOT Analysis
- 11.2.6.4. Recent Developments
- 11.2.6.5. Financials (Based on Availability)
- 11.2.7 AbbVie Inc
- 11.2.7.1. Overview
- 11.2.7.2. Products
- 11.2.7.3. SWOT Analysis
- 11.2.7.4. Recent Developments
- 11.2.7.5. Financials (Based on Availability)
- 11.2.8 Takeda Pharmaceutical Company Limited
- 11.2.8.1. Overview
- 11.2.8.2. Products
- 11.2.8.3. SWOT Analysis
- 11.2.8.4. Recent Developments
- 11.2.8.5. Financials (Based on Availability)
- 11.2.9 Pfizer Inc
- 11.2.9.1. Overview
- 11.2.9.2. Products
- 11.2.9.3. SWOT Analysis
- 11.2.9.4. Recent Developments
- 11.2.9.5. Financials (Based on Availability)
- 11.2.1 Covis Pharma GmbH (AMAG Pharmaceuticals Inc )
List of Figures
- Figure 1: Global Preterm Birth Prevention and Management Industry Revenue Breakdown (undefined, %) by Region 2025 & 2033
- Figure 2: Global Preterm Birth Prevention and Management Industry Volume Breakdown (K Unit, %) by Region 2025 & 2033
- Figure 3: North America Preterm Birth Prevention and Management Industry Revenue (undefined), by Therapy Type 2025 & 2033
- Figure 4: North America Preterm Birth Prevention and Management Industry Volume (K Unit), by Therapy Type 2025 & 2033
- Figure 5: North America Preterm Birth Prevention and Management Industry Revenue Share (%), by Therapy Type 2025 & 2033
- Figure 6: North America Preterm Birth Prevention and Management Industry Volume Share (%), by Therapy Type 2025 & 2033
- Figure 7: North America Preterm Birth Prevention and Management Industry Revenue (undefined), by Route of Administration 2025 & 2033
- Figure 8: North America Preterm Birth Prevention and Management Industry Volume (K Unit), by Route of Administration 2025 & 2033
- Figure 9: North America Preterm Birth Prevention and Management Industry Revenue Share (%), by Route of Administration 2025 & 2033
- Figure 10: North America Preterm Birth Prevention and Management Industry Volume Share (%), by Route of Administration 2025 & 2033
- Figure 11: North America Preterm Birth Prevention and Management Industry Revenue (undefined), by Distribution Channel 2025 & 2033
- Figure 12: North America Preterm Birth Prevention and Management Industry Volume (K Unit), by Distribution Channel 2025 & 2033
- Figure 13: North America Preterm Birth Prevention and Management Industry Revenue Share (%), by Distribution Channel 2025 & 2033
- Figure 14: North America Preterm Birth Prevention and Management Industry Volume Share (%), by Distribution Channel 2025 & 2033
- Figure 15: North America Preterm Birth Prevention and Management Industry Revenue (undefined), by Country 2025 & 2033
- Figure 16: North America Preterm Birth Prevention and Management Industry Volume (K Unit), by Country 2025 & 2033
- Figure 17: North America Preterm Birth Prevention and Management Industry Revenue Share (%), by Country 2025 & 2033
- Figure 18: North America Preterm Birth Prevention and Management Industry Volume Share (%), by Country 2025 & 2033
- Figure 19: Europe Preterm Birth Prevention and Management Industry Revenue (undefined), by Therapy Type 2025 & 2033
- Figure 20: Europe Preterm Birth Prevention and Management Industry Volume (K Unit), by Therapy Type 2025 & 2033
- Figure 21: Europe Preterm Birth Prevention and Management Industry Revenue Share (%), by Therapy Type 2025 & 2033
- Figure 22: Europe Preterm Birth Prevention and Management Industry Volume Share (%), by Therapy Type 2025 & 2033
- Figure 23: Europe Preterm Birth Prevention and Management Industry Revenue (undefined), by Route of Administration 2025 & 2033
- Figure 24: Europe Preterm Birth Prevention and Management Industry Volume (K Unit), by Route of Administration 2025 & 2033
- Figure 25: Europe Preterm Birth Prevention and Management Industry Revenue Share (%), by Route of Administration 2025 & 2033
- Figure 26: Europe Preterm Birth Prevention and Management Industry Volume Share (%), by Route of Administration 2025 & 2033
- Figure 27: Europe Preterm Birth Prevention and Management Industry Revenue (undefined), by Distribution Channel 2025 & 2033
- Figure 28: Europe Preterm Birth Prevention and Management Industry Volume (K Unit), by Distribution Channel 2025 & 2033
- Figure 29: Europe Preterm Birth Prevention and Management Industry Revenue Share (%), by Distribution Channel 2025 & 2033
- Figure 30: Europe Preterm Birth Prevention and Management Industry Volume Share (%), by Distribution Channel 2025 & 2033
- Figure 31: Europe Preterm Birth Prevention and Management Industry Revenue (undefined), by Country 2025 & 2033
- Figure 32: Europe Preterm Birth Prevention and Management Industry Volume (K Unit), by Country 2025 & 2033
- Figure 33: Europe Preterm Birth Prevention and Management Industry Revenue Share (%), by Country 2025 & 2033
- Figure 34: Europe Preterm Birth Prevention and Management Industry Volume Share (%), by Country 2025 & 2033
- Figure 35: Asia Pacific Preterm Birth Prevention and Management Industry Revenue (undefined), by Therapy Type 2025 & 2033
- Figure 36: Asia Pacific Preterm Birth Prevention and Management Industry Volume (K Unit), by Therapy Type 2025 & 2033
- Figure 37: Asia Pacific Preterm Birth Prevention and Management Industry Revenue Share (%), by Therapy Type 2025 & 2033
- Figure 38: Asia Pacific Preterm Birth Prevention and Management Industry Volume Share (%), by Therapy Type 2025 & 2033
- Figure 39: Asia Pacific Preterm Birth Prevention and Management Industry Revenue (undefined), by Route of Administration 2025 & 2033
- Figure 40: Asia Pacific Preterm Birth Prevention and Management Industry Volume (K Unit), by Route of Administration 2025 & 2033
- Figure 41: Asia Pacific Preterm Birth Prevention and Management Industry Revenue Share (%), by Route of Administration 2025 & 2033
- Figure 42: Asia Pacific Preterm Birth Prevention and Management Industry Volume Share (%), by Route of Administration 2025 & 2033
- Figure 43: Asia Pacific Preterm Birth Prevention and Management Industry Revenue (undefined), by Distribution Channel 2025 & 2033
- Figure 44: Asia Pacific Preterm Birth Prevention and Management Industry Volume (K Unit), by Distribution Channel 2025 & 2033
- Figure 45: Asia Pacific Preterm Birth Prevention and Management Industry Revenue Share (%), by Distribution Channel 2025 & 2033
- Figure 46: Asia Pacific Preterm Birth Prevention and Management Industry Volume Share (%), by Distribution Channel 2025 & 2033
- Figure 47: Asia Pacific Preterm Birth Prevention and Management Industry Revenue (undefined), by Country 2025 & 2033
- Figure 48: Asia Pacific Preterm Birth Prevention and Management Industry Volume (K Unit), by Country 2025 & 2033
- Figure 49: Asia Pacific Preterm Birth Prevention and Management Industry Revenue Share (%), by Country 2025 & 2033
- Figure 50: Asia Pacific Preterm Birth Prevention and Management Industry Volume Share (%), by Country 2025 & 2033
- Figure 51: Middle East and Africa Preterm Birth Prevention and Management Industry Revenue (undefined), by Therapy Type 2025 & 2033
- Figure 52: Middle East and Africa Preterm Birth Prevention and Management Industry Volume (K Unit), by Therapy Type 2025 & 2033
- Figure 53: Middle East and Africa Preterm Birth Prevention and Management Industry Revenue Share (%), by Therapy Type 2025 & 2033
- Figure 54: Middle East and Africa Preterm Birth Prevention and Management Industry Volume Share (%), by Therapy Type 2025 & 2033
- Figure 55: Middle East and Africa Preterm Birth Prevention and Management Industry Revenue (undefined), by Route of Administration 2025 & 2033
- Figure 56: Middle East and Africa Preterm Birth Prevention and Management Industry Volume (K Unit), by Route of Administration 2025 & 2033
- Figure 57: Middle East and Africa Preterm Birth Prevention and Management Industry Revenue Share (%), by Route of Administration 2025 & 2033
- Figure 58: Middle East and Africa Preterm Birth Prevention and Management Industry Volume Share (%), by Route of Administration 2025 & 2033
- Figure 59: Middle East and Africa Preterm Birth Prevention and Management Industry Revenue (undefined), by Distribution Channel 2025 & 2033
- Figure 60: Middle East and Africa Preterm Birth Prevention and Management Industry Volume (K Unit), by Distribution Channel 2025 & 2033
- Figure 61: Middle East and Africa Preterm Birth Prevention and Management Industry Revenue Share (%), by Distribution Channel 2025 & 2033
- Figure 62: Middle East and Africa Preterm Birth Prevention and Management Industry Volume Share (%), by Distribution Channel 2025 & 2033
- Figure 63: Middle East and Africa Preterm Birth Prevention and Management Industry Revenue (undefined), by Country 2025 & 2033
- Figure 64: Middle East and Africa Preterm Birth Prevention and Management Industry Volume (K Unit), by Country 2025 & 2033
- Figure 65: Middle East and Africa Preterm Birth Prevention and Management Industry Revenue Share (%), by Country 2025 & 2033
- Figure 66: Middle East and Africa Preterm Birth Prevention and Management Industry Volume Share (%), by Country 2025 & 2033
- Figure 67: South America Preterm Birth Prevention and Management Industry Revenue (undefined), by Therapy Type 2025 & 2033
- Figure 68: South America Preterm Birth Prevention and Management Industry Volume (K Unit), by Therapy Type 2025 & 2033
- Figure 69: South America Preterm Birth Prevention and Management Industry Revenue Share (%), by Therapy Type 2025 & 2033
- Figure 70: South America Preterm Birth Prevention and Management Industry Volume Share (%), by Therapy Type 2025 & 2033
- Figure 71: South America Preterm Birth Prevention and Management Industry Revenue (undefined), by Route of Administration 2025 & 2033
- Figure 72: South America Preterm Birth Prevention and Management Industry Volume (K Unit), by Route of Administration 2025 & 2033
- Figure 73: South America Preterm Birth Prevention and Management Industry Revenue Share (%), by Route of Administration 2025 & 2033
- Figure 74: South America Preterm Birth Prevention and Management Industry Volume Share (%), by Route of Administration 2025 & 2033
- Figure 75: South America Preterm Birth Prevention and Management Industry Revenue (undefined), by Distribution Channel 2025 & 2033
- Figure 76: South America Preterm Birth Prevention and Management Industry Volume (K Unit), by Distribution Channel 2025 & 2033
- Figure 77: South America Preterm Birth Prevention and Management Industry Revenue Share (%), by Distribution Channel 2025 & 2033
- Figure 78: South America Preterm Birth Prevention and Management Industry Volume Share (%), by Distribution Channel 2025 & 2033
- Figure 79: South America Preterm Birth Prevention and Management Industry Revenue (undefined), by Country 2025 & 2033
- Figure 80: South America Preterm Birth Prevention and Management Industry Volume (K Unit), by Country 2025 & 2033
- Figure 81: South America Preterm Birth Prevention and Management Industry Revenue Share (%), by Country 2025 & 2033
- Figure 82: South America Preterm Birth Prevention and Management Industry Volume Share (%), by Country 2025 & 2033
List of Tables
- Table 1: Global Preterm Birth Prevention and Management Industry Revenue undefined Forecast, by Therapy Type 2020 & 2033
- Table 2: Global Preterm Birth Prevention and Management Industry Volume K Unit Forecast, by Therapy Type 2020 & 2033
- Table 3: Global Preterm Birth Prevention and Management Industry Revenue undefined Forecast, by Route of Administration 2020 & 2033
- Table 4: Global Preterm Birth Prevention and Management Industry Volume K Unit Forecast, by Route of Administration 2020 & 2033
- Table 5: Global Preterm Birth Prevention and Management Industry Revenue undefined Forecast, by Distribution Channel 2020 & 2033
- Table 6: Global Preterm Birth Prevention and Management Industry Volume K Unit Forecast, by Distribution Channel 2020 & 2033
- Table 7: Global Preterm Birth Prevention and Management Industry Revenue undefined Forecast, by Region 2020 & 2033
- Table 8: Global Preterm Birth Prevention and Management Industry Volume K Unit Forecast, by Region 2020 & 2033
- Table 9: Global Preterm Birth Prevention and Management Industry Revenue undefined Forecast, by Therapy Type 2020 & 2033
- Table 10: Global Preterm Birth Prevention and Management Industry Volume K Unit Forecast, by Therapy Type 2020 & 2033
- Table 11: Global Preterm Birth Prevention and Management Industry Revenue undefined Forecast, by Route of Administration 2020 & 2033
- Table 12: Global Preterm Birth Prevention and Management Industry Volume K Unit Forecast, by Route of Administration 2020 & 2033
- Table 13: Global Preterm Birth Prevention and Management Industry Revenue undefined Forecast, by Distribution Channel 2020 & 2033
- Table 14: Global Preterm Birth Prevention and Management Industry Volume K Unit Forecast, by Distribution Channel 2020 & 2033
- Table 15: Global Preterm Birth Prevention and Management Industry Revenue undefined Forecast, by Country 2020 & 2033
- Table 16: Global Preterm Birth Prevention and Management Industry Volume K Unit Forecast, by Country 2020 & 2033
- Table 17: United States Preterm Birth Prevention and Management Industry Revenue (undefined) Forecast, by Application 2020 & 2033
- Table 18: United States Preterm Birth Prevention and Management Industry Volume (K Unit) Forecast, by Application 2020 & 2033
- Table 19: Canada Preterm Birth Prevention and Management Industry Revenue (undefined) Forecast, by Application 2020 & 2033
- Table 20: Canada Preterm Birth Prevention and Management Industry Volume (K Unit) Forecast, by Application 2020 & 2033
- Table 21: Mexico Preterm Birth Prevention and Management Industry Revenue (undefined) Forecast, by Application 2020 & 2033
- Table 22: Mexico Preterm Birth Prevention and Management Industry Volume (K Unit) Forecast, by Application 2020 & 2033
- Table 23: Global Preterm Birth Prevention and Management Industry Revenue undefined Forecast, by Therapy Type 2020 & 2033
- Table 24: Global Preterm Birth Prevention and Management Industry Volume K Unit Forecast, by Therapy Type 2020 & 2033
- Table 25: Global Preterm Birth Prevention and Management Industry Revenue undefined Forecast, by Route of Administration 2020 & 2033
- Table 26: Global Preterm Birth Prevention and Management Industry Volume K Unit Forecast, by Route of Administration 2020 & 2033
- Table 27: Global Preterm Birth Prevention and Management Industry Revenue undefined Forecast, by Distribution Channel 2020 & 2033
- Table 28: Global Preterm Birth Prevention and Management Industry Volume K Unit Forecast, by Distribution Channel 2020 & 2033
- Table 29: Global Preterm Birth Prevention and Management Industry Revenue undefined Forecast, by Country 2020 & 2033
- Table 30: Global Preterm Birth Prevention and Management Industry Volume K Unit Forecast, by Country 2020 & 2033
- Table 31: Germany Preterm Birth Prevention and Management Industry Revenue (undefined) Forecast, by Application 2020 & 2033
- Table 32: Germany Preterm Birth Prevention and Management Industry Volume (K Unit) Forecast, by Application 2020 & 2033
- Table 33: United Kingdom Preterm Birth Prevention and Management Industry Revenue (undefined) Forecast, by Application 2020 & 2033
- Table 34: United Kingdom Preterm Birth Prevention and Management Industry Volume (K Unit) Forecast, by Application 2020 & 2033
- Table 35: France Preterm Birth Prevention and Management Industry Revenue (undefined) Forecast, by Application 2020 & 2033
- Table 36: France Preterm Birth Prevention and Management Industry Volume (K Unit) Forecast, by Application 2020 & 2033
- Table 37: Italy Preterm Birth Prevention and Management Industry Revenue (undefined) Forecast, by Application 2020 & 2033
- Table 38: Italy Preterm Birth Prevention and Management Industry Volume (K Unit) Forecast, by Application 2020 & 2033
- Table 39: Spain Preterm Birth Prevention and Management Industry Revenue (undefined) Forecast, by Application 2020 & 2033
- Table 40: Spain Preterm Birth Prevention and Management Industry Volume (K Unit) Forecast, by Application 2020 & 2033
- Table 41: Rest of Europe Preterm Birth Prevention and Management Industry Revenue (undefined) Forecast, by Application 2020 & 2033
- Table 42: Rest of Europe Preterm Birth Prevention and Management Industry Volume (K Unit) Forecast, by Application 2020 & 2033
- Table 43: Global Preterm Birth Prevention and Management Industry Revenue undefined Forecast, by Therapy Type 2020 & 2033
- Table 44: Global Preterm Birth Prevention and Management Industry Volume K Unit Forecast, by Therapy Type 2020 & 2033
- Table 45: Global Preterm Birth Prevention and Management Industry Revenue undefined Forecast, by Route of Administration 2020 & 2033
- Table 46: Global Preterm Birth Prevention and Management Industry Volume K Unit Forecast, by Route of Administration 2020 & 2033
- Table 47: Global Preterm Birth Prevention and Management Industry Revenue undefined Forecast, by Distribution Channel 2020 & 2033
- Table 48: Global Preterm Birth Prevention and Management Industry Volume K Unit Forecast, by Distribution Channel 2020 & 2033
- Table 49: Global Preterm Birth Prevention and Management Industry Revenue undefined Forecast, by Country 2020 & 2033
- Table 50: Global Preterm Birth Prevention and Management Industry Volume K Unit Forecast, by Country 2020 & 2033
- Table 51: China Preterm Birth Prevention and Management Industry Revenue (undefined) Forecast, by Application 2020 & 2033
- Table 52: China Preterm Birth Prevention and Management Industry Volume (K Unit) Forecast, by Application 2020 & 2033
- Table 53: Japan Preterm Birth Prevention and Management Industry Revenue (undefined) Forecast, by Application 2020 & 2033
- Table 54: Japan Preterm Birth Prevention and Management Industry Volume (K Unit) Forecast, by Application 2020 & 2033
- Table 55: India Preterm Birth Prevention and Management Industry Revenue (undefined) Forecast, by Application 2020 & 2033
- Table 56: India Preterm Birth Prevention and Management Industry Volume (K Unit) Forecast, by Application 2020 & 2033
- Table 57: Australia Preterm Birth Prevention and Management Industry Revenue (undefined) Forecast, by Application 2020 & 2033
- Table 58: Australia Preterm Birth Prevention and Management Industry Volume (K Unit) Forecast, by Application 2020 & 2033
- Table 59: South Korea Preterm Birth Prevention and Management Industry Revenue (undefined) Forecast, by Application 2020 & 2033
- Table 60: South Korea Preterm Birth Prevention and Management Industry Volume (K Unit) Forecast, by Application 2020 & 2033
- Table 61: Rest of Asia Pacific Preterm Birth Prevention and Management Industry Revenue (undefined) Forecast, by Application 2020 & 2033
- Table 62: Rest of Asia Pacific Preterm Birth Prevention and Management Industry Volume (K Unit) Forecast, by Application 2020 & 2033
- Table 63: Global Preterm Birth Prevention and Management Industry Revenue undefined Forecast, by Therapy Type 2020 & 2033
- Table 64: Global Preterm Birth Prevention and Management Industry Volume K Unit Forecast, by Therapy Type 2020 & 2033
- Table 65: Global Preterm Birth Prevention and Management Industry Revenue undefined Forecast, by Route of Administration 2020 & 2033
- Table 66: Global Preterm Birth Prevention and Management Industry Volume K Unit Forecast, by Route of Administration 2020 & 2033
- Table 67: Global Preterm Birth Prevention and Management Industry Revenue undefined Forecast, by Distribution Channel 2020 & 2033
- Table 68: Global Preterm Birth Prevention and Management Industry Volume K Unit Forecast, by Distribution Channel 2020 & 2033
- Table 69: Global Preterm Birth Prevention and Management Industry Revenue undefined Forecast, by Country 2020 & 2033
- Table 70: Global Preterm Birth Prevention and Management Industry Volume K Unit Forecast, by Country 2020 & 2033
- Table 71: GCC Preterm Birth Prevention and Management Industry Revenue (undefined) Forecast, by Application 2020 & 2033
- Table 72: GCC Preterm Birth Prevention and Management Industry Volume (K Unit) Forecast, by Application 2020 & 2033
- Table 73: South Africa Preterm Birth Prevention and Management Industry Revenue (undefined) Forecast, by Application 2020 & 2033
- Table 74: South Africa Preterm Birth Prevention and Management Industry Volume (K Unit) Forecast, by Application 2020 & 2033
- Table 75: Rest of Middle East and Africa Preterm Birth Prevention and Management Industry Revenue (undefined) Forecast, by Application 2020 & 2033
- Table 76: Rest of Middle East and Africa Preterm Birth Prevention and Management Industry Volume (K Unit) Forecast, by Application 2020 & 2033
- Table 77: Global Preterm Birth Prevention and Management Industry Revenue undefined Forecast, by Therapy Type 2020 & 2033
- Table 78: Global Preterm Birth Prevention and Management Industry Volume K Unit Forecast, by Therapy Type 2020 & 2033
- Table 79: Global Preterm Birth Prevention and Management Industry Revenue undefined Forecast, by Route of Administration 2020 & 2033
- Table 80: Global Preterm Birth Prevention and Management Industry Volume K Unit Forecast, by Route of Administration 2020 & 2033
- Table 81: Global Preterm Birth Prevention and Management Industry Revenue undefined Forecast, by Distribution Channel 2020 & 2033
- Table 82: Global Preterm Birth Prevention and Management Industry Volume K Unit Forecast, by Distribution Channel 2020 & 2033
- Table 83: Global Preterm Birth Prevention and Management Industry Revenue undefined Forecast, by Country 2020 & 2033
- Table 84: Global Preterm Birth Prevention and Management Industry Volume K Unit Forecast, by Country 2020 & 2033
- Table 85: Brazil Preterm Birth Prevention and Management Industry Revenue (undefined) Forecast, by Application 2020 & 2033
- Table 86: Brazil Preterm Birth Prevention and Management Industry Volume (K Unit) Forecast, by Application 2020 & 2033
- Table 87: Argentina Preterm Birth Prevention and Management Industry Revenue (undefined) Forecast, by Application 2020 & 2033
- Table 88: Argentina Preterm Birth Prevention and Management Industry Volume (K Unit) Forecast, by Application 2020 & 2033
- Table 89: Rest of South America Preterm Birth Prevention and Management Industry Revenue (undefined) Forecast, by Application 2020 & 2033
- Table 90: Rest of South America Preterm Birth Prevention and Management Industry Volume (K Unit) Forecast, by Application 2020 & 2033
Frequently Asked Questions
1. What is the projected Compound Annual Growth Rate (CAGR) of the Preterm Birth Prevention and Management Industry?
The projected CAGR is approximately 16.02%.
2. Which companies are prominent players in the Preterm Birth Prevention and Management Industry?
Key companies in the market include Covis Pharma GmbH (AMAG Pharmaceuticals Inc ), Ferring B V, ObsEva, Bayer AG, Viatris Inc, Merck & Co Inc, AbbVie Inc, Takeda Pharmaceutical Company Limited, Pfizer Inc.
3. What are the main segments of the Preterm Birth Prevention and Management Industry?
The market segments include Therapy Type, Route of Administration, Distribution Channel.
4. Can you provide details about the market size?
The market size is estimated to be USD XXX N/A as of 2022.
5. What are some drivers contributing to market growth?
Increasing Need for Preterm Birth Prevention and Management Drugs; Growing Focus on Targeted Therapies and Standard of Care.
6. What are the notable trends driving market growth?
Tocolytics Therapy Segment Holds Significant Share Over the Forecast Period.
7. Are there any restraints impacting market growth?
Adverse Effects Associated with Medication.
8. Can you provide examples of recent developments in the market?
In September 2022, Bayer received approval from the MHLW in Japan for Eylea (aflibercept) intravitreal injection 40 mg/mL for the treatment of preterm infants with retinopathy of prematurity (ROP).
9. What pricing options are available for accessing the report?
Pricing options include single-user, multi-user, and enterprise licenses priced at USD 4750, USD 5250, and USD 8750 respectively.
10. Is the market size provided in terms of value or volume?
The market size is provided in terms of value, measured in N/A and volume, measured in K Unit.
11. Are there any specific market keywords associated with the report?
Yes, the market keyword associated with the report is "Preterm Birth Prevention and Management Industry," which aids in identifying and referencing the specific market segment covered.
12. How do I determine which pricing option suits my needs best?
The pricing options vary based on user requirements and access needs. Individual users may opt for single-user licenses, while businesses requiring broader access may choose multi-user or enterprise licenses for cost-effective access to the report.
13. Are there any additional resources or data provided in the Preterm Birth Prevention and Management Industry report?
While the report offers comprehensive insights, it's advisable to review the specific contents or supplementary materials provided to ascertain if additional resources or data are available.
14. How can I stay updated on further developments or reports in the Preterm Birth Prevention and Management Industry?
To stay informed about further developments, trends, and reports in the Preterm Birth Prevention and Management Industry, consider subscribing to industry newsletters, following relevant companies and organizations, or regularly checking reputable industry news sources and publications.
Methodology
Step 1 - Identification of Relevant Samples Size from Population Database


Step 2 - Approaches for Defining Global Market Size (Value, Volume* & Price*)

Note*: In applicable scenarios
Step 3 - Data Sources
Primary Research
- Web Analytics
- Survey Reports
- Research Institute
- Latest Research Reports
- Opinion Leaders
Secondary Research
- Annual Reports
- White Paper
- Latest Press Release
- Industry Association
- Paid Database
- Investor Presentations

Step 4 - Data Triangulation
Involves using different sources of information in order to increase the validity of a study
These sources are likely to be stakeholders in a program - participants, other researchers, program staff, other community members, and so on.
Then we put all data in single framework & apply various statistical tools to find out the dynamic on the market.
During the analysis stage, feedback from the stakeholder groups would be compared to determine areas of agreement as well as areas of divergence