
Key Insights
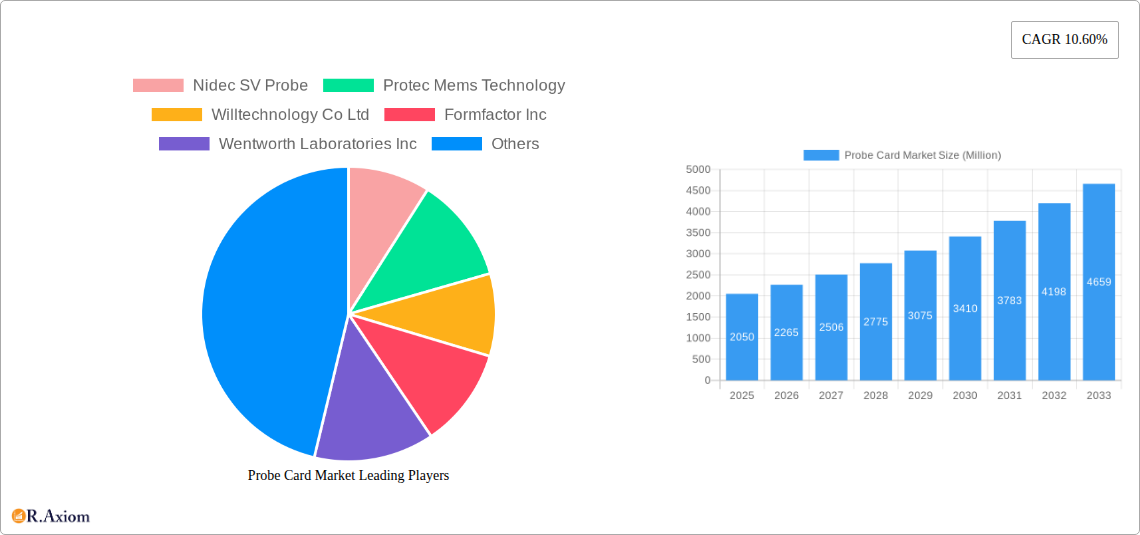
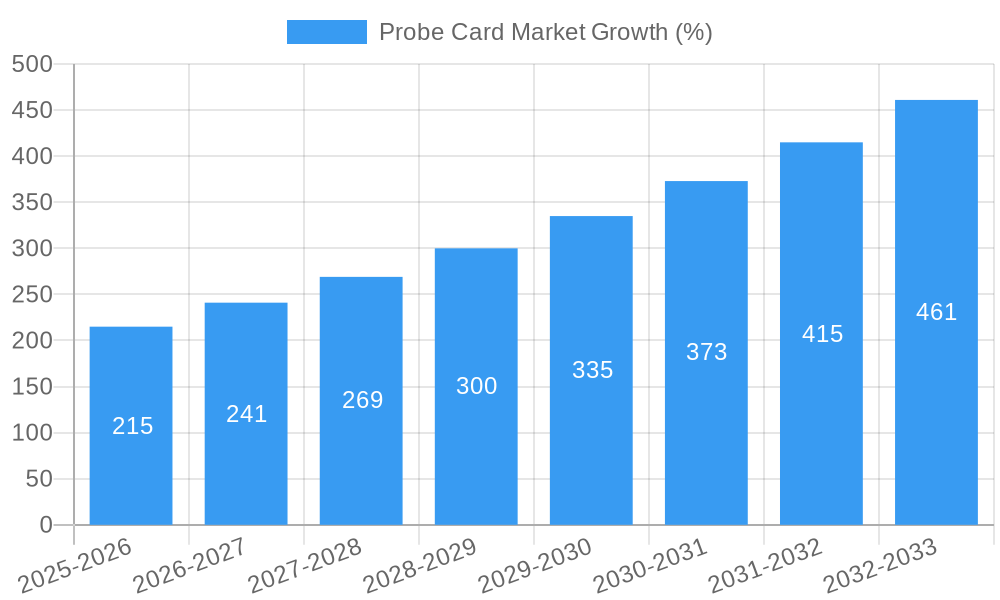
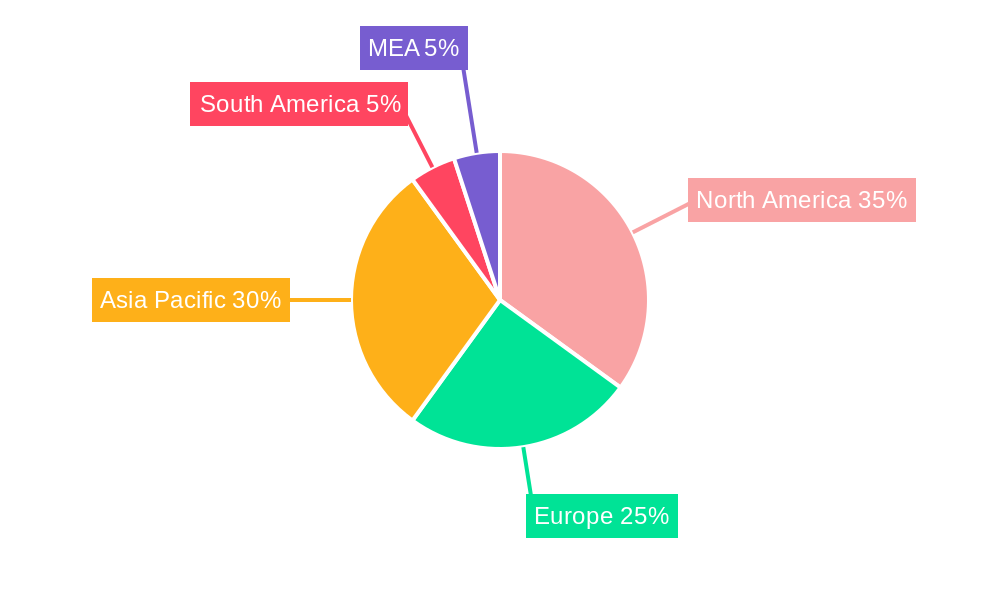
The global probe card market, valued at $2.05 billion in 2025, is projected to experience robust growth, driven by the increasing demand for advanced semiconductor devices and the miniaturization of electronic components. A compound annual growth rate (CAGR) of 10.60% from 2025 to 2033 indicates a significant expansion of this market. Key growth drivers include the escalating adoption of advanced semiconductor manufacturing processes, particularly in the DRAM, Flash, and logic chip segments. The rising demand for high-bandwidth memory (HBM) and 3D NAND technologies further fuels market expansion, requiring advanced probe card solutions to test the intricate designs. Technological advancements, such as the development of MEMS-based probe cards offering improved accuracy and reliability, are also contributing factors. While the market faces challenges from high manufacturing costs and stringent quality control requirements, the overall positive outlook is driven by the continuous innovation within the semiconductor industry and the imperative to ensure efficient testing of increasingly complex chips. The market is segmented by technology (MEMS, Vertical, Cantilever, Specialty, Other), application (DRAM, Flash, Foundry & Logic, Parametric, Other), and type (Standard, Advanced). North America and Asia-Pacific are currently leading regions, but strong growth is expected across all regions, particularly in emerging markets fueled by expanding semiconductor manufacturing facilities. Competition is fierce amongst established players like Formfactor Inc., Technoprobe S.p.A., and Nidec SV Probe, with ongoing innovation and mergers and acquisitions shaping the market landscape.
The forecast period (2025-2033) suggests considerable market expansion, driven by the persistent need for high-precision testing in the semiconductor industry. Growth will likely be concentrated in advanced probe card segments, reflecting the increasing complexity of modern semiconductor designs. Geographic expansion will continue, with regions outside of North America and Asia-Pacific witnessing substantial growth as semiconductor manufacturing facilities diversify globally. The ongoing focus on research and development within the probe card industry will generate more advanced products, further enhancing test capabilities and driving adoption. However, maintaining market competitiveness necessitates efficient production processes and cost management to overcome potential pricing pressures. The successful players will be those who can effectively balance technological innovation with economic viability, providing high-quality, cost-effective solutions to meet the demanding requirements of the semiconductor industry.
This detailed report provides a comprehensive analysis of the global Probe Card market, offering valuable insights for industry stakeholders, investors, and market researchers. With a study period spanning 2019-2033, a base year of 2025, and a forecast period of 2025-2033, this report examines market trends, growth drivers, challenges, and opportunities. The market is segmented by technology (MEMS, Vertical, Cantilever, Specialty, Other Technologies), application (DRAM, Flash, Foundry and Logic, Parametric, Other Applications), and type (Standard Probe Card, Advanced Probe Card). Key players like FormFactor Inc, Technoprobe S.P.A, and Nidec SV Probe are analyzed for their market position and strategies. The report is enriched with data visualizations and insightful commentary, making it a crucial resource for understanding the dynamics of this rapidly evolving market. The market is projected to reach xx Million by 2033.
Probe Card Market Concentration & Innovation
The Probe Card market exhibits a moderately concentrated landscape, with a few dominant players holding significant market share. While precise market share figures for each company are proprietary, it's evident that companies like FormFactor Inc, Technoprobe S.P.A, and Nidec SV Probe are major players, collectively commanding a substantial portion of the market. The competitive landscape is characterized by ongoing innovation, driven by the need for higher probe card performance in advanced semiconductor manufacturing.
- Innovation Drivers: The demand for miniaturization, higher throughput, and improved accuracy in semiconductor testing is fueling innovation in probe card technologies. MEMS-based probe cards are gaining prominence due to their ability to handle increasingly dense chip designs.
- Regulatory Frameworks: International and regional regulations related to semiconductor manufacturing and environmental standards influence probe card design and production.
- Product Substitutes: While there are no direct substitutes for probe cards in semiconductor testing, alternative testing methods are emerging, albeit at a slower pace.
- End-User Trends: The increasing complexity of integrated circuits (ICs) drives demand for more sophisticated and reliable probe cards. The growth of the 5G, AI, and high-performance computing (HPC) sectors is a primary catalyst.
- M&A Activities: While specific M&A deal values aren't publicly available for all transactions, the industry has witnessed consolidation through acquisitions and strategic partnerships to expand market reach and enhance technological capabilities.
Probe Card Market Industry Trends & Insights
The Probe Card market is experiencing robust growth, driven by several key factors. The compound annual growth rate (CAGR) during the historical period (2019-2024) is estimated at xx%, and the forecast period (2025-2033) projects a CAGR of xx%. This growth is significantly influenced by the expanding semiconductor industry, particularly in advanced nodes and high-density packaging technologies. Technological advancements, particularly in MEMS technology and advanced materials, are enabling the creation of more precise and durable probe cards. Consumer preference for smaller, faster, and more power-efficient electronics fuels demand for advanced semiconductor chips, which in turn necessitates advanced probe card technology.
The competitive landscape is dynamic, with companies focusing on developing innovative probe card designs, improving manufacturing processes, and expanding their product portfolios to meet diverse customer needs. Market penetration for advanced probe cards is increasing due to their superior performance and reliability in testing advanced chips. Technological disruptions, such as the introduction of new materials and manufacturing techniques, constantly reshape the market, creating both opportunities and challenges for existing players.
Dominant Markets & Segments in Probe Card Market
The Asia-Pacific region, particularly Taiwan, South Korea, and China, holds a dominant position in the Probe Card market, driven by the concentration of major semiconductor manufacturing facilities in this region. This dominance is further reinforced by robust government support for the semiconductor industry, substantial investments in research and development, and a highly skilled workforce.
- By Technology: MEMS probe cards are expected to witness the highest growth rate due to their superior performance and adaptability to advanced chip designs.
- By Application: The DRAM and Foundry and Logic segments currently represent the largest applications for probe cards. The growth in these segments is projected to drive market expansion in the forecast period.
- By Type: The demand for advanced probe cards is rising significantly driven by the increasing complexity and density of semiconductor devices.
Key Drivers for Dominant Regions:
- Strong government support and investment in the semiconductor industry.
- A large and well-established ecosystem of semiconductor manufacturers and suppliers.
- A highly skilled workforce.
- Increasing demand for advanced semiconductor devices.
Probe Card Market Product Developments
Recent product developments in the probe card market focus on enhancing performance in high-current, high-density testing environments. FormFactor's COMPASS presentation highlights the pursuit of "unburnable" probes, focusing on increasing current carrying capacity (CCC) to levels exceeding 2.5A at 80-um minimum pitch. This involves design innovations and architectural improvements to ensure probe integrity under extreme stress. These improvements address the challenges presented by ever-shrinking chip features and higher power requirements in advanced semiconductor devices.
Report Scope & Segmentation Analysis
This report segments the Probe Card market by technology, application, and type.
- By Technology: MEMS, Vertical, Cantilever, Specialty, and Other Technologies. MEMS technology is anticipated to exhibit the highest growth due to its suitability for advanced node testing.
- By Application: DRAM, Flash, Foundry and Logic, Parametric, and Other Applications. DRAM and Foundry and Logic applications will continue to be significant revenue generators.
- By Type: Standard Probe Card and Advanced Probe Card. The Advanced Probe Card segment is poised for faster growth owing to its ability to handle sophisticated chips.
Each segment's growth projections, market sizes, and competitive dynamics are analyzed in detail within the full report.
Key Drivers of Probe Card Market Growth
The Probe Card market's growth is propelled by several key factors:
- Technological advancements: Innovations in MEMS technology, materials science, and manufacturing processes are leading to more efficient and reliable probe cards.
- Increased demand for semiconductors: The rapid growth of the electronics industry, particularly in areas like 5G, AI, and IoT, is driving up the demand for advanced semiconductor devices, thereby boosting probe card demand.
- Miniaturization of semiconductor devices: The trend toward smaller and more complex chips necessitates the use of advanced probe cards capable of handling higher densities.
Challenges in the Probe Card Market Sector
The Probe Card market faces several challenges:
- High manufacturing costs: Advanced probe cards are complex and expensive to manufacture, potentially limiting market penetration.
- Supply chain disruptions: Global supply chain issues can affect the availability of raw materials and components, impacting production and delivery timelines.
- Intense competition: The market is competitive, with established players and new entrants vying for market share.
Emerging Opportunities in Probe Card Market
Several emerging opportunities exist within the Probe Card market:
- Development of new materials: Research into new materials with enhanced properties (e.g., higher conductivity, greater durability) can lead to superior probe card designs.
- Expansion into new applications: The increasing use of semiconductors in emerging technologies (e.g., automotive electronics, medical devices) presents new market opportunities.
- Advancements in testing methodologies: Improvements in semiconductor testing techniques can further drive demand for advanced probe cards.
Leading Players in the Probe Card Market
- Nidec SV Probe
- Protec Mems Technology
- Willtechnology Co Ltd
- Formfactor Inc
- Wentworth Laboratories Inc
- Japan Electronic Materials Corporation
- Micronics Japan Co Ltd
- TSE Co Lt
- Feinmetall Gmbh
- Star Technologies Inc
- Technoprobe S.P.A
- Mpi Corporation
- GGB Industries Inc
- Korea Instruments Co Ltd
Key Developments in Probe Card Market Industry
- April 2024: FormFactor released the COMPASS presentation, focusing on maximizing CCC in probe cards and the journey toward an "unburnable" probe. This emphasizes advancements in design and architecture to enhance probe performance in high-stress conditions.
- January 2024: Samsung established a new research laboratory in the United States to accelerate the development of next-generation 3D-DRAM. This underscores ongoing innovation in memory technology, impacting the demand for advanced probe cards.
Strategic Outlook for Probe Card Market
The Probe Card market is poised for continued growth, driven by technological innovation, expanding semiconductor applications, and increased investment in advanced manufacturing capabilities. Future market potential is substantial, particularly in emerging technologies and applications. Companies that successfully innovate and adapt to evolving market needs will be well-positioned to capture significant market share.
Probe Card Market Segmentation
-
1. Technology
- 1.1. MEMS
- 1.2. Vertical
- 1.3. Cantilever
- 1.4. Speciality
- 1.5. Other Technologies
-
2. Application
- 2.1. DRAM
- 2.2. Flash
- 2.3. Foundry and Logic
- 2.4. Parametric
- 2.5. Other Applications
-
3. Type
- 3.1. Standard Probe Card
- 3.2. Advanced Probe Card
Probe Card Market Segmentation By Geography
- 1. North America
- 2. Europe
- 3. Asia
- 4. Australia and New Zealand
- 5. Latin America
- 6. Middle East and Africa
Probe Card Market REPORT HIGHLIGHTS
| Aspects | Details |
|---|---|
| Study Period | 2019-2033 |
| Base Year | 2024 |
| Estimated Year | 2025 |
| Forecast Period | 2025-2033 |
| Historical Period | 2019-2024 |
| Growth Rate | CAGR of 10.60% from 2019-2033 |
| Segmentation |
|
Table of Contents
- 1. Introduction
- 1.1. Research Scope
- 1.2. Market Segmentation
- 1.3. Research Methodology
- 1.4. Definitions and Assumptions
- 2. Executive Summary
- 2.1. Introduction
- 3. Market Dynamics
- 3.1. Introduction
- 3.2. Market Drivers
- 3.2.1. Increase in Demand for Consumer Electronics and IOT; Miniaturization of Electronic Products; Technological Advancement And Innovations in Semiconductor Industry
- 3.3. Market Restrains
- 3.3.1. High Costs Associated with Probe Cards; Lack of Awareness Among Consumers Regarding The Benefits of Probe Card Solution
- 3.4. Market Trends
- 3.4.1. MEMS to Dominate the Technology Segment
- 4. Market Factor Analysis
- 4.1. Porters Five Forces
- 4.2. Supply/Value Chain
- 4.3. PESTEL analysis
- 4.4. Market Entropy
- 4.5. Patent/Trademark Analysis
- 5. Global Probe Card Market Analysis, Insights and Forecast, 2019-2031
- 5.1. Market Analysis, Insights and Forecast - by Technology
- 5.1.1. MEMS
- 5.1.2. Vertical
- 5.1.3. Cantilever
- 5.1.4. Speciality
- 5.1.5. Other Technologies
- 5.2. Market Analysis, Insights and Forecast - by Application
- 5.2.1. DRAM
- 5.2.2. Flash
- 5.2.3. Foundry and Logic
- 5.2.4. Parametric
- 5.2.5. Other Applications
- 5.3. Market Analysis, Insights and Forecast - by Type
- 5.3.1. Standard Probe Card
- 5.3.2. Advanced Probe Card
- 5.4. Market Analysis, Insights and Forecast - by Region
- 5.4.1. North America
- 5.4.2. Europe
- 5.4.3. Asia
- 5.4.4. Australia and New Zealand
- 5.4.5. Latin America
- 5.4.6. Middle East and Africa
- 5.1. Market Analysis, Insights and Forecast - by Technology
- 6. North America Probe Card Market Analysis, Insights and Forecast, 2019-2031
- 6.1. Market Analysis, Insights and Forecast - by Technology
- 6.1.1. MEMS
- 6.1.2. Vertical
- 6.1.3. Cantilever
- 6.1.4. Speciality
- 6.1.5. Other Technologies
- 6.2. Market Analysis, Insights and Forecast - by Application
- 6.2.1. DRAM
- 6.2.2. Flash
- 6.2.3. Foundry and Logic
- 6.2.4. Parametric
- 6.2.5. Other Applications
- 6.3. Market Analysis, Insights and Forecast - by Type
- 6.3.1. Standard Probe Card
- 6.3.2. Advanced Probe Card
- 6.1. Market Analysis, Insights and Forecast - by Technology
- 7. Europe Probe Card Market Analysis, Insights and Forecast, 2019-2031
- 7.1. Market Analysis, Insights and Forecast - by Technology
- 7.1.1. MEMS
- 7.1.2. Vertical
- 7.1.3. Cantilever
- 7.1.4. Speciality
- 7.1.5. Other Technologies
- 7.2. Market Analysis, Insights and Forecast - by Application
- 7.2.1. DRAM
- 7.2.2. Flash
- 7.2.3. Foundry and Logic
- 7.2.4. Parametric
- 7.2.5. Other Applications
- 7.3. Market Analysis, Insights and Forecast - by Type
- 7.3.1. Standard Probe Card
- 7.3.2. Advanced Probe Card
- 7.1. Market Analysis, Insights and Forecast - by Technology
- 8. Asia Probe Card Market Analysis, Insights and Forecast, 2019-2031
- 8.1. Market Analysis, Insights and Forecast - by Technology
- 8.1.1. MEMS
- 8.1.2. Vertical
- 8.1.3. Cantilever
- 8.1.4. Speciality
- 8.1.5. Other Technologies
- 8.2. Market Analysis, Insights and Forecast - by Application
- 8.2.1. DRAM
- 8.2.2. Flash
- 8.2.3. Foundry and Logic
- 8.2.4. Parametric
- 8.2.5. Other Applications
- 8.3. Market Analysis, Insights and Forecast - by Type
- 8.3.1. Standard Probe Card
- 8.3.2. Advanced Probe Card
- 8.1. Market Analysis, Insights and Forecast - by Technology
- 9. Australia and New Zealand Probe Card Market Analysis, Insights and Forecast, 2019-2031
- 9.1. Market Analysis, Insights and Forecast - by Technology
- 9.1.1. MEMS
- 9.1.2. Vertical
- 9.1.3. Cantilever
- 9.1.4. Speciality
- 9.1.5. Other Technologies
- 9.2. Market Analysis, Insights and Forecast - by Application
- 9.2.1. DRAM
- 9.2.2. Flash
- 9.2.3. Foundry and Logic
- 9.2.4. Parametric
- 9.2.5. Other Applications
- 9.3. Market Analysis, Insights and Forecast - by Type
- 9.3.1. Standard Probe Card
- 9.3.2. Advanced Probe Card
- 9.1. Market Analysis, Insights and Forecast - by Technology
- 10. Latin America Probe Card Market Analysis, Insights and Forecast, 2019-2031
- 10.1. Market Analysis, Insights and Forecast - by Technology
- 10.1.1. MEMS
- 10.1.2. Vertical
- 10.1.3. Cantilever
- 10.1.4. Speciality
- 10.1.5. Other Technologies
- 10.2. Market Analysis, Insights and Forecast - by Application
- 10.2.1. DRAM
- 10.2.2. Flash
- 10.2.3. Foundry and Logic
- 10.2.4. Parametric
- 10.2.5. Other Applications
- 10.3. Market Analysis, Insights and Forecast - by Type
- 10.3.1. Standard Probe Card
- 10.3.2. Advanced Probe Card
- 10.1. Market Analysis, Insights and Forecast - by Technology
- 11. Middle East and Africa Probe Card Market Analysis, Insights and Forecast, 2019-2031
- 11.1. Market Analysis, Insights and Forecast - by Technology
- 11.1.1. MEMS
- 11.1.2. Vertical
- 11.1.3. Cantilever
- 11.1.4. Speciality
- 11.1.5. Other Technologies
- 11.2. Market Analysis, Insights and Forecast - by Application
- 11.2.1. DRAM
- 11.2.2. Flash
- 11.2.3. Foundry and Logic
- 11.2.4. Parametric
- 11.2.5. Other Applications
- 11.3. Market Analysis, Insights and Forecast - by Type
- 11.3.1. Standard Probe Card
- 11.3.2. Advanced Probe Card
- 11.1. Market Analysis, Insights and Forecast - by Technology
- 12. North America Probe Card Market Analysis, Insights and Forecast, 2019-2031
- 12.1. Market Analysis, Insights and Forecast - By Country/Sub-region
- 12.1.1 United States
- 12.1.2 Canada
- 12.1.3 Mexico
- 13. Europe Probe Card Market Analysis, Insights and Forecast, 2019-2031
- 13.1. Market Analysis, Insights and Forecast - By Country/Sub-region
- 13.1.1 Germany
- 13.1.2 United Kingdom
- 13.1.3 France
- 13.1.4 Spain
- 13.1.5 Italy
- 13.1.6 Spain
- 13.1.7 Belgium
- 13.1.8 Netherland
- 13.1.9 Nordics
- 13.1.10 Rest of Europe
- 14. Asia Pacific Probe Card Market Analysis, Insights and Forecast, 2019-2031
- 14.1. Market Analysis, Insights and Forecast - By Country/Sub-region
- 14.1.1 China
- 14.1.2 Japan
- 14.1.3 India
- 14.1.4 South Korea
- 14.1.5 Southeast Asia
- 14.1.6 Australia
- 14.1.7 Indonesia
- 14.1.8 Phillipes
- 14.1.9 Singapore
- 14.1.10 Thailandc
- 14.1.11 Rest of Asia Pacific
- 15. South America Probe Card Market Analysis, Insights and Forecast, 2019-2031
- 15.1. Market Analysis, Insights and Forecast - By Country/Sub-region
- 15.1.1 Brazil
- 15.1.2 Argentina
- 15.1.3 Peru
- 15.1.4 Chile
- 15.1.5 Colombia
- 15.1.6 Ecuador
- 15.1.7 Venezuela
- 15.1.8 Rest of South America
- 16. North America Probe Card Market Analysis, Insights and Forecast, 2019-2031
- 16.1. Market Analysis, Insights and Forecast - By Country/Sub-region
- 16.1.1 United States
- 16.1.2 Canada
- 16.1.3 Mexico
- 17. MEA Probe Card Market Analysis, Insights and Forecast, 2019-2031
- 17.1. Market Analysis, Insights and Forecast - By Country/Sub-region
- 17.1.1 United Arab Emirates
- 17.1.2 Saudi Arabia
- 17.1.3 South Africa
- 17.1.4 Rest of Middle East and Africa
- 18. Competitive Analysis
- 18.1. Global Market Share Analysis 2024
- 18.2. Company Profiles
- 18.2.1 Nidec SV Probe
- 18.2.1.1. Overview
- 18.2.1.2. Products
- 18.2.1.3. SWOT Analysis
- 18.2.1.4. Recent Developments
- 18.2.1.5. Financials (Based on Availability)
- 18.2.2 Protec Mems Technology
- 18.2.2.1. Overview
- 18.2.2.2. Products
- 18.2.2.3. SWOT Analysis
- 18.2.2.4. Recent Developments
- 18.2.2.5. Financials (Based on Availability)
- 18.2.3 Willtechnology Co Ltd
- 18.2.3.1. Overview
- 18.2.3.2. Products
- 18.2.3.3. SWOT Analysis
- 18.2.3.4. Recent Developments
- 18.2.3.5. Financials (Based on Availability)
- 18.2.4 Formfactor Inc
- 18.2.4.1. Overview
- 18.2.4.2. Products
- 18.2.4.3. SWOT Analysis
- 18.2.4.4. Recent Developments
- 18.2.4.5. Financials (Based on Availability)
- 18.2.5 Wentworth Laboratories Inc
- 18.2.5.1. Overview
- 18.2.5.2. Products
- 18.2.5.3. SWOT Analysis
- 18.2.5.4. Recent Developments
- 18.2.5.5. Financials (Based on Availability)
- 18.2.6 Japan Electronic Materials Corporation
- 18.2.6.1. Overview
- 18.2.6.2. Products
- 18.2.6.3. SWOT Analysis
- 18.2.6.4. Recent Developments
- 18.2.6.5. Financials (Based on Availability)
- 18.2.7 Micronics Japan Co Ltd
- 18.2.7.1. Overview
- 18.2.7.2. Products
- 18.2.7.3. SWOT Analysis
- 18.2.7.4. Recent Developments
- 18.2.7.5. Financials (Based on Availability)
- 18.2.8 TSE Co Lt
- 18.2.8.1. Overview
- 18.2.8.2. Products
- 18.2.8.3. SWOT Analysis
- 18.2.8.4. Recent Developments
- 18.2.8.5. Financials (Based on Availability)
- 18.2.9 Feinmetall Gmbh
- 18.2.9.1. Overview
- 18.2.9.2. Products
- 18.2.9.3. SWOT Analysis
- 18.2.9.4. Recent Developments
- 18.2.9.5. Financials (Based on Availability)
- 18.2.10 Star Technologies Inc
- 18.2.10.1. Overview
- 18.2.10.2. Products
- 18.2.10.3. SWOT Analysis
- 18.2.10.4. Recent Developments
- 18.2.10.5. Financials (Based on Availability)
- 18.2.11 Technoprobe S P A
- 18.2.11.1. Overview
- 18.2.11.2. Products
- 18.2.11.3. SWOT Analysis
- 18.2.11.4. Recent Developments
- 18.2.11.5. Financials (Based on Availability)
- 18.2.12 Mpi Corporation
- 18.2.12.1. Overview
- 18.2.12.2. Products
- 18.2.12.3. SWOT Analysis
- 18.2.12.4. Recent Developments
- 18.2.12.5. Financials (Based on Availability)
- 18.2.13 GGB Industries Inc
- 18.2.13.1. Overview
- 18.2.13.2. Products
- 18.2.13.3. SWOT Analysis
- 18.2.13.4. Recent Developments
- 18.2.13.5. Financials (Based on Availability)
- 18.2.14 Korea Instruments Co Ltd
- 18.2.14.1. Overview
- 18.2.14.2. Products
- 18.2.14.3. SWOT Analysis
- 18.2.14.4. Recent Developments
- 18.2.14.5. Financials (Based on Availability)
- 18.2.1 Nidec SV Probe
List of Figures
- Figure 1: Global Probe Card Market Revenue Breakdown (Million, %) by Region 2024 & 2032
- Figure 2: Global Probe Card Market Volume Breakdown (K Unit, %) by Region 2024 & 2032
- Figure 3: North America Probe Card Market Revenue (Million), by Country 2024 & 2032
- Figure 4: North America Probe Card Market Volume (K Unit), by Country 2024 & 2032
- Figure 5: North America Probe Card Market Revenue Share (%), by Country 2024 & 2032
- Figure 6: North America Probe Card Market Volume Share (%), by Country 2024 & 2032
- Figure 7: Europe Probe Card Market Revenue (Million), by Country 2024 & 2032
- Figure 8: Europe Probe Card Market Volume (K Unit), by Country 2024 & 2032
- Figure 9: Europe Probe Card Market Revenue Share (%), by Country 2024 & 2032
- Figure 10: Europe Probe Card Market Volume Share (%), by Country 2024 & 2032
- Figure 11: Asia Pacific Probe Card Market Revenue (Million), by Country 2024 & 2032
- Figure 12: Asia Pacific Probe Card Market Volume (K Unit), by Country 2024 & 2032
- Figure 13: Asia Pacific Probe Card Market Revenue Share (%), by Country 2024 & 2032
- Figure 14: Asia Pacific Probe Card Market Volume Share (%), by Country 2024 & 2032
- Figure 15: South America Probe Card Market Revenue (Million), by Country 2024 & 2032
- Figure 16: South America Probe Card Market Volume (K Unit), by Country 2024 & 2032
- Figure 17: South America Probe Card Market Revenue Share (%), by Country 2024 & 2032
- Figure 18: South America Probe Card Market Volume Share (%), by Country 2024 & 2032
- Figure 19: North America Probe Card Market Revenue (Million), by Country 2024 & 2032
- Figure 20: North America Probe Card Market Volume (K Unit), by Country 2024 & 2032
- Figure 21: North America Probe Card Market Revenue Share (%), by Country 2024 & 2032
- Figure 22: North America Probe Card Market Volume Share (%), by Country 2024 & 2032
- Figure 23: MEA Probe Card Market Revenue (Million), by Country 2024 & 2032
- Figure 24: MEA Probe Card Market Volume (K Unit), by Country 2024 & 2032
- Figure 25: MEA Probe Card Market Revenue Share (%), by Country 2024 & 2032
- Figure 26: MEA Probe Card Market Volume Share (%), by Country 2024 & 2032
- Figure 27: North America Probe Card Market Revenue (Million), by Technology 2024 & 2032
- Figure 28: North America Probe Card Market Volume (K Unit), by Technology 2024 & 2032
- Figure 29: North America Probe Card Market Revenue Share (%), by Technology 2024 & 2032
- Figure 30: North America Probe Card Market Volume Share (%), by Technology 2024 & 2032
- Figure 31: North America Probe Card Market Revenue (Million), by Application 2024 & 2032
- Figure 32: North America Probe Card Market Volume (K Unit), by Application 2024 & 2032
- Figure 33: North America Probe Card Market Revenue Share (%), by Application 2024 & 2032
- Figure 34: North America Probe Card Market Volume Share (%), by Application 2024 & 2032
- Figure 35: North America Probe Card Market Revenue (Million), by Type 2024 & 2032
- Figure 36: North America Probe Card Market Volume (K Unit), by Type 2024 & 2032
- Figure 37: North America Probe Card Market Revenue Share (%), by Type 2024 & 2032
- Figure 38: North America Probe Card Market Volume Share (%), by Type 2024 & 2032
- Figure 39: North America Probe Card Market Revenue (Million), by Country 2024 & 2032
- Figure 40: North America Probe Card Market Volume (K Unit), by Country 2024 & 2032
- Figure 41: North America Probe Card Market Revenue Share (%), by Country 2024 & 2032
- Figure 42: North America Probe Card Market Volume Share (%), by Country 2024 & 2032
- Figure 43: Europe Probe Card Market Revenue (Million), by Technology 2024 & 2032
- Figure 44: Europe Probe Card Market Volume (K Unit), by Technology 2024 & 2032
- Figure 45: Europe Probe Card Market Revenue Share (%), by Technology 2024 & 2032
- Figure 46: Europe Probe Card Market Volume Share (%), by Technology 2024 & 2032
- Figure 47: Europe Probe Card Market Revenue (Million), by Application 2024 & 2032
- Figure 48: Europe Probe Card Market Volume (K Unit), by Application 2024 & 2032
- Figure 49: Europe Probe Card Market Revenue Share (%), by Application 2024 & 2032
- Figure 50: Europe Probe Card Market Volume Share (%), by Application 2024 & 2032
- Figure 51: Europe Probe Card Market Revenue (Million), by Type 2024 & 2032
- Figure 52: Europe Probe Card Market Volume (K Unit), by Type 2024 & 2032
- Figure 53: Europe Probe Card Market Revenue Share (%), by Type 2024 & 2032
- Figure 54: Europe Probe Card Market Volume Share (%), by Type 2024 & 2032
- Figure 55: Europe Probe Card Market Revenue (Million), by Country 2024 & 2032
- Figure 56: Europe Probe Card Market Volume (K Unit), by Country 2024 & 2032
- Figure 57: Europe Probe Card Market Revenue Share (%), by Country 2024 & 2032
- Figure 58: Europe Probe Card Market Volume Share (%), by Country 2024 & 2032
- Figure 59: Asia Probe Card Market Revenue (Million), by Technology 2024 & 2032
- Figure 60: Asia Probe Card Market Volume (K Unit), by Technology 2024 & 2032
- Figure 61: Asia Probe Card Market Revenue Share (%), by Technology 2024 & 2032
- Figure 62: Asia Probe Card Market Volume Share (%), by Technology 2024 & 2032
- Figure 63: Asia Probe Card Market Revenue (Million), by Application 2024 & 2032
- Figure 64: Asia Probe Card Market Volume (K Unit), by Application 2024 & 2032
- Figure 65: Asia Probe Card Market Revenue Share (%), by Application 2024 & 2032
- Figure 66: Asia Probe Card Market Volume Share (%), by Application 2024 & 2032
- Figure 67: Asia Probe Card Market Revenue (Million), by Type 2024 & 2032
- Figure 68: Asia Probe Card Market Volume (K Unit), by Type 2024 & 2032
- Figure 69: Asia Probe Card Market Revenue Share (%), by Type 2024 & 2032
- Figure 70: Asia Probe Card Market Volume Share (%), by Type 2024 & 2032
- Figure 71: Asia Probe Card Market Revenue (Million), by Country 2024 & 2032
- Figure 72: Asia Probe Card Market Volume (K Unit), by Country 2024 & 2032
- Figure 73: Asia Probe Card Market Revenue Share (%), by Country 2024 & 2032
- Figure 74: Asia Probe Card Market Volume Share (%), by Country 2024 & 2032
- Figure 75: Australia and New Zealand Probe Card Market Revenue (Million), by Technology 2024 & 2032
- Figure 76: Australia and New Zealand Probe Card Market Volume (K Unit), by Technology 2024 & 2032
- Figure 77: Australia and New Zealand Probe Card Market Revenue Share (%), by Technology 2024 & 2032
- Figure 78: Australia and New Zealand Probe Card Market Volume Share (%), by Technology 2024 & 2032
- Figure 79: Australia and New Zealand Probe Card Market Revenue (Million), by Application 2024 & 2032
- Figure 80: Australia and New Zealand Probe Card Market Volume (K Unit), by Application 2024 & 2032
- Figure 81: Australia and New Zealand Probe Card Market Revenue Share (%), by Application 2024 & 2032
- Figure 82: Australia and New Zealand Probe Card Market Volume Share (%), by Application 2024 & 2032
- Figure 83: Australia and New Zealand Probe Card Market Revenue (Million), by Type 2024 & 2032
- Figure 84: Australia and New Zealand Probe Card Market Volume (K Unit), by Type 2024 & 2032
- Figure 85: Australia and New Zealand Probe Card Market Revenue Share (%), by Type 2024 & 2032
- Figure 86: Australia and New Zealand Probe Card Market Volume Share (%), by Type 2024 & 2032
- Figure 87: Australia and New Zealand Probe Card Market Revenue (Million), by Country 2024 & 2032
- Figure 88: Australia and New Zealand Probe Card Market Volume (K Unit), by Country 2024 & 2032
- Figure 89: Australia and New Zealand Probe Card Market Revenue Share (%), by Country 2024 & 2032
- Figure 90: Australia and New Zealand Probe Card Market Volume Share (%), by Country 2024 & 2032
- Figure 91: Latin America Probe Card Market Revenue (Million), by Technology 2024 & 2032
- Figure 92: Latin America Probe Card Market Volume (K Unit), by Technology 2024 & 2032
- Figure 93: Latin America Probe Card Market Revenue Share (%), by Technology 2024 & 2032
- Figure 94: Latin America Probe Card Market Volume Share (%), by Technology 2024 & 2032
- Figure 95: Latin America Probe Card Market Revenue (Million), by Application 2024 & 2032
- Figure 96: Latin America Probe Card Market Volume (K Unit), by Application 2024 & 2032
- Figure 97: Latin America Probe Card Market Revenue Share (%), by Application 2024 & 2032
- Figure 98: Latin America Probe Card Market Volume Share (%), by Application 2024 & 2032
- Figure 99: Latin America Probe Card Market Revenue (Million), by Type 2024 & 2032
- Figure 100: Latin America Probe Card Market Volume (K Unit), by Type 2024 & 2032
- Figure 101: Latin America Probe Card Market Revenue Share (%), by Type 2024 & 2032
- Figure 102: Latin America Probe Card Market Volume Share (%), by Type 2024 & 2032
- Figure 103: Latin America Probe Card Market Revenue (Million), by Country 2024 & 2032
- Figure 104: Latin America Probe Card Market Volume (K Unit), by Country 2024 & 2032
- Figure 105: Latin America Probe Card Market Revenue Share (%), by Country 2024 & 2032
- Figure 106: Latin America Probe Card Market Volume Share (%), by Country 2024 & 2032
- Figure 107: Middle East and Africa Probe Card Market Revenue (Million), by Technology 2024 & 2032
- Figure 108: Middle East and Africa Probe Card Market Volume (K Unit), by Technology 2024 & 2032
- Figure 109: Middle East and Africa Probe Card Market Revenue Share (%), by Technology 2024 & 2032
- Figure 110: Middle East and Africa Probe Card Market Volume Share (%), by Technology 2024 & 2032
- Figure 111: Middle East and Africa Probe Card Market Revenue (Million), by Application 2024 & 2032
- Figure 112: Middle East and Africa Probe Card Market Volume (K Unit), by Application 2024 & 2032
- Figure 113: Middle East and Africa Probe Card Market Revenue Share (%), by Application 2024 & 2032
- Figure 114: Middle East and Africa Probe Card Market Volume Share (%), by Application 2024 & 2032
- Figure 115: Middle East and Africa Probe Card Market Revenue (Million), by Type 2024 & 2032
- Figure 116: Middle East and Africa Probe Card Market Volume (K Unit), by Type 2024 & 2032
- Figure 117: Middle East and Africa Probe Card Market Revenue Share (%), by Type 2024 & 2032
- Figure 118: Middle East and Africa Probe Card Market Volume Share (%), by Type 2024 & 2032
- Figure 119: Middle East and Africa Probe Card Market Revenue (Million), by Country 2024 & 2032
- Figure 120: Middle East and Africa Probe Card Market Volume (K Unit), by Country 2024 & 2032
- Figure 121: Middle East and Africa Probe Card Market Revenue Share (%), by Country 2024 & 2032
- Figure 122: Middle East and Africa Probe Card Market Volume Share (%), by Country 2024 & 2032
List of Tables
- Table 1: Global Probe Card Market Revenue Million Forecast, by Region 2019 & 2032
- Table 2: Global Probe Card Market Volume K Unit Forecast, by Region 2019 & 2032
- Table 3: Global Probe Card Market Revenue Million Forecast, by Technology 2019 & 2032
- Table 4: Global Probe Card Market Volume K Unit Forecast, by Technology 2019 & 2032
- Table 5: Global Probe Card Market Revenue Million Forecast, by Application 2019 & 2032
- Table 6: Global Probe Card Market Volume K Unit Forecast, by Application 2019 & 2032
- Table 7: Global Probe Card Market Revenue Million Forecast, by Type 2019 & 2032
- Table 8: Global Probe Card Market Volume K Unit Forecast, by Type 2019 & 2032
- Table 9: Global Probe Card Market Revenue Million Forecast, by Region 2019 & 2032
- Table 10: Global Probe Card Market Volume K Unit Forecast, by Region 2019 & 2032
- Table 11: Global Probe Card Market Revenue Million Forecast, by Country 2019 & 2032
- Table 12: Global Probe Card Market Volume K Unit Forecast, by Country 2019 & 2032
- Table 13: United States Probe Card Market Revenue (Million) Forecast, by Application 2019 & 2032
- Table 14: United States Probe Card Market Volume (K Unit) Forecast, by Application 2019 & 2032
- Table 15: Canada Probe Card Market Revenue (Million) Forecast, by Application 2019 & 2032
- Table 16: Canada Probe Card Market Volume (K Unit) Forecast, by Application 2019 & 2032
- Table 17: Mexico Probe Card Market Revenue (Million) Forecast, by Application 2019 & 2032
- Table 18: Mexico Probe Card Market Volume (K Unit) Forecast, by Application 2019 & 2032
- Table 19: Global Probe Card Market Revenue Million Forecast, by Country 2019 & 2032
- Table 20: Global Probe Card Market Volume K Unit Forecast, by Country 2019 & 2032
- Table 21: Germany Probe Card Market Revenue (Million) Forecast, by Application 2019 & 2032
- Table 22: Germany Probe Card Market Volume (K Unit) Forecast, by Application 2019 & 2032
- Table 23: United Kingdom Probe Card Market Revenue (Million) Forecast, by Application 2019 & 2032
- Table 24: United Kingdom Probe Card Market Volume (K Unit) Forecast, by Application 2019 & 2032
- Table 25: France Probe Card Market Revenue (Million) Forecast, by Application 2019 & 2032
- Table 26: France Probe Card Market Volume (K Unit) Forecast, by Application 2019 & 2032
- Table 27: Spain Probe Card Market Revenue (Million) Forecast, by Application 2019 & 2032
- Table 28: Spain Probe Card Market Volume (K Unit) Forecast, by Application 2019 & 2032
- Table 29: Italy Probe Card Market Revenue (Million) Forecast, by Application 2019 & 2032
- Table 30: Italy Probe Card Market Volume (K Unit) Forecast, by Application 2019 & 2032
- Table 31: Spain Probe Card Market Revenue (Million) Forecast, by Application 2019 & 2032
- Table 32: Spain Probe Card Market Volume (K Unit) Forecast, by Application 2019 & 2032
- Table 33: Belgium Probe Card Market Revenue (Million) Forecast, by Application 2019 & 2032
- Table 34: Belgium Probe Card Market Volume (K Unit) Forecast, by Application 2019 & 2032
- Table 35: Netherland Probe Card Market Revenue (Million) Forecast, by Application 2019 & 2032
- Table 36: Netherland Probe Card Market Volume (K Unit) Forecast, by Application 2019 & 2032
- Table 37: Nordics Probe Card Market Revenue (Million) Forecast, by Application 2019 & 2032
- Table 38: Nordics Probe Card Market Volume (K Unit) Forecast, by Application 2019 & 2032
- Table 39: Rest of Europe Probe Card Market Revenue (Million) Forecast, by Application 2019 & 2032
- Table 40: Rest of Europe Probe Card Market Volume (K Unit) Forecast, by Application 2019 & 2032
- Table 41: Global Probe Card Market Revenue Million Forecast, by Country 2019 & 2032
- Table 42: Global Probe Card Market Volume K Unit Forecast, by Country 2019 & 2032
- Table 43: China Probe Card Market Revenue (Million) Forecast, by Application 2019 & 2032
- Table 44: China Probe Card Market Volume (K Unit) Forecast, by Application 2019 & 2032
- Table 45: Japan Probe Card Market Revenue (Million) Forecast, by Application 2019 & 2032
- Table 46: Japan Probe Card Market Volume (K Unit) Forecast, by Application 2019 & 2032
- Table 47: India Probe Card Market Revenue (Million) Forecast, by Application 2019 & 2032
- Table 48: India Probe Card Market Volume (K Unit) Forecast, by Application 2019 & 2032
- Table 49: South Korea Probe Card Market Revenue (Million) Forecast, by Application 2019 & 2032
- Table 50: South Korea Probe Card Market Volume (K Unit) Forecast, by Application 2019 & 2032
- Table 51: Southeast Asia Probe Card Market Revenue (Million) Forecast, by Application 2019 & 2032
- Table 52: Southeast Asia Probe Card Market Volume (K Unit) Forecast, by Application 2019 & 2032
- Table 53: Australia Probe Card Market Revenue (Million) Forecast, by Application 2019 & 2032
- Table 54: Australia Probe Card Market Volume (K Unit) Forecast, by Application 2019 & 2032
- Table 55: Indonesia Probe Card Market Revenue (Million) Forecast, by Application 2019 & 2032
- Table 56: Indonesia Probe Card Market Volume (K Unit) Forecast, by Application 2019 & 2032
- Table 57: Phillipes Probe Card Market Revenue (Million) Forecast, by Application 2019 & 2032
- Table 58: Phillipes Probe Card Market Volume (K Unit) Forecast, by Application 2019 & 2032
- Table 59: Singapore Probe Card Market Revenue (Million) Forecast, by Application 2019 & 2032
- Table 60: Singapore Probe Card Market Volume (K Unit) Forecast, by Application 2019 & 2032
- Table 61: Thailandc Probe Card Market Revenue (Million) Forecast, by Application 2019 & 2032
- Table 62: Thailandc Probe Card Market Volume (K Unit) Forecast, by Application 2019 & 2032
- Table 63: Rest of Asia Pacific Probe Card Market Revenue (Million) Forecast, by Application 2019 & 2032
- Table 64: Rest of Asia Pacific Probe Card Market Volume (K Unit) Forecast, by Application 2019 & 2032
- Table 65: Global Probe Card Market Revenue Million Forecast, by Country 2019 & 2032
- Table 66: Global Probe Card Market Volume K Unit Forecast, by Country 2019 & 2032
- Table 67: Brazil Probe Card Market Revenue (Million) Forecast, by Application 2019 & 2032
- Table 68: Brazil Probe Card Market Volume (K Unit) Forecast, by Application 2019 & 2032
- Table 69: Argentina Probe Card Market Revenue (Million) Forecast, by Application 2019 & 2032
- Table 70: Argentina Probe Card Market Volume (K Unit) Forecast, by Application 2019 & 2032
- Table 71: Peru Probe Card Market Revenue (Million) Forecast, by Application 2019 & 2032
- Table 72: Peru Probe Card Market Volume (K Unit) Forecast, by Application 2019 & 2032
- Table 73: Chile Probe Card Market Revenue (Million) Forecast, by Application 2019 & 2032
- Table 74: Chile Probe Card Market Volume (K Unit) Forecast, by Application 2019 & 2032
- Table 75: Colombia Probe Card Market Revenue (Million) Forecast, by Application 2019 & 2032
- Table 76: Colombia Probe Card Market Volume (K Unit) Forecast, by Application 2019 & 2032
- Table 77: Ecuador Probe Card Market Revenue (Million) Forecast, by Application 2019 & 2032
- Table 78: Ecuador Probe Card Market Volume (K Unit) Forecast, by Application 2019 & 2032
- Table 79: Venezuela Probe Card Market Revenue (Million) Forecast, by Application 2019 & 2032
- Table 80: Venezuela Probe Card Market Volume (K Unit) Forecast, by Application 2019 & 2032
- Table 81: Rest of South America Probe Card Market Revenue (Million) Forecast, by Application 2019 & 2032
- Table 82: Rest of South America Probe Card Market Volume (K Unit) Forecast, by Application 2019 & 2032
- Table 83: Global Probe Card Market Revenue Million Forecast, by Country 2019 & 2032
- Table 84: Global Probe Card Market Volume K Unit Forecast, by Country 2019 & 2032
- Table 85: United States Probe Card Market Revenue (Million) Forecast, by Application 2019 & 2032
- Table 86: United States Probe Card Market Volume (K Unit) Forecast, by Application 2019 & 2032
- Table 87: Canada Probe Card Market Revenue (Million) Forecast, by Application 2019 & 2032
- Table 88: Canada Probe Card Market Volume (K Unit) Forecast, by Application 2019 & 2032
- Table 89: Mexico Probe Card Market Revenue (Million) Forecast, by Application 2019 & 2032
- Table 90: Mexico Probe Card Market Volume (K Unit) Forecast, by Application 2019 & 2032
- Table 91: Global Probe Card Market Revenue Million Forecast, by Country 2019 & 2032
- Table 92: Global Probe Card Market Volume K Unit Forecast, by Country 2019 & 2032
- Table 93: United Arab Emirates Probe Card Market Revenue (Million) Forecast, by Application 2019 & 2032
- Table 94: United Arab Emirates Probe Card Market Volume (K Unit) Forecast, by Application 2019 & 2032
- Table 95: Saudi Arabia Probe Card Market Revenue (Million) Forecast, by Application 2019 & 2032
- Table 96: Saudi Arabia Probe Card Market Volume (K Unit) Forecast, by Application 2019 & 2032
- Table 97: South Africa Probe Card Market Revenue (Million) Forecast, by Application 2019 & 2032
- Table 98: South Africa Probe Card Market Volume (K Unit) Forecast, by Application 2019 & 2032
- Table 99: Rest of Middle East and Africa Probe Card Market Revenue (Million) Forecast, by Application 2019 & 2032
- Table 100: Rest of Middle East and Africa Probe Card Market Volume (K Unit) Forecast, by Application 2019 & 2032
- Table 101: Global Probe Card Market Revenue Million Forecast, by Technology 2019 & 2032
- Table 102: Global Probe Card Market Volume K Unit Forecast, by Technology 2019 & 2032
- Table 103: Global Probe Card Market Revenue Million Forecast, by Application 2019 & 2032
- Table 104: Global Probe Card Market Volume K Unit Forecast, by Application 2019 & 2032
- Table 105: Global Probe Card Market Revenue Million Forecast, by Type 2019 & 2032
- Table 106: Global Probe Card Market Volume K Unit Forecast, by Type 2019 & 2032
- Table 107: Global Probe Card Market Revenue Million Forecast, by Country 2019 & 2032
- Table 108: Global Probe Card Market Volume K Unit Forecast, by Country 2019 & 2032
- Table 109: Global Probe Card Market Revenue Million Forecast, by Technology 2019 & 2032
- Table 110: Global Probe Card Market Volume K Unit Forecast, by Technology 2019 & 2032
- Table 111: Global Probe Card Market Revenue Million Forecast, by Application 2019 & 2032
- Table 112: Global Probe Card Market Volume K Unit Forecast, by Application 2019 & 2032
- Table 113: Global Probe Card Market Revenue Million Forecast, by Type 2019 & 2032
- Table 114: Global Probe Card Market Volume K Unit Forecast, by Type 2019 & 2032
- Table 115: Global Probe Card Market Revenue Million Forecast, by Country 2019 & 2032
- Table 116: Global Probe Card Market Volume K Unit Forecast, by Country 2019 & 2032
- Table 117: Global Probe Card Market Revenue Million Forecast, by Technology 2019 & 2032
- Table 118: Global Probe Card Market Volume K Unit Forecast, by Technology 2019 & 2032
- Table 119: Global Probe Card Market Revenue Million Forecast, by Application 2019 & 2032
- Table 120: Global Probe Card Market Volume K Unit Forecast, by Application 2019 & 2032
- Table 121: Global Probe Card Market Revenue Million Forecast, by Type 2019 & 2032
- Table 122: Global Probe Card Market Volume K Unit Forecast, by Type 2019 & 2032
- Table 123: Global Probe Card Market Revenue Million Forecast, by Country 2019 & 2032
- Table 124: Global Probe Card Market Volume K Unit Forecast, by Country 2019 & 2032
- Table 125: Global Probe Card Market Revenue Million Forecast, by Technology 2019 & 2032
- Table 126: Global Probe Card Market Volume K Unit Forecast, by Technology 2019 & 2032
- Table 127: Global Probe Card Market Revenue Million Forecast, by Application 2019 & 2032
- Table 128: Global Probe Card Market Volume K Unit Forecast, by Application 2019 & 2032
- Table 129: Global Probe Card Market Revenue Million Forecast, by Type 2019 & 2032
- Table 130: Global Probe Card Market Volume K Unit Forecast, by Type 2019 & 2032
- Table 131: Global Probe Card Market Revenue Million Forecast, by Country 2019 & 2032
- Table 132: Global Probe Card Market Volume K Unit Forecast, by Country 2019 & 2032
- Table 133: Global Probe Card Market Revenue Million Forecast, by Technology 2019 & 2032
- Table 134: Global Probe Card Market Volume K Unit Forecast, by Technology 2019 & 2032
- Table 135: Global Probe Card Market Revenue Million Forecast, by Application 2019 & 2032
- Table 136: Global Probe Card Market Volume K Unit Forecast, by Application 2019 & 2032
- Table 137: Global Probe Card Market Revenue Million Forecast, by Type 2019 & 2032
- Table 138: Global Probe Card Market Volume K Unit Forecast, by Type 2019 & 2032
- Table 139: Global Probe Card Market Revenue Million Forecast, by Country 2019 & 2032
- Table 140: Global Probe Card Market Volume K Unit Forecast, by Country 2019 & 2032
- Table 141: Global Probe Card Market Revenue Million Forecast, by Technology 2019 & 2032
- Table 142: Global Probe Card Market Volume K Unit Forecast, by Technology 2019 & 2032
- Table 143: Global Probe Card Market Revenue Million Forecast, by Application 2019 & 2032
- Table 144: Global Probe Card Market Volume K Unit Forecast, by Application 2019 & 2032
- Table 145: Global Probe Card Market Revenue Million Forecast, by Type 2019 & 2032
- Table 146: Global Probe Card Market Volume K Unit Forecast, by Type 2019 & 2032
- Table 147: Global Probe Card Market Revenue Million Forecast, by Country 2019 & 2032
- Table 148: Global Probe Card Market Volume K Unit Forecast, by Country 2019 & 2032
Frequently Asked Questions
1. What is the projected Compound Annual Growth Rate (CAGR) of the Probe Card Market?
The projected CAGR is approximately 10.60%.
2. Which companies are prominent players in the Probe Card Market?
Key companies in the market include Nidec SV Probe, Protec Mems Technology, Willtechnology Co Ltd, Formfactor Inc, Wentworth Laboratories Inc, Japan Electronic Materials Corporation, Micronics Japan Co Ltd, TSE Co Lt, Feinmetall Gmbh, Star Technologies Inc, Technoprobe S P A, Mpi Corporation, GGB Industries Inc, Korea Instruments Co Ltd.
3. What are the main segments of the Probe Card Market?
The market segments include Technology, Application, Type.
4. Can you provide details about the market size?
The market size is estimated to be USD 2.05 Million as of 2022.
5. What are some drivers contributing to market growth?
Increase in Demand for Consumer Electronics and IOT; Miniaturization of Electronic Products; Technological Advancement And Innovations in Semiconductor Industry.
6. What are the notable trends driving market growth?
MEMS to Dominate the Technology Segment.
7. Are there any restraints impacting market growth?
High Costs Associated with Probe Cards; Lack of Awareness Among Consumers Regarding The Benefits of Probe Card Solution.
8. Can you provide examples of recent developments in the market?
April 2024 - FormFactor released a new presentation called COMPASS, focusing on maximizing CCC in a Probe Card and the journey toward an Unburnable Probe. The presentation explores different tactics for probe card design to enhance CCC to achieve an effective CCC above 2.5A at an 80-um minimum pitch. The strategies mentioned involve implementing new probe designs and architectural improvements to maintain probe integrity in high-stress, high-current conditions.
9. What pricing options are available for accessing the report?
Pricing options include single-user, multi-user, and enterprise licenses priced at USD 4750, USD 5250, and USD 8750 respectively.
10. Is the market size provided in terms of value or volume?
The market size is provided in terms of value, measured in Million and volume, measured in K Unit.
11. Are there any specific market keywords associated with the report?
Yes, the market keyword associated with the report is "Probe Card Market," which aids in identifying and referencing the specific market segment covered.
12. How do I determine which pricing option suits my needs best?
The pricing options vary based on user requirements and access needs. Individual users may opt for single-user licenses, while businesses requiring broader access may choose multi-user or enterprise licenses for cost-effective access to the report.
13. Are there any additional resources or data provided in the Probe Card Market report?
While the report offers comprehensive insights, it's advisable to review the specific contents or supplementary materials provided to ascertain if additional resources or data are available.
14. How can I stay updated on further developments or reports in the Probe Card Market?
To stay informed about further developments, trends, and reports in the Probe Card Market, consider subscribing to industry newsletters, following relevant companies and organizations, or regularly checking reputable industry news sources and publications.
Methodology
Step 1 - Identification of Relevant Samples Size from Population Database


Step 2 - Approaches for Defining Global Market Size (Value, Volume* & Price*)

Note*: In applicable scenarios
Step 3 - Data Sources
Primary Research
- Web Analytics
- Survey Reports
- Research Institute
- Latest Research Reports
- Opinion Leaders
Secondary Research
- Annual Reports
- White Paper
- Latest Press Release
- Industry Association
- Paid Database
- Investor Presentations

Step 4 - Data Triangulation
Involves using different sources of information in order to increase the validity of a study
These sources are likely to be stakeholders in a program - participants, other researchers, program staff, other community members, and so on.
Then we put all data in single framework & apply various statistical tools to find out the dynamic on the market.
During the analysis stage, feedback from the stakeholder groups would be compared to determine areas of agreement as well as areas of divergence


