
Key Insights
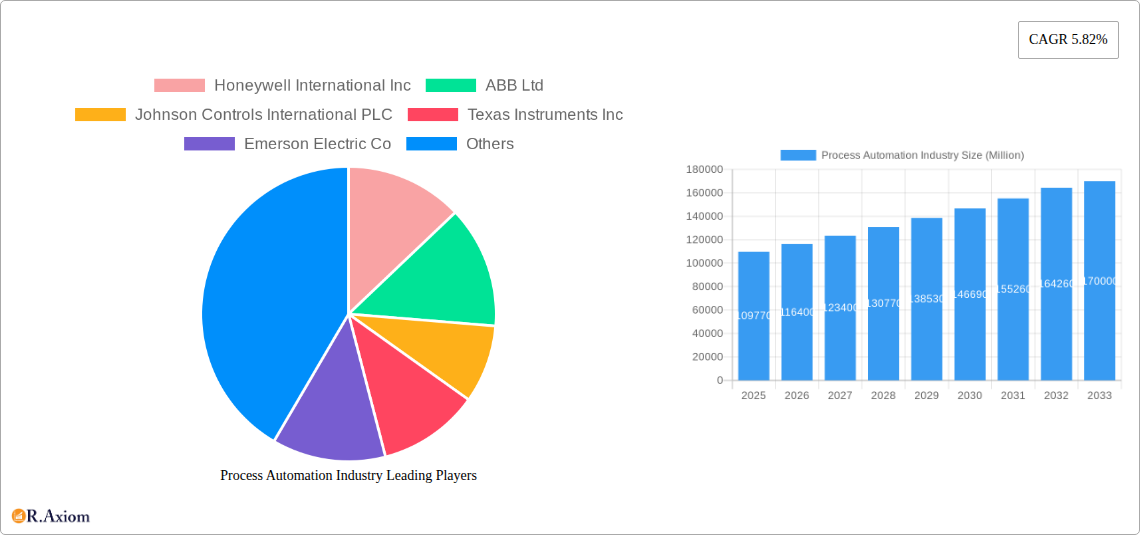
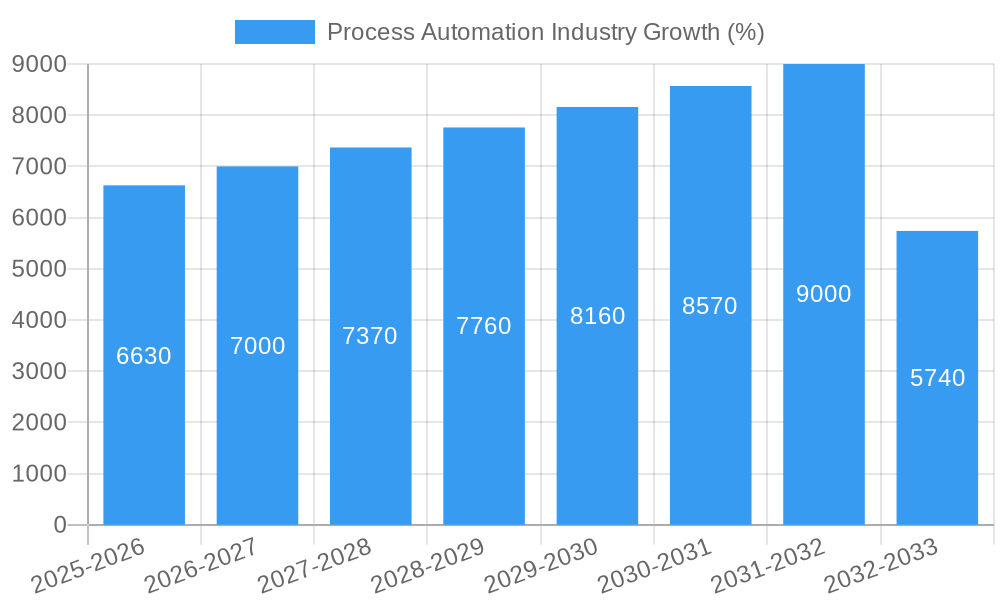
The global process automation market, valued at $109.77 billion in 2025, is projected to experience robust growth, driven by increasing demand for enhanced efficiency, safety, and productivity across diverse industries. A Compound Annual Growth Rate (CAGR) of 5.82% from 2025 to 2033 indicates a significant expansion of the market, reaching an estimated $170 billion by 2033. Key drivers include the rising adoption of Industry 4.0 technologies like Industrial Internet of Things (IIoT), artificial intelligence (AI), and machine learning (ML) for predictive maintenance and optimized operations. The growing emphasis on digital transformation within manufacturing and process industries further fuels market expansion. Specific segments like SCADA, DCS, and MES systems are experiencing accelerated growth due to their ability to provide real-time monitoring, control, and data analytics. Furthermore, the increasing prevalence of wireless communication protocols in industrial settings improves operational flexibility and lowers installation costs. Geographic expansion is another significant trend, with emerging economies in Asia-Pacific showing considerable potential for growth due to increased industrialization and infrastructure development. However, high initial investment costs and concerns about cybersecurity can act as market restraints.
Despite these challenges, the long-term outlook remains positive. The increasing complexity of industrial processes necessitates advanced automation solutions, fostering demand for sophisticated technologies. The chemical and petrochemical, oil and gas, and energy and utilities sectors are expected to remain major contributors to market growth, driven by the need for process optimization, safety enhancements, and environmental regulations compliance. Leading vendors like Honeywell, ABB, Siemens, and Rockwell Automation are strategically investing in research and development to enhance their offerings and strengthen their market positions, further propelling market expansion throughout the forecast period. The diverse range of applications across various end-user industries ensures the continuous evolution and expansion of the process automation market.
Process Automation Industry Market Report: 2019-2033
This comprehensive report provides an in-depth analysis of the global process automation industry, encompassing market size, growth forecasts, key players, technological advancements, and emerging trends. The study period covers 2019-2033, with 2025 as the base and estimated year. The forecast period is 2025-2033, and the historical period is 2019-2024. The report reveals crucial insights for stakeholders, including manufacturers, investors, and end-users, enabling informed strategic decisions in this rapidly evolving market. The total market size in 2025 is estimated at $XX Million.
Process Automation Industry Market Concentration & Innovation
The process automation industry is characterized by a moderately concentrated market structure, with several multinational corporations holding significant market share. Key players like Honeywell International Inc, ABB Ltd, and Siemens Corporation compete intensely, driving innovation and shaping market dynamics. In 2024, the top 5 companies held an estimated 40% market share. Market concentration is influenced by factors such as technological expertise, economies of scale, and global reach. Innovation is driven by the need for enhanced efficiency, improved safety, and reduced operational costs across diverse end-user industries.
- Regulatory Frameworks: Stringent safety and environmental regulations are key drivers of innovation, pushing companies to develop advanced solutions that meet these requirements.
- Product Substitutes: The emergence of alternative technologies like cloud-based solutions and AI-powered systems presents both opportunities and challenges for established players.
- End-User Trends: Growing demand for automation across diverse sectors like energy, pharmaceuticals, and manufacturing fuels industry expansion.
- M&A Activities: The industry has witnessed substantial M&A activity in recent years, with deal values exceeding $XX Million in 2024, primarily focused on expanding product portfolios and geographical reach. Examples include [Specific M&A examples with values, if available, otherwise use "XX Million" as a placeholder].
Process Automation Industry Industry Trends & Insights
The process automation industry is experiencing robust growth, driven by several key factors. The global market is projected to achieve a CAGR of XX% during the forecast period (2025-2033), reaching a value of $XX Million by 2033. This growth is fueled by several factors:
- Technological Disruptions: The increasing adoption of advanced technologies such as Artificial Intelligence (AI), Machine Learning (ML), and Industrial Internet of Things (IIoT) is revolutionizing automation solutions, leading to improved efficiency and productivity. Market penetration of AI in process automation is projected to reach XX% by 2033.
- Market Growth Drivers: Rising demand for improved process efficiency, increased safety standards, and reduced operational costs across various industries are key market drivers. The growing emphasis on sustainability and environmental protection also drives investment in automation solutions.
- Consumer Preferences: End-users are increasingly seeking integrated and customized automation solutions that address their specific needs and optimize operational performance. This demand is driving the development of tailored solutions and service offerings.
- Competitive Dynamics: Intense competition among established players is leading to continuous innovation, product diversification, and strategic partnerships.
Dominant Markets & Segments in Process Automation Industry
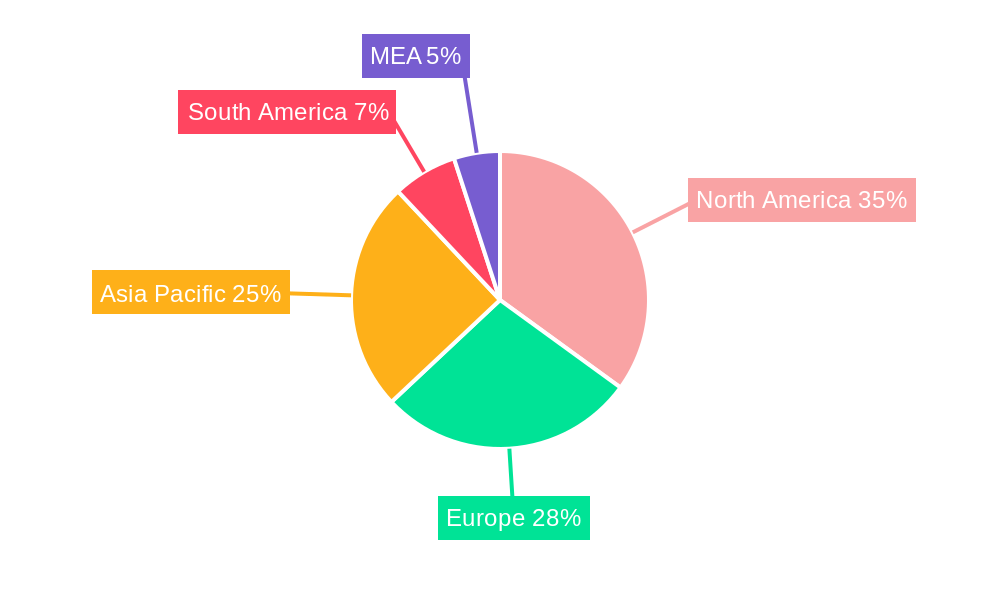
The process automation market exhibits regional variations in growth and dominance. North America and Europe currently hold leading positions, driven by established industrial infrastructure and high adoption rates. However, Asia-Pacific is expected to experience significant growth in the forecast period.
- Dominant System Types: Programmable Logic Controllers (PLCs) and Distributed Control Systems (DCSs) currently dominate the system type segment, owing to their wide applicability and established market presence. However, the Machine Execution System (MES) segment is predicted to show the highest CAGR.
- Dominant Communication Protocols: Wired protocols remain prevalent due to their reliability and established infrastructure. However, wireless protocols are gaining traction, driven by the advantages of flexibility and cost-effectiveness.
- Dominant End-User Industries: The chemical and petrochemical industry is a significant driver of process automation adoption, followed by the energy and utilities sectors. The pharmaceutical industry is another significant adopter, driven by strict regulatory requirements and the need for precise control.
Key Drivers for Dominant Segments:
- Economic policies: Government incentives and investments in automation drive market adoption.
- Infrastructure: Existing robust infrastructure in developed regions supports higher adoption rates.
- Technological advancements: Innovation in specific areas leads to higher adoption in certain segments.
Process Automation Industry Product Developments
Recent product innovations have focused on enhancing functionalities such as predictive maintenance, advanced analytics, and cybersecurity features. These advancements improve operational efficiency, reduce downtime, and ensure data security. The integration of cloud-based platforms and AI/ML algorithms further enhances the capabilities of process automation systems, providing real-time insights and optimizing decision-making. This trend enables businesses to adapt to changing market demands quickly.
Report Scope & Segmentation Analysis
This report segments the process automation market based on System Type (SCADA, PLC, DCS, MES, Valves & Actuators, Electric Motors, HMI, Process Safety Systems, Sensors & Transmitters, Other Systems), Communication Protocol (Wired, Wireless), and End-user Industry (Chemical & Petrochemical, Paper & Pulp, Water & Wastewater Treatment, Energy & Utilities, Oil & Gas, Pharmaceutical, Food & Beverages, Other End-user Industries). Each segment is analyzed based on historical data, current market size, and future growth projections. The competitive landscape within each segment is assessed, highlighting key players and their market strategies. Market size estimations are provided for each segment for the forecast period.
Key Drivers of Process Automation Industry Growth
Several factors fuel process automation market growth: the increasing demand for enhanced operational efficiency and productivity across various industries; stringent safety and environmental regulations; technological advancements; rising energy costs; and the growing adoption of Industry 4.0 technologies. Government initiatives promoting digital transformation are also creating significant growth opportunities.
Challenges in the Process Automation Industry Sector
The industry faces challenges like high initial investment costs, the complexity of implementation, and the need for skilled labor. Supply chain disruptions, cybersecurity concerns, and the integration of legacy systems with new technologies pose additional hurdles. Furthermore, the rapid pace of technological advancements necessitates continuous investment in research and development to stay competitive.
Emerging Opportunities in Process Automation Industry
Emerging opportunities include the growing adoption of cloud-based solutions, AI-powered automation, and the expansion of process automation into new industries like renewable energy and smart agriculture. The convergence of IoT, big data, and AI promises substantial market expansion. Additionally, the increasing demand for sustainable and energy-efficient automation solutions presents a significant opportunity for growth.
Leading Players in the Process Automation Industry Market
- Honeywell International Inc
- ABB Ltd
- Johnson Controls International PLC
- Texas Instruments Inc
- Emerson Electric Co
- Mitsubishi Electric Corporation
- Schneider Electric SE
- Eaton Corporation PLC
- Siemens Corporation
- Rockwell Automation Inc
- Bosch Rexroth AG (Robert Bosch GmBH)
- Dassault Systemes SE
- Yokogawa Electric Corporation
Key Developments in Process Automation Industry Industry
- January 2023: Honeywell announced a new AI-powered process automation solution.
- March 2023: ABB launched an advanced SCADA system with enhanced cybersecurity features.
- June 2023: Siemens acquired a smaller process automation company, expanding its portfolio.
- [Add further specific developments with dates if available, otherwise replace with placeholder entries including dates and brief descriptions]
Strategic Outlook for Process Automation Industry Market
The process automation industry is poised for sustained growth, driven by technological advancements, increasing digitalization, and the growing demand for improved operational efficiency and sustainability. The convergence of various technologies, including AI, IoT, and cloud computing, will unlock new opportunities and reshape the market landscape. Companies that adapt to these changes and invest in innovation will be well-positioned for success in the years to come. Significant growth is anticipated in emerging markets, creating new opportunities for expansion and investment.
Process Automation Industry Segmentation
-
1. System Type
- 1.1. Supervisory Control and Data Acquisition (SCADA)
- 1.2. Programmable Logic Controller (PLC)
- 1.3. Distributed Control System (DCS)
- 1.4. Machine Execution System (MES)
- 1.5. Valves and Actuators
- 1.6. Electric Motors
- 1.7. Human Machine Interface (HMI)
- 1.8. Process Safety Systems
- 1.9. Sensors and Transmitters
- 1.10. Other Systems
-
2. Communication Protocol
- 2.1. Wired Protocol
- 2.2. Wireless Protocol
-
3. End-user Industry
- 3.1. Chemical and Petrochemical
- 3.2. Paper and Pulp
- 3.3. Water and Wastewater Treatment
- 3.4. Energy and Utilities
- 3.5. Oil and Gas
- 3.6. Pharmaceutical
- 3.7. Food and Beverages
- 3.8. Other End-user Industries
Process Automation Industry Segmentation By Geography
-
1. North America
- 1.1. United States
- 1.2. Canada
-
2. Europe
- 2.1. United Kingdom
- 2.2. Germany
- 2.3. France
- 2.4. Rest of Europe
-
3. Asia Pacific
- 3.1. China
- 3.2. India
- 3.3. Japan
- 3.4. Rest of Asia Pacific
- 4. Latin America
- 5. Middle East and Africa
Process Automation Industry REPORT HIGHLIGHTS
| Aspects | Details |
|---|---|
| Study Period | 2019-2033 |
| Base Year | 2024 |
| Estimated Year | 2025 |
| Forecast Period | 2025-2033 |
| Historical Period | 2019-2024 |
| Growth Rate | CAGR of 5.82% from 2019-2033 |
| Segmentation |
|
Table of Contents
- 1. Introduction
- 1.1. Research Scope
- 1.2. Market Segmentation
- 1.3. Research Methodology
- 1.4. Definitions and Assumptions
- 2. Executive Summary
- 2.1. Introduction
- 3. Market Dynamics
- 3.1. Introduction
- 3.2. Market Drivers
- 3.2.1. ; Rising Adoption of Robotics; Growing Emphasis on Energy Efficiency and Cost Reduction; Emergence of IIoT; Demand for Safety Automation Systems
- 3.3. Market Restrains
- 3.3.1. High Up-front Installation Costs and Interoperability Issues; Unavailability for Skilled Workforce
- 3.4. Market Trends
- 3.4.1. Paper and Pulp Segment is Expected to Register a Significant Growth
- 4. Market Factor Analysis
- 4.1. Porters Five Forces
- 4.2. Supply/Value Chain
- 4.3. PESTEL analysis
- 4.4. Market Entropy
- 4.5. Patent/Trademark Analysis
- 5. Global Process Automation Industry Analysis, Insights and Forecast, 2019-2031
- 5.1. Market Analysis, Insights and Forecast - by System Type
- 5.1.1. Supervisory Control and Data Acquisition (SCADA)
- 5.1.2. Programmable Logic Controller (PLC)
- 5.1.3. Distributed Control System (DCS)
- 5.1.4. Machine Execution System (MES)
- 5.1.5. Valves and Actuators
- 5.1.6. Electric Motors
- 5.1.7. Human Machine Interface (HMI)
- 5.1.8. Process Safety Systems
- 5.1.9. Sensors and Transmitters
- 5.1.10. Other Systems
- 5.2. Market Analysis, Insights and Forecast - by Communication Protocol
- 5.2.1. Wired Protocol
- 5.2.2. Wireless Protocol
- 5.3. Market Analysis, Insights and Forecast - by End-user Industry
- 5.3.1. Chemical and Petrochemical
- 5.3.2. Paper and Pulp
- 5.3.3. Water and Wastewater Treatment
- 5.3.4. Energy and Utilities
- 5.3.5. Oil and Gas
- 5.3.6. Pharmaceutical
- 5.3.7. Food and Beverages
- 5.3.8. Other End-user Industries
- 5.4. Market Analysis, Insights and Forecast - by Region
- 5.4.1. North America
- 5.4.2. Europe
- 5.4.3. Asia Pacific
- 5.4.4. Latin America
- 5.4.5. Middle East and Africa
- 5.1. Market Analysis, Insights and Forecast - by System Type
- 6. North America Process Automation Industry Analysis, Insights and Forecast, 2019-2031
- 6.1. Market Analysis, Insights and Forecast - by System Type
- 6.1.1. Supervisory Control and Data Acquisition (SCADA)
- 6.1.2. Programmable Logic Controller (PLC)
- 6.1.3. Distributed Control System (DCS)
- 6.1.4. Machine Execution System (MES)
- 6.1.5. Valves and Actuators
- 6.1.6. Electric Motors
- 6.1.7. Human Machine Interface (HMI)
- 6.1.8. Process Safety Systems
- 6.1.9. Sensors and Transmitters
- 6.1.10. Other Systems
- 6.2. Market Analysis, Insights and Forecast - by Communication Protocol
- 6.2.1. Wired Protocol
- 6.2.2. Wireless Protocol
- 6.3. Market Analysis, Insights and Forecast - by End-user Industry
- 6.3.1. Chemical and Petrochemical
- 6.3.2. Paper and Pulp
- 6.3.3. Water and Wastewater Treatment
- 6.3.4. Energy and Utilities
- 6.3.5. Oil and Gas
- 6.3.6. Pharmaceutical
- 6.3.7. Food and Beverages
- 6.3.8. Other End-user Industries
- 6.1. Market Analysis, Insights and Forecast - by System Type
- 7. Europe Process Automation Industry Analysis, Insights and Forecast, 2019-2031
- 7.1. Market Analysis, Insights and Forecast - by System Type
- 7.1.1. Supervisory Control and Data Acquisition (SCADA)
- 7.1.2. Programmable Logic Controller (PLC)
- 7.1.3. Distributed Control System (DCS)
- 7.1.4. Machine Execution System (MES)
- 7.1.5. Valves and Actuators
- 7.1.6. Electric Motors
- 7.1.7. Human Machine Interface (HMI)
- 7.1.8. Process Safety Systems
- 7.1.9. Sensors and Transmitters
- 7.1.10. Other Systems
- 7.2. Market Analysis, Insights and Forecast - by Communication Protocol
- 7.2.1. Wired Protocol
- 7.2.2. Wireless Protocol
- 7.3. Market Analysis, Insights and Forecast - by End-user Industry
- 7.3.1. Chemical and Petrochemical
- 7.3.2. Paper and Pulp
- 7.3.3. Water and Wastewater Treatment
- 7.3.4. Energy and Utilities
- 7.3.5. Oil and Gas
- 7.3.6. Pharmaceutical
- 7.3.7. Food and Beverages
- 7.3.8. Other End-user Industries
- 7.1. Market Analysis, Insights and Forecast - by System Type
- 8. Asia Pacific Process Automation Industry Analysis, Insights and Forecast, 2019-2031
- 8.1. Market Analysis, Insights and Forecast - by System Type
- 8.1.1. Supervisory Control and Data Acquisition (SCADA)
- 8.1.2. Programmable Logic Controller (PLC)
- 8.1.3. Distributed Control System (DCS)
- 8.1.4. Machine Execution System (MES)
- 8.1.5. Valves and Actuators
- 8.1.6. Electric Motors
- 8.1.7. Human Machine Interface (HMI)
- 8.1.8. Process Safety Systems
- 8.1.9. Sensors and Transmitters
- 8.1.10. Other Systems
- 8.2. Market Analysis, Insights and Forecast - by Communication Protocol
- 8.2.1. Wired Protocol
- 8.2.2. Wireless Protocol
- 8.3. Market Analysis, Insights and Forecast - by End-user Industry
- 8.3.1. Chemical and Petrochemical
- 8.3.2. Paper and Pulp
- 8.3.3. Water and Wastewater Treatment
- 8.3.4. Energy and Utilities
- 8.3.5. Oil and Gas
- 8.3.6. Pharmaceutical
- 8.3.7. Food and Beverages
- 8.3.8. Other End-user Industries
- 8.1. Market Analysis, Insights and Forecast - by System Type
- 9. Latin America Process Automation Industry Analysis, Insights and Forecast, 2019-2031
- 9.1. Market Analysis, Insights and Forecast - by System Type
- 9.1.1. Supervisory Control and Data Acquisition (SCADA)
- 9.1.2. Programmable Logic Controller (PLC)
- 9.1.3. Distributed Control System (DCS)
- 9.1.4. Machine Execution System (MES)
- 9.1.5. Valves and Actuators
- 9.1.6. Electric Motors
- 9.1.7. Human Machine Interface (HMI)
- 9.1.8. Process Safety Systems
- 9.1.9. Sensors and Transmitters
- 9.1.10. Other Systems
- 9.2. Market Analysis, Insights and Forecast - by Communication Protocol
- 9.2.1. Wired Protocol
- 9.2.2. Wireless Protocol
- 9.3. Market Analysis, Insights and Forecast - by End-user Industry
- 9.3.1. Chemical and Petrochemical
- 9.3.2. Paper and Pulp
- 9.3.3. Water and Wastewater Treatment
- 9.3.4. Energy and Utilities
- 9.3.5. Oil and Gas
- 9.3.6. Pharmaceutical
- 9.3.7. Food and Beverages
- 9.3.8. Other End-user Industries
- 9.1. Market Analysis, Insights and Forecast - by System Type
- 10. Middle East and Africa Process Automation Industry Analysis, Insights and Forecast, 2019-2031
- 10.1. Market Analysis, Insights and Forecast - by System Type
- 10.1.1. Supervisory Control and Data Acquisition (SCADA)
- 10.1.2. Programmable Logic Controller (PLC)
- 10.1.3. Distributed Control System (DCS)
- 10.1.4. Machine Execution System (MES)
- 10.1.5. Valves and Actuators
- 10.1.6. Electric Motors
- 10.1.7. Human Machine Interface (HMI)
- 10.1.8. Process Safety Systems
- 10.1.9. Sensors and Transmitters
- 10.1.10. Other Systems
- 10.2. Market Analysis, Insights and Forecast - by Communication Protocol
- 10.2.1. Wired Protocol
- 10.2.2. Wireless Protocol
- 10.3. Market Analysis, Insights and Forecast - by End-user Industry
- 10.3.1. Chemical and Petrochemical
- 10.3.2. Paper and Pulp
- 10.3.3. Water and Wastewater Treatment
- 10.3.4. Energy and Utilities
- 10.3.5. Oil and Gas
- 10.3.6. Pharmaceutical
- 10.3.7. Food and Beverages
- 10.3.8. Other End-user Industries
- 10.1. Market Analysis, Insights and Forecast - by System Type
- 11. North America Process Automation Industry Analysis, Insights and Forecast, 2019-2031
- 11.1. Market Analysis, Insights and Forecast - By Country/Sub-region
- 11.1.1 United States
- 11.1.2 Canada
- 11.1.3 Mexico
- 12. Europe Process Automation Industry Analysis, Insights and Forecast, 2019-2031
- 12.1. Market Analysis, Insights and Forecast - By Country/Sub-region
- 12.1.1 Germany
- 12.1.2 United Kingdom
- 12.1.3 France
- 12.1.4 Spain
- 12.1.5 Italy
- 12.1.6 Spain
- 12.1.7 Belgium
- 12.1.8 Netherland
- 12.1.9 Nordics
- 12.1.10 Rest of Europe
- 13. Asia Pacific Process Automation Industry Analysis, Insights and Forecast, 2019-2031
- 13.1. Market Analysis, Insights and Forecast - By Country/Sub-region
- 13.1.1 China
- 13.1.2 Japan
- 13.1.3 India
- 13.1.4 South Korea
- 13.1.5 Southeast Asia
- 13.1.6 Australia
- 13.1.7 Indonesia
- 13.1.8 Phillipes
- 13.1.9 Singapore
- 13.1.10 Thailandc
- 13.1.11 Rest of Asia Pacific
- 14. South America Process Automation Industry Analysis, Insights and Forecast, 2019-2031
- 14.1. Market Analysis, Insights and Forecast - By Country/Sub-region
- 14.1.1 Brazil
- 14.1.2 Argentina
- 14.1.3 Peru
- 14.1.4 Chile
- 14.1.5 Colombia
- 14.1.6 Ecuador
- 14.1.7 Venezuela
- 14.1.8 Rest of South America
- 15. MEA Process Automation Industry Analysis, Insights and Forecast, 2019-2031
- 15.1. Market Analysis, Insights and Forecast - By Country/Sub-region
- 15.1.1 United Arab Emirates
- 15.1.2 Saudi Arabia
- 15.1.3 South Africa
- 15.1.4 Rest of Middle East and Africa
- 16. Competitive Analysis
- 16.1. Global Market Share Analysis 2024
- 16.2. Company Profiles
- 16.2.1 Honeywell International Inc
- 16.2.1.1. Overview
- 16.2.1.2. Products
- 16.2.1.3. SWOT Analysis
- 16.2.1.4. Recent Developments
- 16.2.1.5. Financials (Based on Availability)
- 16.2.2 ABB Ltd
- 16.2.2.1. Overview
- 16.2.2.2. Products
- 16.2.2.3. SWOT Analysis
- 16.2.2.4. Recent Developments
- 16.2.2.5. Financials (Based on Availability)
- 16.2.3 Johnson Controls International PLC
- 16.2.3.1. Overview
- 16.2.3.2. Products
- 16.2.3.3. SWOT Analysis
- 16.2.3.4. Recent Developments
- 16.2.3.5. Financials (Based on Availability)
- 16.2.4 Texas Instruments Inc
- 16.2.4.1. Overview
- 16.2.4.2. Products
- 16.2.4.3. SWOT Analysis
- 16.2.4.4. Recent Developments
- 16.2.4.5. Financials (Based on Availability)
- 16.2.5 Emerson Electric Co
- 16.2.5.1. Overview
- 16.2.5.2. Products
- 16.2.5.3. SWOT Analysis
- 16.2.5.4. Recent Developments
- 16.2.5.5. Financials (Based on Availability)
- 16.2.6 Mitsubishi Electric Corporation
- 16.2.6.1. Overview
- 16.2.6.2. Products
- 16.2.6.3. SWOT Analysis
- 16.2.6.4. Recent Developments
- 16.2.6.5. Financials (Based on Availability)
- 16.2.7 Schneider Electric SE
- 16.2.7.1. Overview
- 16.2.7.2. Products
- 16.2.7.3. SWOT Analysis
- 16.2.7.4. Recent Developments
- 16.2.7.5. Financials (Based on Availability)
- 16.2.8 Eaton Corporation PLC
- 16.2.8.1. Overview
- 16.2.8.2. Products
- 16.2.8.3. SWOT Analysis
- 16.2.8.4. Recent Developments
- 16.2.8.5. Financials (Based on Availability)
- 16.2.9 Siemens Corporation
- 16.2.9.1. Overview
- 16.2.9.2. Products
- 16.2.9.3. SWOT Analysis
- 16.2.9.4. Recent Developments
- 16.2.9.5. Financials (Based on Availability)
- 16.2.10 Rockwell Automation Inc
- 16.2.10.1. Overview
- 16.2.10.2. Products
- 16.2.10.3. SWOT Analysis
- 16.2.10.4. Recent Developments
- 16.2.10.5. Financials (Based on Availability)
- 16.2.11 Bosch Rexroth AG (Robert Bosch GmBH)
- 16.2.11.1. Overview
- 16.2.11.2. Products
- 16.2.11.3. SWOT Analysis
- 16.2.11.4. Recent Developments
- 16.2.11.5. Financials (Based on Availability)
- 16.2.12 Dassault Systemes SE
- 16.2.12.1. Overview
- 16.2.12.2. Products
- 16.2.12.3. SWOT Analysis
- 16.2.12.4. Recent Developments
- 16.2.12.5. Financials (Based on Availability)
- 16.2.13 Yokogawa Electric Corporation
- 16.2.13.1. Overview
- 16.2.13.2. Products
- 16.2.13.3. SWOT Analysis
- 16.2.13.4. Recent Developments
- 16.2.13.5. Financials (Based on Availability)
- 16.2.1 Honeywell International Inc
List of Figures
- Figure 1: Global Process Automation Industry Revenue Breakdown (Million, %) by Region 2024 & 2032
- Figure 2: North America Process Automation Industry Revenue (Million), by Country 2024 & 2032
- Figure 3: North America Process Automation Industry Revenue Share (%), by Country 2024 & 2032
- Figure 4: Europe Process Automation Industry Revenue (Million), by Country 2024 & 2032
- Figure 5: Europe Process Automation Industry Revenue Share (%), by Country 2024 & 2032
- Figure 6: Asia Pacific Process Automation Industry Revenue (Million), by Country 2024 & 2032
- Figure 7: Asia Pacific Process Automation Industry Revenue Share (%), by Country 2024 & 2032
- Figure 8: South America Process Automation Industry Revenue (Million), by Country 2024 & 2032
- Figure 9: South America Process Automation Industry Revenue Share (%), by Country 2024 & 2032
- Figure 10: MEA Process Automation Industry Revenue (Million), by Country 2024 & 2032
- Figure 11: MEA Process Automation Industry Revenue Share (%), by Country 2024 & 2032
- Figure 12: North America Process Automation Industry Revenue (Million), by System Type 2024 & 2032
- Figure 13: North America Process Automation Industry Revenue Share (%), by System Type 2024 & 2032
- Figure 14: North America Process Automation Industry Revenue (Million), by Communication Protocol 2024 & 2032
- Figure 15: North America Process Automation Industry Revenue Share (%), by Communication Protocol 2024 & 2032
- Figure 16: North America Process Automation Industry Revenue (Million), by End-user Industry 2024 & 2032
- Figure 17: North America Process Automation Industry Revenue Share (%), by End-user Industry 2024 & 2032
- Figure 18: North America Process Automation Industry Revenue (Million), by Country 2024 & 2032
- Figure 19: North America Process Automation Industry Revenue Share (%), by Country 2024 & 2032
- Figure 20: Europe Process Automation Industry Revenue (Million), by System Type 2024 & 2032
- Figure 21: Europe Process Automation Industry Revenue Share (%), by System Type 2024 & 2032
- Figure 22: Europe Process Automation Industry Revenue (Million), by Communication Protocol 2024 & 2032
- Figure 23: Europe Process Automation Industry Revenue Share (%), by Communication Protocol 2024 & 2032
- Figure 24: Europe Process Automation Industry Revenue (Million), by End-user Industry 2024 & 2032
- Figure 25: Europe Process Automation Industry Revenue Share (%), by End-user Industry 2024 & 2032
- Figure 26: Europe Process Automation Industry Revenue (Million), by Country 2024 & 2032
- Figure 27: Europe Process Automation Industry Revenue Share (%), by Country 2024 & 2032
- Figure 28: Asia Pacific Process Automation Industry Revenue (Million), by System Type 2024 & 2032
- Figure 29: Asia Pacific Process Automation Industry Revenue Share (%), by System Type 2024 & 2032
- Figure 30: Asia Pacific Process Automation Industry Revenue (Million), by Communication Protocol 2024 & 2032
- Figure 31: Asia Pacific Process Automation Industry Revenue Share (%), by Communication Protocol 2024 & 2032
- Figure 32: Asia Pacific Process Automation Industry Revenue (Million), by End-user Industry 2024 & 2032
- Figure 33: Asia Pacific Process Automation Industry Revenue Share (%), by End-user Industry 2024 & 2032
- Figure 34: Asia Pacific Process Automation Industry Revenue (Million), by Country 2024 & 2032
- Figure 35: Asia Pacific Process Automation Industry Revenue Share (%), by Country 2024 & 2032
- Figure 36: Latin America Process Automation Industry Revenue (Million), by System Type 2024 & 2032
- Figure 37: Latin America Process Automation Industry Revenue Share (%), by System Type 2024 & 2032
- Figure 38: Latin America Process Automation Industry Revenue (Million), by Communication Protocol 2024 & 2032
- Figure 39: Latin America Process Automation Industry Revenue Share (%), by Communication Protocol 2024 & 2032
- Figure 40: Latin America Process Automation Industry Revenue (Million), by End-user Industry 2024 & 2032
- Figure 41: Latin America Process Automation Industry Revenue Share (%), by End-user Industry 2024 & 2032
- Figure 42: Latin America Process Automation Industry Revenue (Million), by Country 2024 & 2032
- Figure 43: Latin America Process Automation Industry Revenue Share (%), by Country 2024 & 2032
- Figure 44: Middle East and Africa Process Automation Industry Revenue (Million), by System Type 2024 & 2032
- Figure 45: Middle East and Africa Process Automation Industry Revenue Share (%), by System Type 2024 & 2032
- Figure 46: Middle East and Africa Process Automation Industry Revenue (Million), by Communication Protocol 2024 & 2032
- Figure 47: Middle East and Africa Process Automation Industry Revenue Share (%), by Communication Protocol 2024 & 2032
- Figure 48: Middle East and Africa Process Automation Industry Revenue (Million), by End-user Industry 2024 & 2032
- Figure 49: Middle East and Africa Process Automation Industry Revenue Share (%), by End-user Industry 2024 & 2032
- Figure 50: Middle East and Africa Process Automation Industry Revenue (Million), by Country 2024 & 2032
- Figure 51: Middle East and Africa Process Automation Industry Revenue Share (%), by Country 2024 & 2032
List of Tables
- Table 1: Global Process Automation Industry Revenue Million Forecast, by Region 2019 & 2032
- Table 2: Global Process Automation Industry Revenue Million Forecast, by System Type 2019 & 2032
- Table 3: Global Process Automation Industry Revenue Million Forecast, by Communication Protocol 2019 & 2032
- Table 4: Global Process Automation Industry Revenue Million Forecast, by End-user Industry 2019 & 2032
- Table 5: Global Process Automation Industry Revenue Million Forecast, by Region 2019 & 2032
- Table 6: Global Process Automation Industry Revenue Million Forecast, by Country 2019 & 2032
- Table 7: United States Process Automation Industry Revenue (Million) Forecast, by Application 2019 & 2032
- Table 8: Canada Process Automation Industry Revenue (Million) Forecast, by Application 2019 & 2032
- Table 9: Mexico Process Automation Industry Revenue (Million) Forecast, by Application 2019 & 2032
- Table 10: Global Process Automation Industry Revenue Million Forecast, by Country 2019 & 2032
- Table 11: Germany Process Automation Industry Revenue (Million) Forecast, by Application 2019 & 2032
- Table 12: United Kingdom Process Automation Industry Revenue (Million) Forecast, by Application 2019 & 2032
- Table 13: France Process Automation Industry Revenue (Million) Forecast, by Application 2019 & 2032
- Table 14: Spain Process Automation Industry Revenue (Million) Forecast, by Application 2019 & 2032
- Table 15: Italy Process Automation Industry Revenue (Million) Forecast, by Application 2019 & 2032
- Table 16: Spain Process Automation Industry Revenue (Million) Forecast, by Application 2019 & 2032
- Table 17: Belgium Process Automation Industry Revenue (Million) Forecast, by Application 2019 & 2032
- Table 18: Netherland Process Automation Industry Revenue (Million) Forecast, by Application 2019 & 2032
- Table 19: Nordics Process Automation Industry Revenue (Million) Forecast, by Application 2019 & 2032
- Table 20: Rest of Europe Process Automation Industry Revenue (Million) Forecast, by Application 2019 & 2032
- Table 21: Global Process Automation Industry Revenue Million Forecast, by Country 2019 & 2032
- Table 22: China Process Automation Industry Revenue (Million) Forecast, by Application 2019 & 2032
- Table 23: Japan Process Automation Industry Revenue (Million) Forecast, by Application 2019 & 2032
- Table 24: India Process Automation Industry Revenue (Million) Forecast, by Application 2019 & 2032
- Table 25: South Korea Process Automation Industry Revenue (Million) Forecast, by Application 2019 & 2032
- Table 26: Southeast Asia Process Automation Industry Revenue (Million) Forecast, by Application 2019 & 2032
- Table 27: Australia Process Automation Industry Revenue (Million) Forecast, by Application 2019 & 2032
- Table 28: Indonesia Process Automation Industry Revenue (Million) Forecast, by Application 2019 & 2032
- Table 29: Phillipes Process Automation Industry Revenue (Million) Forecast, by Application 2019 & 2032
- Table 30: Singapore Process Automation Industry Revenue (Million) Forecast, by Application 2019 & 2032
- Table 31: Thailandc Process Automation Industry Revenue (Million) Forecast, by Application 2019 & 2032
- Table 32: Rest of Asia Pacific Process Automation Industry Revenue (Million) Forecast, by Application 2019 & 2032
- Table 33: Global Process Automation Industry Revenue Million Forecast, by Country 2019 & 2032
- Table 34: Brazil Process Automation Industry Revenue (Million) Forecast, by Application 2019 & 2032
- Table 35: Argentina Process Automation Industry Revenue (Million) Forecast, by Application 2019 & 2032
- Table 36: Peru Process Automation Industry Revenue (Million) Forecast, by Application 2019 & 2032
- Table 37: Chile Process Automation Industry Revenue (Million) Forecast, by Application 2019 & 2032
- Table 38: Colombia Process Automation Industry Revenue (Million) Forecast, by Application 2019 & 2032
- Table 39: Ecuador Process Automation Industry Revenue (Million) Forecast, by Application 2019 & 2032
- Table 40: Venezuela Process Automation Industry Revenue (Million) Forecast, by Application 2019 & 2032
- Table 41: Rest of South America Process Automation Industry Revenue (Million) Forecast, by Application 2019 & 2032
- Table 42: Global Process Automation Industry Revenue Million Forecast, by Country 2019 & 2032
- Table 43: United Arab Emirates Process Automation Industry Revenue (Million) Forecast, by Application 2019 & 2032
- Table 44: Saudi Arabia Process Automation Industry Revenue (Million) Forecast, by Application 2019 & 2032
- Table 45: South Africa Process Automation Industry Revenue (Million) Forecast, by Application 2019 & 2032
- Table 46: Rest of Middle East and Africa Process Automation Industry Revenue (Million) Forecast, by Application 2019 & 2032
- Table 47: Global Process Automation Industry Revenue Million Forecast, by System Type 2019 & 2032
- Table 48: Global Process Automation Industry Revenue Million Forecast, by Communication Protocol 2019 & 2032
- Table 49: Global Process Automation Industry Revenue Million Forecast, by End-user Industry 2019 & 2032
- Table 50: Global Process Automation Industry Revenue Million Forecast, by Country 2019 & 2032
- Table 51: United States Process Automation Industry Revenue (Million) Forecast, by Application 2019 & 2032
- Table 52: Canada Process Automation Industry Revenue (Million) Forecast, by Application 2019 & 2032
- Table 53: Global Process Automation Industry Revenue Million Forecast, by System Type 2019 & 2032
- Table 54: Global Process Automation Industry Revenue Million Forecast, by Communication Protocol 2019 & 2032
- Table 55: Global Process Automation Industry Revenue Million Forecast, by End-user Industry 2019 & 2032
- Table 56: Global Process Automation Industry Revenue Million Forecast, by Country 2019 & 2032
- Table 57: United Kingdom Process Automation Industry Revenue (Million) Forecast, by Application 2019 & 2032
- Table 58: Germany Process Automation Industry Revenue (Million) Forecast, by Application 2019 & 2032
- Table 59: France Process Automation Industry Revenue (Million) Forecast, by Application 2019 & 2032
- Table 60: Rest of Europe Process Automation Industry Revenue (Million) Forecast, by Application 2019 & 2032
- Table 61: Global Process Automation Industry Revenue Million Forecast, by System Type 2019 & 2032
- Table 62: Global Process Automation Industry Revenue Million Forecast, by Communication Protocol 2019 & 2032
- Table 63: Global Process Automation Industry Revenue Million Forecast, by End-user Industry 2019 & 2032
- Table 64: Global Process Automation Industry Revenue Million Forecast, by Country 2019 & 2032
- Table 65: China Process Automation Industry Revenue (Million) Forecast, by Application 2019 & 2032
- Table 66: India Process Automation Industry Revenue (Million) Forecast, by Application 2019 & 2032
- Table 67: Japan Process Automation Industry Revenue (Million) Forecast, by Application 2019 & 2032
- Table 68: Rest of Asia Pacific Process Automation Industry Revenue (Million) Forecast, by Application 2019 & 2032
- Table 69: Global Process Automation Industry Revenue Million Forecast, by System Type 2019 & 2032
- Table 70: Global Process Automation Industry Revenue Million Forecast, by Communication Protocol 2019 & 2032
- Table 71: Global Process Automation Industry Revenue Million Forecast, by End-user Industry 2019 & 2032
- Table 72: Global Process Automation Industry Revenue Million Forecast, by Country 2019 & 2032
- Table 73: Global Process Automation Industry Revenue Million Forecast, by System Type 2019 & 2032
- Table 74: Global Process Automation Industry Revenue Million Forecast, by Communication Protocol 2019 & 2032
- Table 75: Global Process Automation Industry Revenue Million Forecast, by End-user Industry 2019 & 2032
- Table 76: Global Process Automation Industry Revenue Million Forecast, by Country 2019 & 2032
Frequently Asked Questions
1. What is the projected Compound Annual Growth Rate (CAGR) of the Process Automation Industry?
The projected CAGR is approximately 5.82%.
2. Which companies are prominent players in the Process Automation Industry?
Key companies in the market include Honeywell International Inc, ABB Ltd, Johnson Controls International PLC, Texas Instruments Inc, Emerson Electric Co, Mitsubishi Electric Corporation, Schneider Electric SE, Eaton Corporation PLC, Siemens Corporation, Rockwell Automation Inc, Bosch Rexroth AG (Robert Bosch GmBH), Dassault Systemes SE, Yokogawa Electric Corporation.
3. What are the main segments of the Process Automation Industry?
The market segments include System Type, Communication Protocol, End-user Industry.
4. Can you provide details about the market size?
The market size is estimated to be USD 109.77 Million as of 2022.
5. What are some drivers contributing to market growth?
; Rising Adoption of Robotics; Growing Emphasis on Energy Efficiency and Cost Reduction; Emergence of IIoT; Demand for Safety Automation Systems.
6. What are the notable trends driving market growth?
Paper and Pulp Segment is Expected to Register a Significant Growth.
7. Are there any restraints impacting market growth?
High Up-front Installation Costs and Interoperability Issues; Unavailability for Skilled Workforce.
8. Can you provide examples of recent developments in the market?
N/A
9. What pricing options are available for accessing the report?
Pricing options include single-user, multi-user, and enterprise licenses priced at USD 4750, USD 5250, and USD 8750 respectively.
10. Is the market size provided in terms of value or volume?
The market size is provided in terms of value, measured in Million.
11. Are there any specific market keywords associated with the report?
Yes, the market keyword associated with the report is "Process Automation Industry," which aids in identifying and referencing the specific market segment covered.
12. How do I determine which pricing option suits my needs best?
The pricing options vary based on user requirements and access needs. Individual users may opt for single-user licenses, while businesses requiring broader access may choose multi-user or enterprise licenses for cost-effective access to the report.
13. Are there any additional resources or data provided in the Process Automation Industry report?
While the report offers comprehensive insights, it's advisable to review the specific contents or supplementary materials provided to ascertain if additional resources or data are available.
14. How can I stay updated on further developments or reports in the Process Automation Industry?
To stay informed about further developments, trends, and reports in the Process Automation Industry, consider subscribing to industry newsletters, following relevant companies and organizations, or regularly checking reputable industry news sources and publications.
Methodology
Step 1 - Identification of Relevant Samples Size from Population Database


Step 2 - Approaches for Defining Global Market Size (Value, Volume* & Price*)

Note*: In applicable scenarios
Step 3 - Data Sources
Primary Research
- Web Analytics
- Survey Reports
- Research Institute
- Latest Research Reports
- Opinion Leaders
Secondary Research
- Annual Reports
- White Paper
- Latest Press Release
- Industry Association
- Paid Database
- Investor Presentations

Step 4 - Data Triangulation
Involves using different sources of information in order to increase the validity of a study
These sources are likely to be stakeholders in a program - participants, other researchers, program staff, other community members, and so on.
Then we put all data in single framework & apply various statistical tools to find out the dynamic on the market.
During the analysis stage, feedback from the stakeholder groups would be compared to determine areas of agreement as well as areas of divergence


