
Key Insights
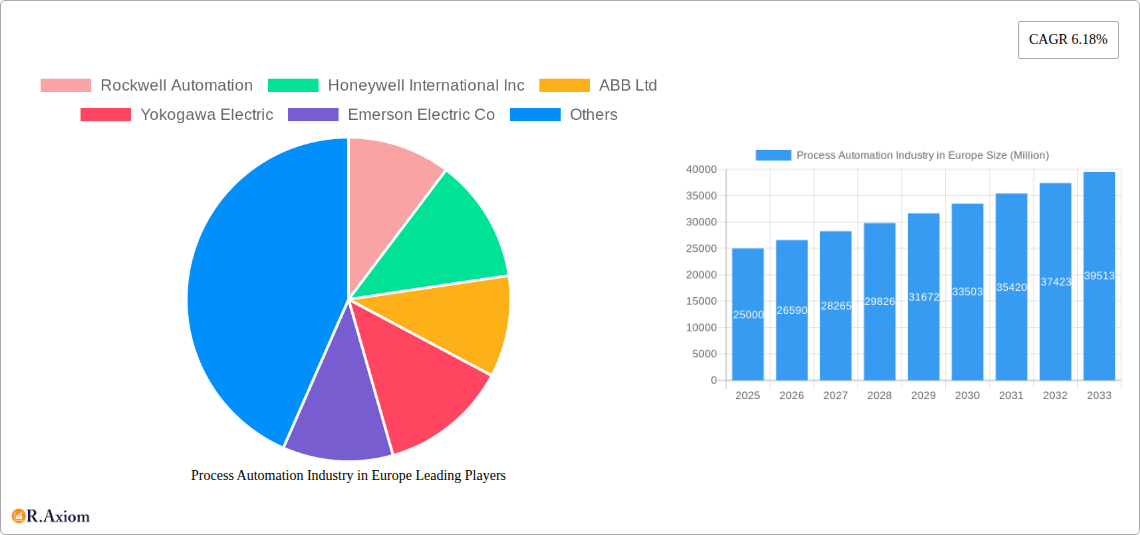
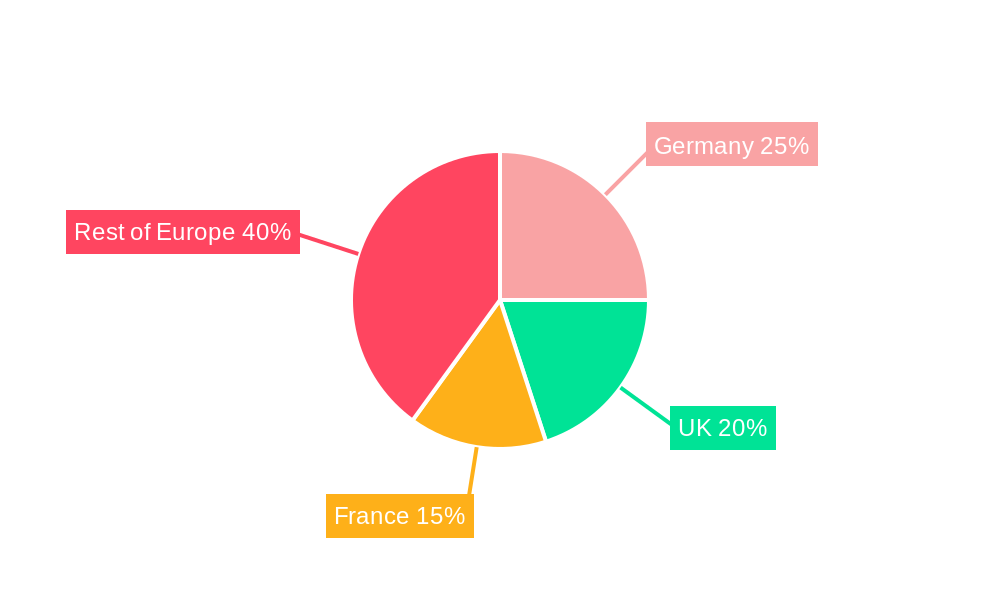
The European process automation market is experiencing robust growth, driven by increasing industrial automation across various sectors. The market, estimated at €XX million in 2025 (the base year), is projected to exhibit a Compound Annual Growth Rate (CAGR) of 6.18% from 2025 to 2033. This expansion is fueled by several key factors. Firstly, the rising demand for improved operational efficiency and productivity across industries like oil and gas, chemicals, and power & utilities is pushing companies to adopt advanced automation solutions. Secondly, the increasing adoption of Industry 4.0 technologies, including Industrial Internet of Things (IIoT), cloud computing, and advanced analytics, is transforming process automation, enabling predictive maintenance, real-time monitoring, and optimized resource allocation. Furthermore, stringent environmental regulations and the need for sustainable operations are driving the adoption of automation systems for reducing energy consumption and minimizing waste. Germany, the United Kingdom, and France are leading the European market, benefiting from established industrial bases and robust technological infrastructure. The preference for wireless communication protocols over wired ones is increasing, reflecting the need for greater flexibility and reduced installation complexities. Software-driven solutions, such as advanced process control systems and manufacturing execution systems (MES), are gaining prominence over hardware-centric approaches, highlighting the shift towards intelligent automation.
However, the market's growth is not without challenges. High initial investment costs associated with implementing sophisticated automation systems can hinder adoption, particularly among smaller companies. Moreover, the complexity involved in integrating new automation technologies with existing legacy systems can pose a significant hurdle. Cybersecurity concerns related to the increasing interconnectedness of industrial control systems also pose a considerable risk. Despite these challenges, the long-term prospects for the European process automation market remain positive, driven by ongoing technological advancements, increasing regulatory pressure, and the continuous quest for improved operational efficiency across diverse industry segments. The diverse range of end-user industries ensures a consistent demand for innovative solutions across the forecast period.
Process Automation Industry in Europe: A Comprehensive Market Report (2019-2033)
This in-depth report provides a comprehensive analysis of the Process Automation industry in Europe, covering market size, growth projections, key players, and emerging trends from 2019 to 2033. The study period is 2019–2033, with 2025 as the base and estimated year, and 2025–2033 as the forecast period. The historical period covered is 2019–2024. The report caters to industry stakeholders, investors, and businesses seeking actionable insights into this dynamic market.
Process Automation Industry in Europe Market Concentration & Innovation
The European process automation market exhibits a moderately concentrated landscape, with several multinational corporations holding significant market share. Rockwell Automation, Honeywell International Inc, ABB Ltd, Siemens AG, and Emerson Electric Co are among the leading players, collectively accounting for approximately xx% of the market in 2025. Market share dynamics are influenced by factors such as M&A activity, technological innovation, and regional variations in demand. In recent years, M&A deal values have totalled approximately €xx Million, driven by companies seeking to expand their product portfolios and geographic reach.
- Market Concentration: High (xx%), driven by a few dominant players.
- Innovation Drivers: Increased demand for automation, Industry 4.0 initiatives, advancements in AI and IoT.
- Regulatory Frameworks: EU regulations on data privacy (GDPR), industrial safety standards, and environmental compliance influence market dynamics.
- Product Substitutes: Limited direct substitutes exist, but competition arises from alternative automation solutions and manual processes.
- End-User Trends: Growing adoption of digitalization and automation across diverse industries.
- M&A Activity: Significant consolidation observed in recent years, with deal values exceeding €xx Million in the last five years. This has primarily involved acquisitions aimed at increasing market reach and product diversification.
Process Automation Industry in Europe Industry Trends & Insights
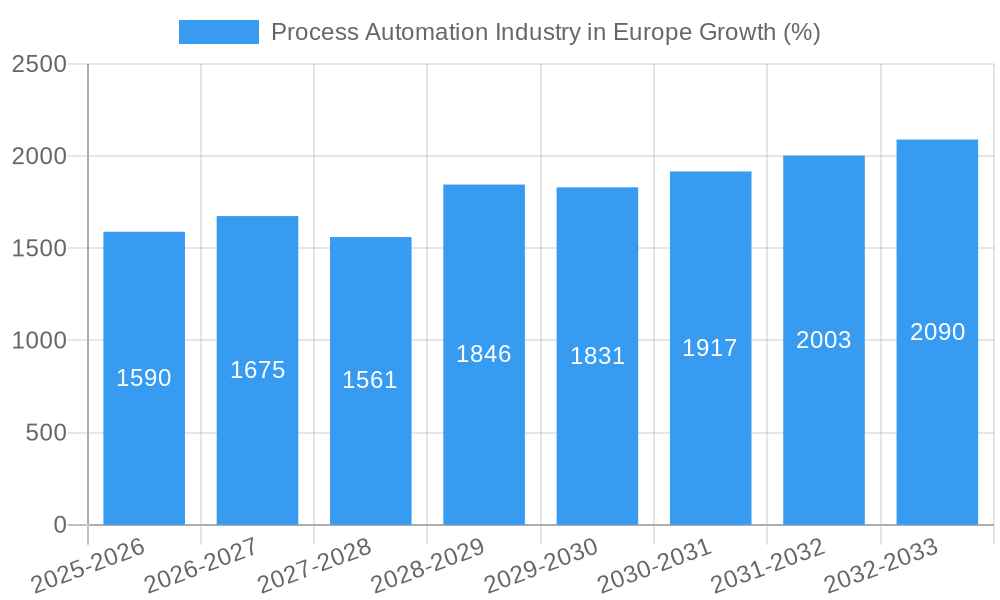
The European process automation market is experiencing robust growth, driven by factors such as increasing industrial automation, digital transformation initiatives across various end-user industries, and a growing focus on operational efficiency and productivity. The compound annual growth rate (CAGR) is projected to be xx% during the forecast period (2025-2033), with market penetration steadily increasing across various segments. Technological disruptions such as the Internet of Things (IoT), Artificial Intelligence (AI), and advanced analytics are significantly impacting market dynamics, pushing the adoption of smart automation solutions. Consumer preferences are shifting towards more advanced, flexible, and integrated automation systems offering greater efficiency and data-driven insights. Competitive dynamics are characterized by intense rivalry among established players and the emergence of new entrants offering specialized solutions.
Dominant Markets & Segments in Process Automation Industry in Europe
The UK, Germany, and France represent the largest national markets within Europe, driven by strong industrial bases and high adoption rates of automation technologies. Within segments, the wired communication protocol holds the largest market share, driven by its reliability and established infrastructure. System hardware constitutes a substantial portion of the market due to the need for physical components in most automation solutions. Sensors and transmitters are also high-growth segments due to increasing data demands and the need for accurate and real-time monitoring. The oil and gas, chemical and petrochemical, and power and utilities sectors are major end-users, driven by stringent operational requirements and safety regulations.
- Leading Region: Western Europe (UK, Germany, France)
- Key Drivers (UK): Strong industrial base, advanced technological infrastructure, government support for automation.
- Key Drivers (Germany): Strong manufacturing sector, automotive industry, and focus on Industry 4.0.
- Key Drivers (France): Growing investment in renewable energy and infrastructure projects.
- Dominant Segment: Wired Communication Protocol (due to reliability and established infrastructure). System Hardware (due to the importance of physical infrastructure). Sensors & Transmitters (due to increased data demand and real-time monitoring needs). Oil & Gas (due to high automation requirements and safety standards).
Process Automation Industry in Europe Product Developments
Recent product innovations focus on enhancing efficiency, connectivity, and data analytics capabilities. Key developments include advancements in smart sensors, cloud-based automation platforms, and AI-powered predictive maintenance solutions. These innovations improve operational efficiency, reduce downtime, and enhance data-driven decision-making. Companies are increasingly offering integrated solutions combining hardware and software components, providing a comprehensive automation ecosystem. The market fit is strong due to growing demand for sophisticated automation systems across various industrial sectors.
Report Scope & Segmentation Analysis
This report segments the European process automation market by communication protocol (wired, wireless), system type (hardware, software), software type (sensors & transmitters, other software), end-user industry (oil and gas, chemical and petrochemical, power and utilities, water & wastewater, food and beverage, paper & pulp, pharmaceutical, other), and country (United Kingdom, Germany, France, Rest of Europe). Each segment's market size, growth projections, and competitive dynamics are analyzed, providing detailed insights into the current landscape and future opportunities. The growth projections are based on detailed analysis of market drivers, technology advancements, and regulatory changes.
Key Drivers of Process Automation Industry in Europe Growth
Several key factors are driving the growth of the European process automation market:
- Technological Advancements: IoT, AI, and cloud computing enable smart and efficient automation solutions.
- Increased Demand for Automation: Businesses seek to improve productivity, efficiency, and reduce operational costs.
- Government Regulations: Compliance with safety and environmental standards necessitates automation.
- Digital Transformation Initiatives: Adoption of Industry 4.0 principles drives automation adoption.
Challenges in the Process Automation Industry in Europe Sector
The industry faces challenges including:
- High Initial Investment Costs: Automation projects can require significant upfront capital expenditure.
- Cybersecurity Concerns: Connected systems are vulnerable to cyber threats, requiring robust security measures.
- Integration Complexity: Integrating new systems into existing infrastructure can be complex and time-consuming.
- Skill Gaps: A shortage of skilled labor to design, implement, and maintain automation systems exists.
Emerging Opportunities in Process Automation Industry in Europe
Emerging opportunities include:
- Growth of Smart Manufacturing: Increased adoption of AI and IoT-based automation solutions.
- Expansion into New Industries: Automation adoption in sectors such as healthcare and agriculture.
- Development of Specialized Solutions: Creating tailored automation systems for specific industries and applications.
Leading Players in the Process Automation Industry in Europe Market
- Rockwell Automation
- Honeywell International Inc
- ABB Ltd
- Yokogawa Electric
- Emerson Electric Co
- Siemens AG
- General Electric Co
- Fuji Electric
- Schneider Electric
- Delta Electronics Limited
- Mitsubishi Electric
- Eaton Corporation
Key Developments in Process Automation Industry in Europe Industry
- July 2020: ABB introduced Ability Genix, a scalable advanced analytics platform enhancing operational efficiency.
- April 2021: Siemens launched the Simotics S-1FS2 servo motor, targeting the pharmaceutical and food industries.
Strategic Outlook for Process Automation Industry in Europe Market
The European process automation market is poised for continued growth, driven by technological advancements, increasing industrial automation, and the growing need for efficient and sustainable operations. The focus on Industry 4.0, digital transformation, and the rising adoption of AI and IoT are expected to fuel innovation and create significant market opportunities. Companies that invest in advanced technologies, develop tailored solutions, and address the challenges of integration and cybersecurity will be well-positioned for success in this dynamic market.
Process Automation Industry in Europe Segmentation
-
1. Communication Protocol
- 1.1. Wired
- 1.2. Wireless
-
2. System Type
-
2.1. By System Hardware
- 2.1.1. Supervis
- 2.1.2. Distributed Control System (DCS)
- 2.1.3. Programmable Logic Controller (PLC)
- 2.1.4. Manufacturing Execution System (MES)
- 2.1.5. Valves & Actuators
- 2.1.6. Electric Motors
- 2.1.7. Human Machine Interface (HMI)
- 2.1.8. Process Safety Systems
- 2.1.9. Sensors & Transmitters
-
2.2. By Software Type
-
2.2.1. APC (Standalone & Customized Solutions)
- 2.2.1.1. Advanced Regulatory Control
- 2.2.1.2. Multivariable Model
- 2.2.1.3. Inferential & Sequential
- 2.2.2. Data Analytics & Reporting-based Software
- 2.2.3. Other Software & Services
-
2.2.1. APC (Standalone & Customized Solutions)
-
2.1. By System Hardware
-
3. End-user Industry
- 3.1. Oil and Gas
- 3.2. Chemical and Petrochemical
- 3.3. Power and Utilities
- 3.4. Water & Wastewater
- 3.5. Food and Beverage
- 3.6. Paper & Pulp
- 3.7. Pharmaceutical
- 3.8. Other End-user Industries
Process Automation Industry in Europe Segmentation By Geography
-
1. North America
- 1.1. United States
- 1.2. Canada
- 1.3. Mexico
-
2. South America
- 2.1. Brazil
- 2.2. Argentina
- 2.3. Rest of South America
-
3. Europe
- 3.1. United Kingdom
- 3.2. Germany
- 3.3. France
- 3.4. Italy
- 3.5. Spain
- 3.6. Russia
- 3.7. Benelux
- 3.8. Nordics
- 3.9. Rest of Europe
-
4. Middle East & Africa
- 4.1. Turkey
- 4.2. Israel
- 4.3. GCC
- 4.4. North Africa
- 4.5. South Africa
- 4.6. Rest of Middle East & Africa
-
5. Asia Pacific
- 5.1. China
- 5.2. India
- 5.3. Japan
- 5.4. South Korea
- 5.5. ASEAN
- 5.6. Oceania
- 5.7. Rest of Asia Pacific
Process Automation Industry in Europe REPORT HIGHLIGHTS
| Aspects | Details |
|---|---|
| Study Period | 2019-2033 |
| Base Year | 2024 |
| Estimated Year | 2025 |
| Forecast Period | 2025-2033 |
| Historical Period | 2019-2024 |
| Growth Rate | CAGR of 6.18% from 2019-2033 |
| Segmentation |
|
Table of Contents
- 1. Introduction
- 1.1. Research Scope
- 1.2. Market Segmentation
- 1.3. Research Methodology
- 1.4. Definitions and Assumptions
- 2. Executive Summary
- 2.1. Introduction
- 3. Market Dynamics
- 3.1. Introduction
- 3.2. Market Drivers
- 3.2.1. Need to Upgrade the Existing Networks
- 3.3. Market Restrains
- 3.3.1. High cost of installation
- 3.4. Market Trends
- 3.4.1. Pharmaceutical Industry is Expected to Hold Significant Market Share
- 4. Market Factor Analysis
- 4.1. Porters Five Forces
- 4.2. Supply/Value Chain
- 4.3. PESTEL analysis
- 4.4. Market Entropy
- 4.5. Patent/Trademark Analysis
- 5. Global Process Automation Industry in Europe Analysis, Insights and Forecast, 2019-2031
- 5.1. Market Analysis, Insights and Forecast - by Communication Protocol
- 5.1.1. Wired
- 5.1.2. Wireless
- 5.2. Market Analysis, Insights and Forecast - by System Type
- 5.2.1. By System Hardware
- 5.2.1.1. Supervis
- 5.2.1.2. Distributed Control System (DCS)
- 5.2.1.3. Programmable Logic Controller (PLC)
- 5.2.1.4. Manufacturing Execution System (MES)
- 5.2.1.5. Valves & Actuators
- 5.2.1.6. Electric Motors
- 5.2.1.7. Human Machine Interface (HMI)
- 5.2.1.8. Process Safety Systems
- 5.2.1.9. Sensors & Transmitters
- 5.2.2. By Software Type
- 5.2.2.1. APC (Standalone & Customized Solutions)
- 5.2.2.1.1. Advanced Regulatory Control
- 5.2.2.1.2. Multivariable Model
- 5.2.2.1.3. Inferential & Sequential
- 5.2.2.2. Data Analytics & Reporting-based Software
- 5.2.2.3. Other Software & Services
- 5.2.2.1. APC (Standalone & Customized Solutions)
- 5.2.1. By System Hardware
- 5.3. Market Analysis, Insights and Forecast - by End-user Industry
- 5.3.1. Oil and Gas
- 5.3.2. Chemical and Petrochemical
- 5.3.3. Power and Utilities
- 5.3.4. Water & Wastewater
- 5.3.5. Food and Beverage
- 5.3.6. Paper & Pulp
- 5.3.7. Pharmaceutical
- 5.3.8. Other End-user Industries
- 5.4. Market Analysis, Insights and Forecast - by Region
- 5.4.1. North America
- 5.4.2. South America
- 5.4.3. Europe
- 5.4.4. Middle East & Africa
- 5.4.5. Asia Pacific
- 5.1. Market Analysis, Insights and Forecast - by Communication Protocol
- 6. North America Process Automation Industry in Europe Analysis, Insights and Forecast, 2019-2031
- 6.1. Market Analysis, Insights and Forecast - by Communication Protocol
- 6.1.1. Wired
- 6.1.2. Wireless
- 6.2. Market Analysis, Insights and Forecast - by System Type
- 6.2.1. By System Hardware
- 6.2.1.1. Supervis
- 6.2.1.2. Distributed Control System (DCS)
- 6.2.1.3. Programmable Logic Controller (PLC)
- 6.2.1.4. Manufacturing Execution System (MES)
- 6.2.1.5. Valves & Actuators
- 6.2.1.6. Electric Motors
- 6.2.1.7. Human Machine Interface (HMI)
- 6.2.1.8. Process Safety Systems
- 6.2.1.9. Sensors & Transmitters
- 6.2.2. By Software Type
- 6.2.2.1. APC (Standalone & Customized Solutions)
- 6.2.2.1.1. Advanced Regulatory Control
- 6.2.2.1.2. Multivariable Model
- 6.2.2.1.3. Inferential & Sequential
- 6.2.2.2. Data Analytics & Reporting-based Software
- 6.2.2.3. Other Software & Services
- 6.2.2.1. APC (Standalone & Customized Solutions)
- 6.2.1. By System Hardware
- 6.3. Market Analysis, Insights and Forecast - by End-user Industry
- 6.3.1. Oil and Gas
- 6.3.2. Chemical and Petrochemical
- 6.3.3. Power and Utilities
- 6.3.4. Water & Wastewater
- 6.3.5. Food and Beverage
- 6.3.6. Paper & Pulp
- 6.3.7. Pharmaceutical
- 6.3.8. Other End-user Industries
- 6.1. Market Analysis, Insights and Forecast - by Communication Protocol
- 7. South America Process Automation Industry in Europe Analysis, Insights and Forecast, 2019-2031
- 7.1. Market Analysis, Insights and Forecast - by Communication Protocol
- 7.1.1. Wired
- 7.1.2. Wireless
- 7.2. Market Analysis, Insights and Forecast - by System Type
- 7.2.1. By System Hardware
- 7.2.1.1. Supervis
- 7.2.1.2. Distributed Control System (DCS)
- 7.2.1.3. Programmable Logic Controller (PLC)
- 7.2.1.4. Manufacturing Execution System (MES)
- 7.2.1.5. Valves & Actuators
- 7.2.1.6. Electric Motors
- 7.2.1.7. Human Machine Interface (HMI)
- 7.2.1.8. Process Safety Systems
- 7.2.1.9. Sensors & Transmitters
- 7.2.2. By Software Type
- 7.2.2.1. APC (Standalone & Customized Solutions)
- 7.2.2.1.1. Advanced Regulatory Control
- 7.2.2.1.2. Multivariable Model
- 7.2.2.1.3. Inferential & Sequential
- 7.2.2.2. Data Analytics & Reporting-based Software
- 7.2.2.3. Other Software & Services
- 7.2.2.1. APC (Standalone & Customized Solutions)
- 7.2.1. By System Hardware
- 7.3. Market Analysis, Insights and Forecast - by End-user Industry
- 7.3.1. Oil and Gas
- 7.3.2. Chemical and Petrochemical
- 7.3.3. Power and Utilities
- 7.3.4. Water & Wastewater
- 7.3.5. Food and Beverage
- 7.3.6. Paper & Pulp
- 7.3.7. Pharmaceutical
- 7.3.8. Other End-user Industries
- 7.1. Market Analysis, Insights and Forecast - by Communication Protocol
- 8. Europe Process Automation Industry in Europe Analysis, Insights and Forecast, 2019-2031
- 8.1. Market Analysis, Insights and Forecast - by Communication Protocol
- 8.1.1. Wired
- 8.1.2. Wireless
- 8.2. Market Analysis, Insights and Forecast - by System Type
- 8.2.1. By System Hardware
- 8.2.1.1. Supervis
- 8.2.1.2. Distributed Control System (DCS)
- 8.2.1.3. Programmable Logic Controller (PLC)
- 8.2.1.4. Manufacturing Execution System (MES)
- 8.2.1.5. Valves & Actuators
- 8.2.1.6. Electric Motors
- 8.2.1.7. Human Machine Interface (HMI)
- 8.2.1.8. Process Safety Systems
- 8.2.1.9. Sensors & Transmitters
- 8.2.2. By Software Type
- 8.2.2.1. APC (Standalone & Customized Solutions)
- 8.2.2.1.1. Advanced Regulatory Control
- 8.2.2.1.2. Multivariable Model
- 8.2.2.1.3. Inferential & Sequential
- 8.2.2.2. Data Analytics & Reporting-based Software
- 8.2.2.3. Other Software & Services
- 8.2.2.1. APC (Standalone & Customized Solutions)
- 8.2.1. By System Hardware
- 8.3. Market Analysis, Insights and Forecast - by End-user Industry
- 8.3.1. Oil and Gas
- 8.3.2. Chemical and Petrochemical
- 8.3.3. Power and Utilities
- 8.3.4. Water & Wastewater
- 8.3.5. Food and Beverage
- 8.3.6. Paper & Pulp
- 8.3.7. Pharmaceutical
- 8.3.8. Other End-user Industries
- 8.1. Market Analysis, Insights and Forecast - by Communication Protocol
- 9. Middle East & Africa Process Automation Industry in Europe Analysis, Insights and Forecast, 2019-2031
- 9.1. Market Analysis, Insights and Forecast - by Communication Protocol
- 9.1.1. Wired
- 9.1.2. Wireless
- 9.2. Market Analysis, Insights and Forecast - by System Type
- 9.2.1. By System Hardware
- 9.2.1.1. Supervis
- 9.2.1.2. Distributed Control System (DCS)
- 9.2.1.3. Programmable Logic Controller (PLC)
- 9.2.1.4. Manufacturing Execution System (MES)
- 9.2.1.5. Valves & Actuators
- 9.2.1.6. Electric Motors
- 9.2.1.7. Human Machine Interface (HMI)
- 9.2.1.8. Process Safety Systems
- 9.2.1.9. Sensors & Transmitters
- 9.2.2. By Software Type
- 9.2.2.1. APC (Standalone & Customized Solutions)
- 9.2.2.1.1. Advanced Regulatory Control
- 9.2.2.1.2. Multivariable Model
- 9.2.2.1.3. Inferential & Sequential
- 9.2.2.2. Data Analytics & Reporting-based Software
- 9.2.2.3. Other Software & Services
- 9.2.2.1. APC (Standalone & Customized Solutions)
- 9.2.1. By System Hardware
- 9.3. Market Analysis, Insights and Forecast - by End-user Industry
- 9.3.1. Oil and Gas
- 9.3.2. Chemical and Petrochemical
- 9.3.3. Power and Utilities
- 9.3.4. Water & Wastewater
- 9.3.5. Food and Beverage
- 9.3.6. Paper & Pulp
- 9.3.7. Pharmaceutical
- 9.3.8. Other End-user Industries
- 9.1. Market Analysis, Insights and Forecast - by Communication Protocol
- 10. Asia Pacific Process Automation Industry in Europe Analysis, Insights and Forecast, 2019-2031
- 10.1. Market Analysis, Insights and Forecast - by Communication Protocol
- 10.1.1. Wired
- 10.1.2. Wireless
- 10.2. Market Analysis, Insights and Forecast - by System Type
- 10.2.1. By System Hardware
- 10.2.1.1. Supervis
- 10.2.1.2. Distributed Control System (DCS)
- 10.2.1.3. Programmable Logic Controller (PLC)
- 10.2.1.4. Manufacturing Execution System (MES)
- 10.2.1.5. Valves & Actuators
- 10.2.1.6. Electric Motors
- 10.2.1.7. Human Machine Interface (HMI)
- 10.2.1.8. Process Safety Systems
- 10.2.1.9. Sensors & Transmitters
- 10.2.2. By Software Type
- 10.2.2.1. APC (Standalone & Customized Solutions)
- 10.2.2.1.1. Advanced Regulatory Control
- 10.2.2.1.2. Multivariable Model
- 10.2.2.1.3. Inferential & Sequential
- 10.2.2.2. Data Analytics & Reporting-based Software
- 10.2.2.3. Other Software & Services
- 10.2.2.1. APC (Standalone & Customized Solutions)
- 10.2.1. By System Hardware
- 10.3. Market Analysis, Insights and Forecast - by End-user Industry
- 10.3.1. Oil and Gas
- 10.3.2. Chemical and Petrochemical
- 10.3.3. Power and Utilities
- 10.3.4. Water & Wastewater
- 10.3.5. Food and Beverage
- 10.3.6. Paper & Pulp
- 10.3.7. Pharmaceutical
- 10.3.8. Other End-user Industries
- 10.1. Market Analysis, Insights and Forecast - by Communication Protocol
- 11. Europe Process Automation Industry in Europe Analysis, Insights and Forecast, 2019-2031
- 11.1. Market Analysis, Insights and Forecast - By Country/Sub-region
- 11.1.1. undefined
- 12. Germany Process Automation Industry in Europe Analysis, Insights and Forecast, 2019-2031
- 12.1. Market Analysis, Insights and Forecast - By Country/Sub-region
- 12.1.1. undefined
- 13. France Process Automation Industry in Europe Analysis, Insights and Forecast, 2019-2031
- 13.1. Market Analysis, Insights and Forecast - By Country/Sub-region
- 13.1.1. undefined
- 14. Italy Process Automation Industry in Europe Analysis, Insights and Forecast, 2019-2031
- 14.1. Market Analysis, Insights and Forecast - By Country/Sub-region
- 14.1.1. undefined
- 15. United Kingdom Process Automation Industry in Europe Analysis, Insights and Forecast, 2019-2031
- 15.1. Market Analysis, Insights and Forecast - By Country/Sub-region
- 15.1.1. undefined
- 16. Netherlands Process Automation Industry in Europe Analysis, Insights and Forecast, 2019-2031
- 16.1. Market Analysis, Insights and Forecast - By Country/Sub-region
- 16.1.1. undefined
- 17. Sweden Process Automation Industry in Europe Analysis, Insights and Forecast, 2019-2031
- 17.1. Market Analysis, Insights and Forecast - By Country/Sub-region
- 17.1.1. undefined
- 18. Competitive Analysis
- 18.1. Global Market Share Analysis 2024
- 18.2. Company Profiles
- 18.2.1 Rockwell Automation
- 18.2.1.1. Overview
- 18.2.1.2. Products
- 18.2.1.3. SWOT Analysis
- 18.2.1.4. Recent Developments
- 18.2.1.5. Financials (Based on Availability)
- 18.2.2 Honeywell International Inc
- 18.2.2.1. Overview
- 18.2.2.2. Products
- 18.2.2.3. SWOT Analysis
- 18.2.2.4. Recent Developments
- 18.2.2.5. Financials (Based on Availability)
- 18.2.3 ABB Ltd
- 18.2.3.1. Overview
- 18.2.3.2. Products
- 18.2.3.3. SWOT Analysis
- 18.2.3.4. Recent Developments
- 18.2.3.5. Financials (Based on Availability)
- 18.2.4 Yokogawa Electric
- 18.2.4.1. Overview
- 18.2.4.2. Products
- 18.2.4.3. SWOT Analysis
- 18.2.4.4. Recent Developments
- 18.2.4.5. Financials (Based on Availability)
- 18.2.5 Emerson Electric Co
- 18.2.5.1. Overview
- 18.2.5.2. Products
- 18.2.5.3. SWOT Analysis
- 18.2.5.4. Recent Developments
- 18.2.5.5. Financials (Based on Availability)
- 18.2.6 Siemens AG
- 18.2.6.1. Overview
- 18.2.6.2. Products
- 18.2.6.3. SWOT Analysis
- 18.2.6.4. Recent Developments
- 18.2.6.5. Financials (Based on Availability)
- 18.2.7 General Electric Co
- 18.2.7.1. Overview
- 18.2.7.2. Products
- 18.2.7.3. SWOT Analysis
- 18.2.7.4. Recent Developments
- 18.2.7.5. Financials (Based on Availability)
- 18.2.8 Fuji Electric
- 18.2.8.1. Overview
- 18.2.8.2. Products
- 18.2.8.3. SWOT Analysis
- 18.2.8.4. Recent Developments
- 18.2.8.5. Financials (Based on Availability)
- 18.2.9 Schneider Electric
- 18.2.9.1. Overview
- 18.2.9.2. Products
- 18.2.9.3. SWOT Analysis
- 18.2.9.4. Recent Developments
- 18.2.9.5. Financials (Based on Availability)
- 18.2.10 Delta Electronics Limited
- 18.2.10.1. Overview
- 18.2.10.2. Products
- 18.2.10.3. SWOT Analysis
- 18.2.10.4. Recent Developments
- 18.2.10.5. Financials (Based on Availability)
- 18.2.11 Mitsubishi Electric
- 18.2.11.1. Overview
- 18.2.11.2. Products
- 18.2.11.3. SWOT Analysis
- 18.2.11.4. Recent Developments
- 18.2.11.5. Financials (Based on Availability)
- 18.2.12 Eaton Corporation
- 18.2.12.1. Overview
- 18.2.12.2. Products
- 18.2.12.3. SWOT Analysis
- 18.2.12.4. Recent Developments
- 18.2.12.5. Financials (Based on Availability)
- 18.2.1 Rockwell Automation
List of Figures
- Figure 1: Global Process Automation Industry in Europe Revenue Breakdown (Million, %) by Region 2024 & 2032
- Figure 2: Global Process Automation Industry in Europe Volume Breakdown (K Units, %) by Region 2024 & 2032
- Figure 3: Europe Process Automation Industry in Europe Revenue (Million), by Country 2024 & 2032
- Figure 4: Europe Process Automation Industry in Europe Volume (K Units), by Country 2024 & 2032
- Figure 5: Europe Process Automation Industry in Europe Revenue Share (%), by Country 2024 & 2032
- Figure 6: Europe Process Automation Industry in Europe Volume Share (%), by Country 2024 & 2032
- Figure 7: Germany Process Automation Industry in Europe Revenue (Million), by Country 2024 & 2032
- Figure 8: Germany Process Automation Industry in Europe Volume (K Units), by Country 2024 & 2032
- Figure 9: Germany Process Automation Industry in Europe Revenue Share (%), by Country 2024 & 2032
- Figure 10: Germany Process Automation Industry in Europe Volume Share (%), by Country 2024 & 2032
- Figure 11: France Process Automation Industry in Europe Revenue (Million), by Country 2024 & 2032
- Figure 12: France Process Automation Industry in Europe Volume (K Units), by Country 2024 & 2032
- Figure 13: France Process Automation Industry in Europe Revenue Share (%), by Country 2024 & 2032
- Figure 14: France Process Automation Industry in Europe Volume Share (%), by Country 2024 & 2032
- Figure 15: Italy Process Automation Industry in Europe Revenue (Million), by Country 2024 & 2032
- Figure 16: Italy Process Automation Industry in Europe Volume (K Units), by Country 2024 & 2032
- Figure 17: Italy Process Automation Industry in Europe Revenue Share (%), by Country 2024 & 2032
- Figure 18: Italy Process Automation Industry in Europe Volume Share (%), by Country 2024 & 2032
- Figure 19: United Kingdom Process Automation Industry in Europe Revenue (Million), by Country 2024 & 2032
- Figure 20: United Kingdom Process Automation Industry in Europe Volume (K Units), by Country 2024 & 2032
- Figure 21: United Kingdom Process Automation Industry in Europe Revenue Share (%), by Country 2024 & 2032
- Figure 22: United Kingdom Process Automation Industry in Europe Volume Share (%), by Country 2024 & 2032
- Figure 23: Netherlands Process Automation Industry in Europe Revenue (Million), by Country 2024 & 2032
- Figure 24: Netherlands Process Automation Industry in Europe Volume (K Units), by Country 2024 & 2032
- Figure 25: Netherlands Process Automation Industry in Europe Revenue Share (%), by Country 2024 & 2032
- Figure 26: Netherlands Process Automation Industry in Europe Volume Share (%), by Country 2024 & 2032
- Figure 27: Sweden Process Automation Industry in Europe Revenue (Million), by Country 2024 & 2032
- Figure 28: Sweden Process Automation Industry in Europe Volume (K Units), by Country 2024 & 2032
- Figure 29: Sweden Process Automation Industry in Europe Revenue Share (%), by Country 2024 & 2032
- Figure 30: Sweden Process Automation Industry in Europe Volume Share (%), by Country 2024 & 2032
- Figure 31: North America Process Automation Industry in Europe Revenue (Million), by Communication Protocol 2024 & 2032
- Figure 32: North America Process Automation Industry in Europe Volume (K Units), by Communication Protocol 2024 & 2032
- Figure 33: North America Process Automation Industry in Europe Revenue Share (%), by Communication Protocol 2024 & 2032
- Figure 34: North America Process Automation Industry in Europe Volume Share (%), by Communication Protocol 2024 & 2032
- Figure 35: North America Process Automation Industry in Europe Revenue (Million), by System Type 2024 & 2032
- Figure 36: North America Process Automation Industry in Europe Volume (K Units), by System Type 2024 & 2032
- Figure 37: North America Process Automation Industry in Europe Revenue Share (%), by System Type 2024 & 2032
- Figure 38: North America Process Automation Industry in Europe Volume Share (%), by System Type 2024 & 2032
- Figure 39: North America Process Automation Industry in Europe Revenue (Million), by End-user Industry 2024 & 2032
- Figure 40: North America Process Automation Industry in Europe Volume (K Units), by End-user Industry 2024 & 2032
- Figure 41: North America Process Automation Industry in Europe Revenue Share (%), by End-user Industry 2024 & 2032
- Figure 42: North America Process Automation Industry in Europe Volume Share (%), by End-user Industry 2024 & 2032
- Figure 43: North America Process Automation Industry in Europe Revenue (Million), by Country 2024 & 2032
- Figure 44: North America Process Automation Industry in Europe Volume (K Units), by Country 2024 & 2032
- Figure 45: North America Process Automation Industry in Europe Revenue Share (%), by Country 2024 & 2032
- Figure 46: North America Process Automation Industry in Europe Volume Share (%), by Country 2024 & 2032
- Figure 47: South America Process Automation Industry in Europe Revenue (Million), by Communication Protocol 2024 & 2032
- Figure 48: South America Process Automation Industry in Europe Volume (K Units), by Communication Protocol 2024 & 2032
- Figure 49: South America Process Automation Industry in Europe Revenue Share (%), by Communication Protocol 2024 & 2032
- Figure 50: South America Process Automation Industry in Europe Volume Share (%), by Communication Protocol 2024 & 2032
- Figure 51: South America Process Automation Industry in Europe Revenue (Million), by System Type 2024 & 2032
- Figure 52: South America Process Automation Industry in Europe Volume (K Units), by System Type 2024 & 2032
- Figure 53: South America Process Automation Industry in Europe Revenue Share (%), by System Type 2024 & 2032
- Figure 54: South America Process Automation Industry in Europe Volume Share (%), by System Type 2024 & 2032
- Figure 55: South America Process Automation Industry in Europe Revenue (Million), by End-user Industry 2024 & 2032
- Figure 56: South America Process Automation Industry in Europe Volume (K Units), by End-user Industry 2024 & 2032
- Figure 57: South America Process Automation Industry in Europe Revenue Share (%), by End-user Industry 2024 & 2032
- Figure 58: South America Process Automation Industry in Europe Volume Share (%), by End-user Industry 2024 & 2032
- Figure 59: South America Process Automation Industry in Europe Revenue (Million), by Country 2024 & 2032
- Figure 60: South America Process Automation Industry in Europe Volume (K Units), by Country 2024 & 2032
- Figure 61: South America Process Automation Industry in Europe Revenue Share (%), by Country 2024 & 2032
- Figure 62: South America Process Automation Industry in Europe Volume Share (%), by Country 2024 & 2032
- Figure 63: Europe Process Automation Industry in Europe Revenue (Million), by Communication Protocol 2024 & 2032
- Figure 64: Europe Process Automation Industry in Europe Volume (K Units), by Communication Protocol 2024 & 2032
- Figure 65: Europe Process Automation Industry in Europe Revenue Share (%), by Communication Protocol 2024 & 2032
- Figure 66: Europe Process Automation Industry in Europe Volume Share (%), by Communication Protocol 2024 & 2032
- Figure 67: Europe Process Automation Industry in Europe Revenue (Million), by System Type 2024 & 2032
- Figure 68: Europe Process Automation Industry in Europe Volume (K Units), by System Type 2024 & 2032
- Figure 69: Europe Process Automation Industry in Europe Revenue Share (%), by System Type 2024 & 2032
- Figure 70: Europe Process Automation Industry in Europe Volume Share (%), by System Type 2024 & 2032
- Figure 71: Europe Process Automation Industry in Europe Revenue (Million), by End-user Industry 2024 & 2032
- Figure 72: Europe Process Automation Industry in Europe Volume (K Units), by End-user Industry 2024 & 2032
- Figure 73: Europe Process Automation Industry in Europe Revenue Share (%), by End-user Industry 2024 & 2032
- Figure 74: Europe Process Automation Industry in Europe Volume Share (%), by End-user Industry 2024 & 2032
- Figure 75: Europe Process Automation Industry in Europe Revenue (Million), by Country 2024 & 2032
- Figure 76: Europe Process Automation Industry in Europe Volume (K Units), by Country 2024 & 2032
- Figure 77: Europe Process Automation Industry in Europe Revenue Share (%), by Country 2024 & 2032
- Figure 78: Europe Process Automation Industry in Europe Volume Share (%), by Country 2024 & 2032
- Figure 79: Middle East & Africa Process Automation Industry in Europe Revenue (Million), by Communication Protocol 2024 & 2032
- Figure 80: Middle East & Africa Process Automation Industry in Europe Volume (K Units), by Communication Protocol 2024 & 2032
- Figure 81: Middle East & Africa Process Automation Industry in Europe Revenue Share (%), by Communication Protocol 2024 & 2032
- Figure 82: Middle East & Africa Process Automation Industry in Europe Volume Share (%), by Communication Protocol 2024 & 2032
- Figure 83: Middle East & Africa Process Automation Industry in Europe Revenue (Million), by System Type 2024 & 2032
- Figure 84: Middle East & Africa Process Automation Industry in Europe Volume (K Units), by System Type 2024 & 2032
- Figure 85: Middle East & Africa Process Automation Industry in Europe Revenue Share (%), by System Type 2024 & 2032
- Figure 86: Middle East & Africa Process Automation Industry in Europe Volume Share (%), by System Type 2024 & 2032
- Figure 87: Middle East & Africa Process Automation Industry in Europe Revenue (Million), by End-user Industry 2024 & 2032
- Figure 88: Middle East & Africa Process Automation Industry in Europe Volume (K Units), by End-user Industry 2024 & 2032
- Figure 89: Middle East & Africa Process Automation Industry in Europe Revenue Share (%), by End-user Industry 2024 & 2032
- Figure 90: Middle East & Africa Process Automation Industry in Europe Volume Share (%), by End-user Industry 2024 & 2032
- Figure 91: Middle East & Africa Process Automation Industry in Europe Revenue (Million), by Country 2024 & 2032
- Figure 92: Middle East & Africa Process Automation Industry in Europe Volume (K Units), by Country 2024 & 2032
- Figure 93: Middle East & Africa Process Automation Industry in Europe Revenue Share (%), by Country 2024 & 2032
- Figure 94: Middle East & Africa Process Automation Industry in Europe Volume Share (%), by Country 2024 & 2032
- Figure 95: Asia Pacific Process Automation Industry in Europe Revenue (Million), by Communication Protocol 2024 & 2032
- Figure 96: Asia Pacific Process Automation Industry in Europe Volume (K Units), by Communication Protocol 2024 & 2032
- Figure 97: Asia Pacific Process Automation Industry in Europe Revenue Share (%), by Communication Protocol 2024 & 2032
- Figure 98: Asia Pacific Process Automation Industry in Europe Volume Share (%), by Communication Protocol 2024 & 2032
- Figure 99: Asia Pacific Process Automation Industry in Europe Revenue (Million), by System Type 2024 & 2032
- Figure 100: Asia Pacific Process Automation Industry in Europe Volume (K Units), by System Type 2024 & 2032
- Figure 101: Asia Pacific Process Automation Industry in Europe Revenue Share (%), by System Type 2024 & 2032
- Figure 102: Asia Pacific Process Automation Industry in Europe Volume Share (%), by System Type 2024 & 2032
- Figure 103: Asia Pacific Process Automation Industry in Europe Revenue (Million), by End-user Industry 2024 & 2032
- Figure 104: Asia Pacific Process Automation Industry in Europe Volume (K Units), by End-user Industry 2024 & 2032
- Figure 105: Asia Pacific Process Automation Industry in Europe Revenue Share (%), by End-user Industry 2024 & 2032
- Figure 106: Asia Pacific Process Automation Industry in Europe Volume Share (%), by End-user Industry 2024 & 2032
- Figure 107: Asia Pacific Process Automation Industry in Europe Revenue (Million), by Country 2024 & 2032
- Figure 108: Asia Pacific Process Automation Industry in Europe Volume (K Units), by Country 2024 & 2032
- Figure 109: Asia Pacific Process Automation Industry in Europe Revenue Share (%), by Country 2024 & 2032
- Figure 110: Asia Pacific Process Automation Industry in Europe Volume Share (%), by Country 2024 & 2032
List of Tables
- Table 1: Global Process Automation Industry in Europe Revenue Million Forecast, by Region 2019 & 2032
- Table 2: Global Process Automation Industry in Europe Volume K Units Forecast, by Region 2019 & 2032
- Table 3: Global Process Automation Industry in Europe Revenue Million Forecast, by Communication Protocol 2019 & 2032
- Table 4: Global Process Automation Industry in Europe Volume K Units Forecast, by Communication Protocol 2019 & 2032
- Table 5: Global Process Automation Industry in Europe Revenue Million Forecast, by System Type 2019 & 2032
- Table 6: Global Process Automation Industry in Europe Volume K Units Forecast, by System Type 2019 & 2032
- Table 7: Global Process Automation Industry in Europe Revenue Million Forecast, by End-user Industry 2019 & 2032
- Table 8: Global Process Automation Industry in Europe Volume K Units Forecast, by End-user Industry 2019 & 2032
- Table 9: Global Process Automation Industry in Europe Revenue Million Forecast, by Region 2019 & 2032
- Table 10: Global Process Automation Industry in Europe Volume K Units Forecast, by Region 2019 & 2032
- Table 11: Global Process Automation Industry in Europe Revenue Million Forecast, by Country 2019 & 2032
- Table 12: Global Process Automation Industry in Europe Volume K Units Forecast, by Country 2019 & 2032
- Table 13: Global Process Automation Industry in Europe Revenue Million Forecast, by Country 2019 & 2032
- Table 14: Global Process Automation Industry in Europe Volume K Units Forecast, by Country 2019 & 2032
- Table 15: Global Process Automation Industry in Europe Revenue Million Forecast, by Country 2019 & 2032
- Table 16: Global Process Automation Industry in Europe Volume K Units Forecast, by Country 2019 & 2032
- Table 17: Global Process Automation Industry in Europe Revenue Million Forecast, by Country 2019 & 2032
- Table 18: Global Process Automation Industry in Europe Volume K Units Forecast, by Country 2019 & 2032
- Table 19: Global Process Automation Industry in Europe Revenue Million Forecast, by Country 2019 & 2032
- Table 20: Global Process Automation Industry in Europe Volume K Units Forecast, by Country 2019 & 2032
- Table 21: Global Process Automation Industry in Europe Revenue Million Forecast, by Country 2019 & 2032
- Table 22: Global Process Automation Industry in Europe Volume K Units Forecast, by Country 2019 & 2032
- Table 23: Global Process Automation Industry in Europe Revenue Million Forecast, by Country 2019 & 2032
- Table 24: Global Process Automation Industry in Europe Volume K Units Forecast, by Country 2019 & 2032
- Table 25: Global Process Automation Industry in Europe Revenue Million Forecast, by Communication Protocol 2019 & 2032
- Table 26: Global Process Automation Industry in Europe Volume K Units Forecast, by Communication Protocol 2019 & 2032
- Table 27: Global Process Automation Industry in Europe Revenue Million Forecast, by System Type 2019 & 2032
- Table 28: Global Process Automation Industry in Europe Volume K Units Forecast, by System Type 2019 & 2032
- Table 29: Global Process Automation Industry in Europe Revenue Million Forecast, by End-user Industry 2019 & 2032
- Table 30: Global Process Automation Industry in Europe Volume K Units Forecast, by End-user Industry 2019 & 2032
- Table 31: Global Process Automation Industry in Europe Revenue Million Forecast, by Country 2019 & 2032
- Table 32: Global Process Automation Industry in Europe Volume K Units Forecast, by Country 2019 & 2032
- Table 33: United States Process Automation Industry in Europe Revenue (Million) Forecast, by Application 2019 & 2032
- Table 34: United States Process Automation Industry in Europe Volume (K Units) Forecast, by Application 2019 & 2032
- Table 35: Canada Process Automation Industry in Europe Revenue (Million) Forecast, by Application 2019 & 2032
- Table 36: Canada Process Automation Industry in Europe Volume (K Units) Forecast, by Application 2019 & 2032
- Table 37: Mexico Process Automation Industry in Europe Revenue (Million) Forecast, by Application 2019 & 2032
- Table 38: Mexico Process Automation Industry in Europe Volume (K Units) Forecast, by Application 2019 & 2032
- Table 39: Global Process Automation Industry in Europe Revenue Million Forecast, by Communication Protocol 2019 & 2032
- Table 40: Global Process Automation Industry in Europe Volume K Units Forecast, by Communication Protocol 2019 & 2032
- Table 41: Global Process Automation Industry in Europe Revenue Million Forecast, by System Type 2019 & 2032
- Table 42: Global Process Automation Industry in Europe Volume K Units Forecast, by System Type 2019 & 2032
- Table 43: Global Process Automation Industry in Europe Revenue Million Forecast, by End-user Industry 2019 & 2032
- Table 44: Global Process Automation Industry in Europe Volume K Units Forecast, by End-user Industry 2019 & 2032
- Table 45: Global Process Automation Industry in Europe Revenue Million Forecast, by Country 2019 & 2032
- Table 46: Global Process Automation Industry in Europe Volume K Units Forecast, by Country 2019 & 2032
- Table 47: Brazil Process Automation Industry in Europe Revenue (Million) Forecast, by Application 2019 & 2032
- Table 48: Brazil Process Automation Industry in Europe Volume (K Units) Forecast, by Application 2019 & 2032
- Table 49: Argentina Process Automation Industry in Europe Revenue (Million) Forecast, by Application 2019 & 2032
- Table 50: Argentina Process Automation Industry in Europe Volume (K Units) Forecast, by Application 2019 & 2032
- Table 51: Rest of South America Process Automation Industry in Europe Revenue (Million) Forecast, by Application 2019 & 2032
- Table 52: Rest of South America Process Automation Industry in Europe Volume (K Units) Forecast, by Application 2019 & 2032
- Table 53: Global Process Automation Industry in Europe Revenue Million Forecast, by Communication Protocol 2019 & 2032
- Table 54: Global Process Automation Industry in Europe Volume K Units Forecast, by Communication Protocol 2019 & 2032
- Table 55: Global Process Automation Industry in Europe Revenue Million Forecast, by System Type 2019 & 2032
- Table 56: Global Process Automation Industry in Europe Volume K Units Forecast, by System Type 2019 & 2032
- Table 57: Global Process Automation Industry in Europe Revenue Million Forecast, by End-user Industry 2019 & 2032
- Table 58: Global Process Automation Industry in Europe Volume K Units Forecast, by End-user Industry 2019 & 2032
- Table 59: Global Process Automation Industry in Europe Revenue Million Forecast, by Country 2019 & 2032
- Table 60: Global Process Automation Industry in Europe Volume K Units Forecast, by Country 2019 & 2032
- Table 61: United Kingdom Process Automation Industry in Europe Revenue (Million) Forecast, by Application 2019 & 2032
- Table 62: United Kingdom Process Automation Industry in Europe Volume (K Units) Forecast, by Application 2019 & 2032
- Table 63: Germany Process Automation Industry in Europe Revenue (Million) Forecast, by Application 2019 & 2032
- Table 64: Germany Process Automation Industry in Europe Volume (K Units) Forecast, by Application 2019 & 2032
- Table 65: France Process Automation Industry in Europe Revenue (Million) Forecast, by Application 2019 & 2032
- Table 66: France Process Automation Industry in Europe Volume (K Units) Forecast, by Application 2019 & 2032
- Table 67: Italy Process Automation Industry in Europe Revenue (Million) Forecast, by Application 2019 & 2032
- Table 68: Italy Process Automation Industry in Europe Volume (K Units) Forecast, by Application 2019 & 2032
- Table 69: Spain Process Automation Industry in Europe Revenue (Million) Forecast, by Application 2019 & 2032
- Table 70: Spain Process Automation Industry in Europe Volume (K Units) Forecast, by Application 2019 & 2032
- Table 71: Russia Process Automation Industry in Europe Revenue (Million) Forecast, by Application 2019 & 2032
- Table 72: Russia Process Automation Industry in Europe Volume (K Units) Forecast, by Application 2019 & 2032
- Table 73: Benelux Process Automation Industry in Europe Revenue (Million) Forecast, by Application 2019 & 2032
- Table 74: Benelux Process Automation Industry in Europe Volume (K Units) Forecast, by Application 2019 & 2032
- Table 75: Nordics Process Automation Industry in Europe Revenue (Million) Forecast, by Application 2019 & 2032
- Table 76: Nordics Process Automation Industry in Europe Volume (K Units) Forecast, by Application 2019 & 2032
- Table 77: Rest of Europe Process Automation Industry in Europe Revenue (Million) Forecast, by Application 2019 & 2032
- Table 78: Rest of Europe Process Automation Industry in Europe Volume (K Units) Forecast, by Application 2019 & 2032
- Table 79: Global Process Automation Industry in Europe Revenue Million Forecast, by Communication Protocol 2019 & 2032
- Table 80: Global Process Automation Industry in Europe Volume K Units Forecast, by Communication Protocol 2019 & 2032
- Table 81: Global Process Automation Industry in Europe Revenue Million Forecast, by System Type 2019 & 2032
- Table 82: Global Process Automation Industry in Europe Volume K Units Forecast, by System Type 2019 & 2032
- Table 83: Global Process Automation Industry in Europe Revenue Million Forecast, by End-user Industry 2019 & 2032
- Table 84: Global Process Automation Industry in Europe Volume K Units Forecast, by End-user Industry 2019 & 2032
- Table 85: Global Process Automation Industry in Europe Revenue Million Forecast, by Country 2019 & 2032
- Table 86: Global Process Automation Industry in Europe Volume K Units Forecast, by Country 2019 & 2032
- Table 87: Turkey Process Automation Industry in Europe Revenue (Million) Forecast, by Application 2019 & 2032
- Table 88: Turkey Process Automation Industry in Europe Volume (K Units) Forecast, by Application 2019 & 2032
- Table 89: Israel Process Automation Industry in Europe Revenue (Million) Forecast, by Application 2019 & 2032
- Table 90: Israel Process Automation Industry in Europe Volume (K Units) Forecast, by Application 2019 & 2032
- Table 91: GCC Process Automation Industry in Europe Revenue (Million) Forecast, by Application 2019 & 2032
- Table 92: GCC Process Automation Industry in Europe Volume (K Units) Forecast, by Application 2019 & 2032
- Table 93: North Africa Process Automation Industry in Europe Revenue (Million) Forecast, by Application 2019 & 2032
- Table 94: North Africa Process Automation Industry in Europe Volume (K Units) Forecast, by Application 2019 & 2032
- Table 95: South Africa Process Automation Industry in Europe Revenue (Million) Forecast, by Application 2019 & 2032
- Table 96: South Africa Process Automation Industry in Europe Volume (K Units) Forecast, by Application 2019 & 2032
- Table 97: Rest of Middle East & Africa Process Automation Industry in Europe Revenue (Million) Forecast, by Application 2019 & 2032
- Table 98: Rest of Middle East & Africa Process Automation Industry in Europe Volume (K Units) Forecast, by Application 2019 & 2032
- Table 99: Global Process Automation Industry in Europe Revenue Million Forecast, by Communication Protocol 2019 & 2032
- Table 100: Global Process Automation Industry in Europe Volume K Units Forecast, by Communication Protocol 2019 & 2032
- Table 101: Global Process Automation Industry in Europe Revenue Million Forecast, by System Type 2019 & 2032
- Table 102: Global Process Automation Industry in Europe Volume K Units Forecast, by System Type 2019 & 2032
- Table 103: Global Process Automation Industry in Europe Revenue Million Forecast, by End-user Industry 2019 & 2032
- Table 104: Global Process Automation Industry in Europe Volume K Units Forecast, by End-user Industry 2019 & 2032
- Table 105: Global Process Automation Industry in Europe Revenue Million Forecast, by Country 2019 & 2032
- Table 106: Global Process Automation Industry in Europe Volume K Units Forecast, by Country 2019 & 2032
- Table 107: China Process Automation Industry in Europe Revenue (Million) Forecast, by Application 2019 & 2032
- Table 108: China Process Automation Industry in Europe Volume (K Units) Forecast, by Application 2019 & 2032
- Table 109: India Process Automation Industry in Europe Revenue (Million) Forecast, by Application 2019 & 2032
- Table 110: India Process Automation Industry in Europe Volume (K Units) Forecast, by Application 2019 & 2032
- Table 111: Japan Process Automation Industry in Europe Revenue (Million) Forecast, by Application 2019 & 2032
- Table 112: Japan Process Automation Industry in Europe Volume (K Units) Forecast, by Application 2019 & 2032
- Table 113: South Korea Process Automation Industry in Europe Revenue (Million) Forecast, by Application 2019 & 2032
- Table 114: South Korea Process Automation Industry in Europe Volume (K Units) Forecast, by Application 2019 & 2032
- Table 115: ASEAN Process Automation Industry in Europe Revenue (Million) Forecast, by Application 2019 & 2032
- Table 116: ASEAN Process Automation Industry in Europe Volume (K Units) Forecast, by Application 2019 & 2032
- Table 117: Oceania Process Automation Industry in Europe Revenue (Million) Forecast, by Application 2019 & 2032
- Table 118: Oceania Process Automation Industry in Europe Volume (K Units) Forecast, by Application 2019 & 2032
- Table 119: Rest of Asia Pacific Process Automation Industry in Europe Revenue (Million) Forecast, by Application 2019 & 2032
- Table 120: Rest of Asia Pacific Process Automation Industry in Europe Volume (K Units) Forecast, by Application 2019 & 2032
Frequently Asked Questions
1. What is the projected Compound Annual Growth Rate (CAGR) of the Process Automation Industry in Europe?
The projected CAGR is approximately 6.18%.
2. Which companies are prominent players in the Process Automation Industry in Europe?
Key companies in the market include Rockwell Automation, Honeywell International Inc, ABB Ltd, Yokogawa Electric, Emerson Electric Co, Siemens AG, General Electric Co, Fuji Electric, Schneider Electric, Delta Electronics Limited, Mitsubishi Electric, Eaton Corporation.
3. What are the main segments of the Process Automation Industry in Europe?
The market segments include Communication Protocol, System Type, End-user Industry.
4. Can you provide details about the market size?
The market size is estimated to be USD XX Million as of 2022.
5. What are some drivers contributing to market growth?
Need to Upgrade the Existing Networks.
6. What are the notable trends driving market growth?
Pharmaceutical Industry is Expected to Hold Significant Market Share.
7. Are there any restraints impacting market growth?
High cost of installation.
8. Can you provide examples of recent developments in the market?
April 2021 - Siemens launched a new servo motor. The Simotics S-1FS2 comes with a stainless-steel casing, IP67/IP69 protection, and high-resolution 22-bit absolute multiturn encoders catering to the pharmaceutical and food industries.
9. What pricing options are available for accessing the report?
Pricing options include single-user, multi-user, and enterprise licenses priced at USD 4750, USD 4950, and USD 6800 respectively.
10. Is the market size provided in terms of value or volume?
The market size is provided in terms of value, measured in Million and volume, measured in K Units.
11. Are there any specific market keywords associated with the report?
Yes, the market keyword associated with the report is "Process Automation Industry in Europe," which aids in identifying and referencing the specific market segment covered.
12. How do I determine which pricing option suits my needs best?
The pricing options vary based on user requirements and access needs. Individual users may opt for single-user licenses, while businesses requiring broader access may choose multi-user or enterprise licenses for cost-effective access to the report.
13. Are there any additional resources or data provided in the Process Automation Industry in Europe report?
While the report offers comprehensive insights, it's advisable to review the specific contents or supplementary materials provided to ascertain if additional resources or data are available.
14. How can I stay updated on further developments or reports in the Process Automation Industry in Europe?
To stay informed about further developments, trends, and reports in the Process Automation Industry in Europe, consider subscribing to industry newsletters, following relevant companies and organizations, or regularly checking reputable industry news sources and publications.
Methodology
Step 1 - Identification of Relevant Samples Size from Population Database


Step 2 - Approaches for Defining Global Market Size (Value, Volume* & Price*)

Note*: In applicable scenarios
Step 3 - Data Sources
Primary Research
- Web Analytics
- Survey Reports
- Research Institute
- Latest Research Reports
- Opinion Leaders
Secondary Research
- Annual Reports
- White Paper
- Latest Press Release
- Industry Association
- Paid Database
- Investor Presentations

Step 4 - Data Triangulation
Involves using different sources of information in order to increase the validity of a study
These sources are likely to be stakeholders in a program - participants, other researchers, program staff, other community members, and so on.
Then we put all data in single framework & apply various statistical tools to find out the dynamic on the market.
During the analysis stage, feedback from the stakeholder groups would be compared to determine areas of agreement as well as areas of divergence


