
Key Insights
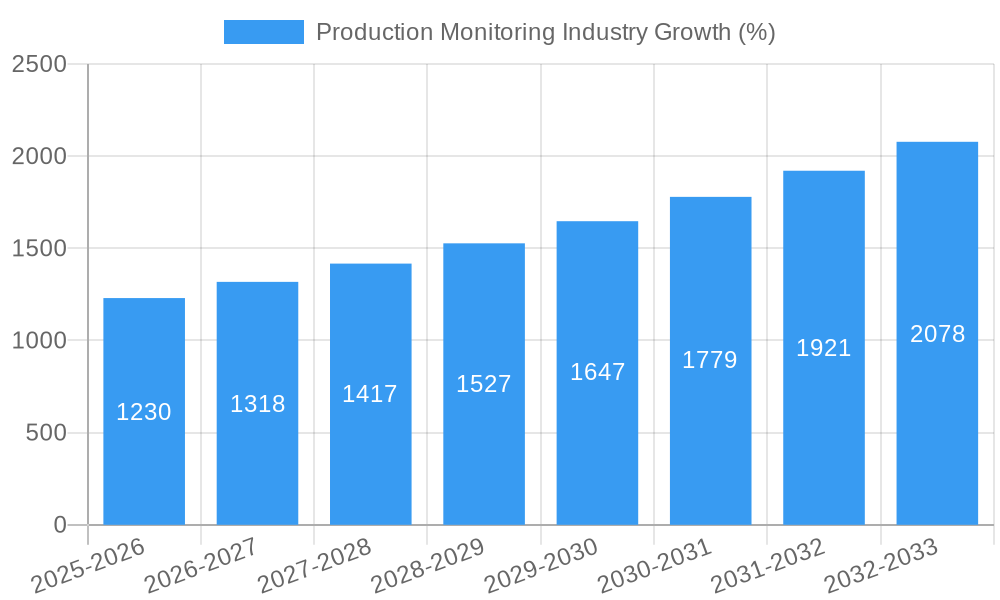
The Production Monitoring market is experiencing robust growth, driven by the increasing need for enhanced operational efficiency and real-time insights across diverse industries. A Compound Annual Growth Rate (CAGR) of 8.20% from 2019 to 2024 suggests a significant market expansion. This growth is fueled by several key factors. The adoption of Industry 4.0 technologies, including the Internet of Things (IoT), big data analytics, and cloud computing, enables manufacturers to collect and analyze vast amounts of production data for improved decision-making. Furthermore, stringent regulatory compliance requirements and the rising demand for product quality and traceability are pushing businesses to implement comprehensive production monitoring systems. The shift towards cloud-based deployment models offers scalability and cost-effectiveness, further accelerating market adoption. Significant regional variations exist, with North America and Europe currently holding substantial market shares due to early adoption and established industrial infrastructure. However, rapidly developing economies in Asia-Pacific are projected to witness significant growth in the coming years, driven by increasing industrialization and government initiatives promoting technological advancements. The market is segmented by component (solutions, services), deployment (cloud, on-premise), application (business process optimization, logistics, emergency management, automation), and end-user industries (oil & gas, automotive, healthcare, etc.). Competition is intense, with established players and emerging technology providers vying for market share. The forecast period (2025-2033) anticipates continued growth, particularly in advanced applications like predictive maintenance and AI-powered optimization. This will likely lead to further market consolidation and innovation.
The diverse application segments within the production monitoring market contribute significantly to its overall expansion. Business process optimization is a major driver, as real-time data enables streamlined workflows and reduced downtime. Logistics and supply chain management benefit from improved visibility and tracking, enhancing efficiency and reducing delays. Emergency and incident management systems leveraging production monitoring data offer faster response times and improved safety protocols. The integration of advanced automation and control management systems through robust monitoring capabilities allows for proactive adjustments and optimization of manufacturing processes. The end-user industries are also witnessing varied growth rates, with sectors like automotive and energy & power displaying high adoption due to their reliance on complex and high-value production processes. The continuing advancements in sensor technology, data analytics, and artificial intelligence are projected to significantly improve the capabilities of production monitoring systems in the coming years, further stimulating market growth. Competitive pressures will continue to drive innovation and enhance product offerings, leading to a more sophisticated and interconnected production monitoring landscape.
Production Monitoring Industry: A Comprehensive Market Report (2019-2033)
This in-depth report provides a comprehensive analysis of the global production monitoring industry, encompassing market size, segmentation, growth drivers, challenges, and future outlook. The study period covers 2019-2033, with 2025 serving as the base and estimated year. The forecast period extends from 2025 to 2033, while the historical period analyzed is 2019-2024. The report leverages extensive primary and secondary research to deliver actionable insights for industry stakeholders, investors, and businesses operating within this dynamic sector. The total market value in 2025 is estimated at $XX Million.
Production Monitoring Industry Market Concentration & Innovation
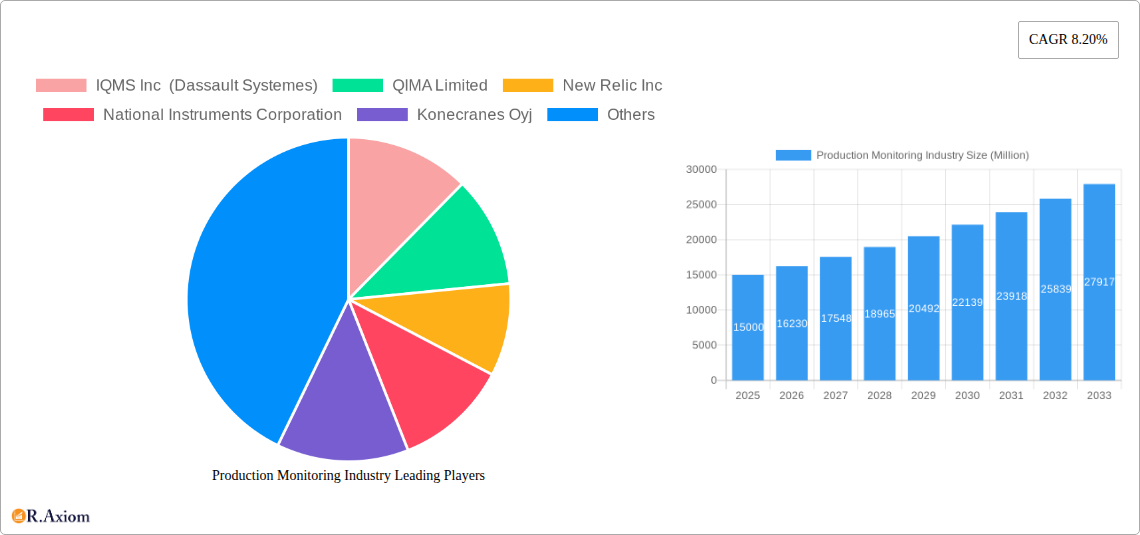
This section analyzes the competitive landscape of the production monitoring industry, focusing on market concentration, innovation drivers, regulatory influences, and industry dynamics. The report assesses the market share of key players such as IQMS Inc (Dassault Systemes), QIMA Limited, New Relic Inc, National Instruments Corporation, Konecranes Oyj, Capgemini SE, Emerson Electric Co, Siemens AG, Oracle Corporation, and Rockwell Automation Inc. Market concentration is measured using metrics like the Herfindahl-Hirschman Index (HHI), providing insights into market competitiveness.
- Market Share Analysis: The report details the market share held by each major player in 2025, highlighting the presence of both established players and emerging companies. For example, Dassault Systèmes is predicted to hold approximately XX% of the market share in 2025.
- Innovation Drivers: Key technological advancements driving market growth are identified and analyzed, including the adoption of AI, IoT, and cloud computing in production monitoring solutions.
- Regulatory Landscape: The report examines relevant regulations and standards impacting the industry, including data privacy and cybersecurity regulations, which are projected to influence the market's growth trajectory in the forecast period.
- M&A Activities: The report documents significant mergers and acquisitions (M&A) within the industry during the historical period (2019-2024), with estimated deal values. A total of XX Million was invested in M&A activities during this period.
- Product Substitutes: The report explores potential substitutes for production monitoring solutions and assesses their impact on market growth and competition.
- End-User Trends: The report analyzes the changing needs and preferences of end-users across various sectors, influencing the demand for advanced production monitoring capabilities.
Production Monitoring Industry Industry Trends & Insights
This section delves into the key trends shaping the production monitoring industry. The compound annual growth rate (CAGR) of the market during the forecast period (2025-2033) is projected to be XX%, driven by several key factors, including increasing adoption of Industry 4.0 technologies, the growing need for improved operational efficiency and reduced downtime across diverse industries, and rising demand for real-time data analytics for better decision-making. Market penetration of cloud-based production monitoring solutions is estimated to reach XX% by 2033, reflecting a shift away from on-premise deployments.
The report also analyzes consumer preferences and competitive dynamics, identifying key factors contributing to the market's overall growth and potential disruption from emerging technologies and innovative business models. The increasing demand for predictive maintenance solutions and the integration of artificial intelligence (AI) and machine learning (ML) into production monitoring systems are examined in detail. The analysis of competitive dynamics considers pricing strategies, product differentiation, and market positioning of leading players.
Dominant Markets & Segments in Production Monitoring Industry
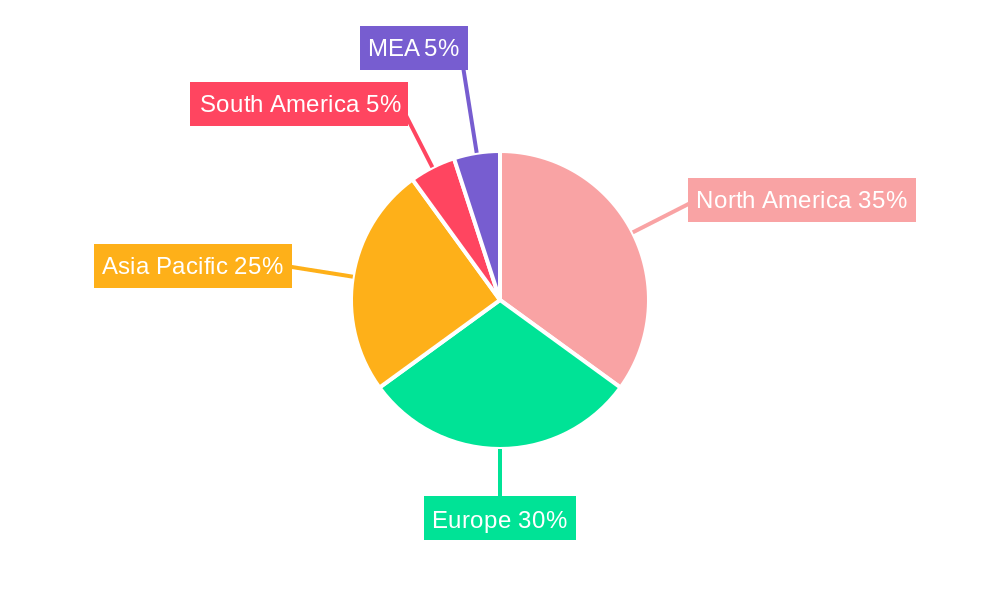
This section identifies the dominant regions, countries, and market segments within the production monitoring industry. The report details market size and growth projections for each segment, highlighting leading regions and applications based on factors including economic growth, industrial infrastructure development, and government initiatives promoting industrial automation.
Dominant Regions & Countries: [Detailed analysis of regional dominance, including factors like economic policies and infrastructure development, will be included here. Specific country-level data and rankings will be provided, identifying those with highest market size and fastest growth rates]. For example, North America is expected to retain its position as a leading market due to early adoption of advanced technologies and robust industrial base.
Dominant Segments:
- Component: Solutions segment is projected to dominate, driven by increasing demand for sophisticated analytics and real-time monitoring capabilities.
- Deployment: Cloud deployment is expected to exhibit the highest CAGR, driven by its scalability, cost-effectiveness and accessibility.
- Application: Business Process Optimization is expected to be a leading application, followed closely by Logistics and Supply Chain Management, due to their significant impact on operational efficiency.
- End User: The automotive and manufacturing sectors are projected to be the largest end-users, driven by their need for improved production efficiency and quality control.
[Detailed analysis of each segment's key drivers, including economic policies and infrastructure, will be included here with specific data points.]
Production Monitoring Industry Product Developments
Recent advancements in production monitoring technology are transforming the industry, focusing on increased automation, improved data analytics, and seamless integration with existing enterprise systems. Innovative solutions leveraging AI, machine learning, and the Industrial Internet of Things (IIoT) are gaining traction. These advancements provide enhanced predictive maintenance capabilities, real-time performance insights, and improved operational efficiency, leading to significant cost savings and enhanced productivity for end-users. The competitive advantage hinges on the ability to provide accurate, real-time data analytics, seamless integration capabilities, and robust security features.
Report Scope & Segmentation Analysis
This report provides a detailed analysis of the production monitoring market, segmented by component (solutions, services), deployment (cloud, on-premise), application (business process optimization, logistics and supply chain management, emergency and incident management, automation and control management), and end-user (oil and gas, chemical, automotive, energy and power, food and beverage, aerospace and defense, healthcare and life sciences, other end-users). Each segment's growth projections, market size, and competitive dynamics are thoroughly examined. Market sizes are provided for each segment for the base year (2025) and forecast years (2025-2033). The competitive dynamics of each segment are analyzed, highlighting key players and their market strategies.
Key Drivers of Production Monitoring Industry Growth
Several factors contribute to the growth of the production monitoring industry. Technological advancements, particularly in AI, IoT, and cloud computing, are driving the adoption of sophisticated monitoring solutions. Growing demand for improved operational efficiency, reduced downtime, and enhanced productivity across various industries fuels this growth. Furthermore, stringent regulatory requirements in certain sectors necessitate robust monitoring systems for compliance and safety. Government initiatives promoting industrial automation in several countries are also significant contributors to market expansion. Economic growth and increased investment in manufacturing infrastructure further support industry expansion.
Challenges in the Production Monitoring Industry Sector
Despite significant growth potential, the production monitoring industry faces challenges. High initial investment costs for implementing advanced monitoring systems can hinder adoption, particularly for small and medium-sized enterprises (SMEs). Data security and privacy concerns are major obstacles, requiring robust cybersecurity measures. Integrating diverse systems and data sources can be complex and time-consuming. The industry also faces intense competition, necessitating continuous innovation and differentiation to maintain a competitive edge. The lack of skilled professionals to implement and manage these complex systems is another constraint. These factors combined might affect industry growth by an estimated XX Million annually.
Emerging Opportunities in Production Monitoring Industry
The production monitoring market presents several promising opportunities. The growing adoption of Industry 4.0 principles and the increasing use of predictive maintenance are creating demand for advanced analytics and AI-powered solutions. Expansion into new markets, especially in developing economies, presents considerable growth potential. The development of integrated solutions that seamlessly connect production monitoring systems with other enterprise systems is a major area of focus. Leveraging emerging technologies, such as edge computing and digital twins, can unlock further efficiencies and enhance value propositions. These factors could contribute to an additional XX Million in market value by 2033.
Leading Players in the Production Monitoring Industry Market
- IQMS Inc (Dassault Systemes)
- QIMA Limited
- New Relic Inc
- National Instruments Corporation
- Konecranes Oyj
- Capgemini SE
- Emerson Electric Co
- Siemens AG
- Oracle Corporation
- Rockwell Automation Inc
Key Developments in Production Monitoring Industry Industry
- 2022, Q4: Siemens AG launched a new edge computing platform for production monitoring, enhancing real-time data processing capabilities. This is expected to increase market share by approximately XX% in 2026.
- 2023, Q1: Rockwell Automation Inc. acquired a smaller production monitoring technology provider, expanding its product portfolio and market reach. This acquisition is projected to increase market value by XX Million by 2030.
- 2024, Q2: New Relic Inc. released a major upgrade to its cloud-based production monitoring platform, improving scalability and data analysis capabilities. This upgrade increased customer base by XX%.
- [Include further developments with specific dates and quantifiable impacts whenever possible]
Strategic Outlook for Production Monitoring Industry Market
The production monitoring industry is poised for sustained growth, driven by technological advancements, increasing demand for operational efficiency, and expanding adoption across various sectors. The integration of AI and machine learning will be instrumental in unlocking advanced analytics and predictive capabilities. The shift towards cloud-based solutions and edge computing will enhance scalability and data processing capabilities. Focus on cybersecurity and data privacy will be critical for ensuring the secure and reliable operation of production monitoring systems. The continued development of innovative solutions tailored to the specific needs of diverse industries will drive further market expansion. This could add XX Million to the market value within the forecast period.
Production Monitoring Industry Segmentation
-
1. Component
- 1.1. Solutions
- 1.2. Services
-
2. Deployment
- 2.1. Cloud
- 2.2. On-premise
-
3. Application
- 3.1. Business Process Optimization
- 3.2. Logistics and Supply Chain Management
- 3.3. Emergency and Incident Management
- 3.4. Automation and Control Management
-
4. End User
- 4.1. Oil and Gas
- 4.2. Chemical
- 4.3. Automotive
- 4.4. Energy and Power
- 4.5. Food and Beverage
- 4.6. Aerospace and Defense
- 4.7. Healthcare and Life Sciences
- 4.8. Other End Users
Production Monitoring Industry Segmentation By Geography
-
1. North America
- 1.1. United States
- 1.2. Canada
-
2. Europe
- 2.1. Germany
- 2.2. United Kingdom
- 2.3. France
- 2.4. Rest of Europe
-
3. Asia Pacific
- 3.1. India
- 3.2. China
- 3.3. Japan
- 3.4. Rest of Asia Pacific
-
4. Rest of the World
- 4.1. Latin America
- 4.2. Middle East and Africa
Production Monitoring Industry REPORT HIGHLIGHTS
| Aspects | Details |
|---|---|
| Study Period | 2019-2033 |
| Base Year | 2024 |
| Estimated Year | 2025 |
| Forecast Period | 2025-2033 |
| Historical Period | 2019-2024 |
| Growth Rate | CAGR of 8.20% from 2019-2033 |
| Segmentation |
|
Table of Contents
- 1. Introduction
- 1.1. Research Scope
- 1.2. Market Segmentation
- 1.3. Research Methodology
- 1.4. Definitions and Assumptions
- 2. Executive Summary
- 2.1. Introduction
- 3. Market Dynamics
- 3.1. Introduction
- 3.2. Market Drivers
- 3.2.1. ; Demand for Centralized Monitoring and Predictive Maintenance of Assets; Adoption of IoT-based Solution for Control and Monitoring of Additive Manufacturing Processes
- 3.3. Market Restrains
- 3.3.1. ; Data Security Concerns and Privacy Issues
- 3.4. Market Trends
- 3.4.1. Automation and Control Management to Witness Significant Growth in Oil and Gas
- 4. Market Factor Analysis
- 4.1. Porters Five Forces
- 4.2. Supply/Value Chain
- 4.3. PESTEL analysis
- 4.4. Market Entropy
- 4.5. Patent/Trademark Analysis
- 5. Global Production Monitoring Industry Analysis, Insights and Forecast, 2019-2031
- 5.1. Market Analysis, Insights and Forecast - by Component
- 5.1.1. Solutions
- 5.1.2. Services
- 5.2. Market Analysis, Insights and Forecast - by Deployment
- 5.2.1. Cloud
- 5.2.2. On-premise
- 5.3. Market Analysis, Insights and Forecast - by Application
- 5.3.1. Business Process Optimization
- 5.3.2. Logistics and Supply Chain Management
- 5.3.3. Emergency and Incident Management
- 5.3.4. Automation and Control Management
- 5.4. Market Analysis, Insights and Forecast - by End User
- 5.4.1. Oil and Gas
- 5.4.2. Chemical
- 5.4.3. Automotive
- 5.4.4. Energy and Power
- 5.4.5. Food and Beverage
- 5.4.6. Aerospace and Defense
- 5.4.7. Healthcare and Life Sciences
- 5.4.8. Other End Users
- 5.5. Market Analysis, Insights and Forecast - by Region
- 5.5.1. North America
- 5.5.2. Europe
- 5.5.3. Asia Pacific
- 5.5.4. Rest of the World
- 5.1. Market Analysis, Insights and Forecast - by Component
- 6. North America Production Monitoring Industry Analysis, Insights and Forecast, 2019-2031
- 6.1. Market Analysis, Insights and Forecast - by Component
- 6.1.1. Solutions
- 6.1.2. Services
- 6.2. Market Analysis, Insights and Forecast - by Deployment
- 6.2.1. Cloud
- 6.2.2. On-premise
- 6.3. Market Analysis, Insights and Forecast - by Application
- 6.3.1. Business Process Optimization
- 6.3.2. Logistics and Supply Chain Management
- 6.3.3. Emergency and Incident Management
- 6.3.4. Automation and Control Management
- 6.4. Market Analysis, Insights and Forecast - by End User
- 6.4.1. Oil and Gas
- 6.4.2. Chemical
- 6.4.3. Automotive
- 6.4.4. Energy and Power
- 6.4.5. Food and Beverage
- 6.4.6. Aerospace and Defense
- 6.4.7. Healthcare and Life Sciences
- 6.4.8. Other End Users
- 6.1. Market Analysis, Insights and Forecast - by Component
- 7. Europe Production Monitoring Industry Analysis, Insights and Forecast, 2019-2031
- 7.1. Market Analysis, Insights and Forecast - by Component
- 7.1.1. Solutions
- 7.1.2. Services
- 7.2. Market Analysis, Insights and Forecast - by Deployment
- 7.2.1. Cloud
- 7.2.2. On-premise
- 7.3. Market Analysis, Insights and Forecast - by Application
- 7.3.1. Business Process Optimization
- 7.3.2. Logistics and Supply Chain Management
- 7.3.3. Emergency and Incident Management
- 7.3.4. Automation and Control Management
- 7.4. Market Analysis, Insights and Forecast - by End User
- 7.4.1. Oil and Gas
- 7.4.2. Chemical
- 7.4.3. Automotive
- 7.4.4. Energy and Power
- 7.4.5. Food and Beverage
- 7.4.6. Aerospace and Defense
- 7.4.7. Healthcare and Life Sciences
- 7.4.8. Other End Users
- 7.1. Market Analysis, Insights and Forecast - by Component
- 8. Asia Pacific Production Monitoring Industry Analysis, Insights and Forecast, 2019-2031
- 8.1. Market Analysis, Insights and Forecast - by Component
- 8.1.1. Solutions
- 8.1.2. Services
- 8.2. Market Analysis, Insights and Forecast - by Deployment
- 8.2.1. Cloud
- 8.2.2. On-premise
- 8.3. Market Analysis, Insights and Forecast - by Application
- 8.3.1. Business Process Optimization
- 8.3.2. Logistics and Supply Chain Management
- 8.3.3. Emergency and Incident Management
- 8.3.4. Automation and Control Management
- 8.4. Market Analysis, Insights and Forecast - by End User
- 8.4.1. Oil and Gas
- 8.4.2. Chemical
- 8.4.3. Automotive
- 8.4.4. Energy and Power
- 8.4.5. Food and Beverage
- 8.4.6. Aerospace and Defense
- 8.4.7. Healthcare and Life Sciences
- 8.4.8. Other End Users
- 8.1. Market Analysis, Insights and Forecast - by Component
- 9. Rest of the World Production Monitoring Industry Analysis, Insights and Forecast, 2019-2031
- 9.1. Market Analysis, Insights and Forecast - by Component
- 9.1.1. Solutions
- 9.1.2. Services
- 9.2. Market Analysis, Insights and Forecast - by Deployment
- 9.2.1. Cloud
- 9.2.2. On-premise
- 9.3. Market Analysis, Insights and Forecast - by Application
- 9.3.1. Business Process Optimization
- 9.3.2. Logistics and Supply Chain Management
- 9.3.3. Emergency and Incident Management
- 9.3.4. Automation and Control Management
- 9.4. Market Analysis, Insights and Forecast - by End User
- 9.4.1. Oil and Gas
- 9.4.2. Chemical
- 9.4.3. Automotive
- 9.4.4. Energy and Power
- 9.4.5. Food and Beverage
- 9.4.6. Aerospace and Defense
- 9.4.7. Healthcare and Life Sciences
- 9.4.8. Other End Users
- 9.1. Market Analysis, Insights and Forecast - by Component
- 10. North America Production Monitoring Industry Analysis, Insights and Forecast, 2019-2031
- 10.1. Market Analysis, Insights and Forecast - By Country/Sub-region
- 10.1.1 United States
- 10.1.2 Canada
- 10.1.3 Mexico
- 11. Europe Production Monitoring Industry Analysis, Insights and Forecast, 2019-2031
- 11.1. Market Analysis, Insights and Forecast - By Country/Sub-region
- 11.1.1 Germany
- 11.1.2 United Kingdom
- 11.1.3 France
- 11.1.4 Spain
- 11.1.5 Italy
- 11.1.6 Spain
- 11.1.7 Belgium
- 11.1.8 Netherland
- 11.1.9 Nordics
- 11.1.10 Rest of Europe
- 12. Asia Pacific Production Monitoring Industry Analysis, Insights and Forecast, 2019-2031
- 12.1. Market Analysis, Insights and Forecast - By Country/Sub-region
- 12.1.1 China
- 12.1.2 Japan
- 12.1.3 India
- 12.1.4 South Korea
- 12.1.5 Southeast Asia
- 12.1.6 Australia
- 12.1.7 Indonesia
- 12.1.8 Phillipes
- 12.1.9 Singapore
- 12.1.10 Thailandc
- 12.1.11 Rest of Asia Pacific
- 13. South America Production Monitoring Industry Analysis, Insights and Forecast, 2019-2031
- 13.1. Market Analysis, Insights and Forecast - By Country/Sub-region
- 13.1.1 Brazil
- 13.1.2 Argentina
- 13.1.3 Peru
- 13.1.4 Chile
- 13.1.5 Colombia
- 13.1.6 Ecuador
- 13.1.7 Venezuela
- 13.1.8 Rest of South America
- 14. North America Production Monitoring Industry Analysis, Insights and Forecast, 2019-2031
- 14.1. Market Analysis, Insights and Forecast - By Country/Sub-region
- 14.1.1 United States
- 14.1.2 Canada
- 14.1.3 Mexico
- 15. MEA Production Monitoring Industry Analysis, Insights and Forecast, 2019-2031
- 15.1. Market Analysis, Insights and Forecast - By Country/Sub-region
- 15.1.1 United Arab Emirates
- 15.1.2 Saudi Arabia
- 15.1.3 South Africa
- 15.1.4 Rest of Middle East and Africa
- 16. Competitive Analysis
- 16.1. Global Market Share Analysis 2024
- 16.2. Company Profiles
- 16.2.1 IQMS Inc (Dassault Systemes)
- 16.2.1.1. Overview
- 16.2.1.2. Products
- 16.2.1.3. SWOT Analysis
- 16.2.1.4. Recent Developments
- 16.2.1.5. Financials (Based on Availability)
- 16.2.2 QIMA Limited
- 16.2.2.1. Overview
- 16.2.2.2. Products
- 16.2.2.3. SWOT Analysis
- 16.2.2.4. Recent Developments
- 16.2.2.5. Financials (Based on Availability)
- 16.2.3 New Relic Inc
- 16.2.3.1. Overview
- 16.2.3.2. Products
- 16.2.3.3. SWOT Analysis
- 16.2.3.4. Recent Developments
- 16.2.3.5. Financials (Based on Availability)
- 16.2.4 National Instruments Corporation
- 16.2.4.1. Overview
- 16.2.4.2. Products
- 16.2.4.3. SWOT Analysis
- 16.2.4.4. Recent Developments
- 16.2.4.5. Financials (Based on Availability)
- 16.2.5 Konecranes Oyj
- 16.2.5.1. Overview
- 16.2.5.2. Products
- 16.2.5.3. SWOT Analysis
- 16.2.5.4. Recent Developments
- 16.2.5.5. Financials (Based on Availability)
- 16.2.6 Capgemini SE
- 16.2.6.1. Overview
- 16.2.6.2. Products
- 16.2.6.3. SWOT Analysis
- 16.2.6.4. Recent Developments
- 16.2.6.5. Financials (Based on Availability)
- 16.2.7 Emerson Electric Co
- 16.2.7.1. Overview
- 16.2.7.2. Products
- 16.2.7.3. SWOT Analysis
- 16.2.7.4. Recent Developments
- 16.2.7.5. Financials (Based on Availability)
- 16.2.8 Siemens AG
- 16.2.8.1. Overview
- 16.2.8.2. Products
- 16.2.8.3. SWOT Analysis
- 16.2.8.4. Recent Developments
- 16.2.8.5. Financials (Based on Availability)
- 16.2.9 Oracle Corporation
- 16.2.9.1. Overview
- 16.2.9.2. Products
- 16.2.9.3. SWOT Analysis
- 16.2.9.4. Recent Developments
- 16.2.9.5. Financials (Based on Availability)
- 16.2.10 Rockwell Automation Inc
- 16.2.10.1. Overview
- 16.2.10.2. Products
- 16.2.10.3. SWOT Analysis
- 16.2.10.4. Recent Developments
- 16.2.10.5. Financials (Based on Availability)
- 16.2.1 IQMS Inc (Dassault Systemes)
List of Figures
- Figure 1: Global Production Monitoring Industry Revenue Breakdown (Million, %) by Region 2024 & 2032
- Figure 2: North America Production Monitoring Industry Revenue (Million), by Country 2024 & 2032
- Figure 3: North America Production Monitoring Industry Revenue Share (%), by Country 2024 & 2032
- Figure 4: Europe Production Monitoring Industry Revenue (Million), by Country 2024 & 2032
- Figure 5: Europe Production Monitoring Industry Revenue Share (%), by Country 2024 & 2032
- Figure 6: Asia Pacific Production Monitoring Industry Revenue (Million), by Country 2024 & 2032
- Figure 7: Asia Pacific Production Monitoring Industry Revenue Share (%), by Country 2024 & 2032
- Figure 8: South America Production Monitoring Industry Revenue (Million), by Country 2024 & 2032
- Figure 9: South America Production Monitoring Industry Revenue Share (%), by Country 2024 & 2032
- Figure 10: North America Production Monitoring Industry Revenue (Million), by Country 2024 & 2032
- Figure 11: North America Production Monitoring Industry Revenue Share (%), by Country 2024 & 2032
- Figure 12: MEA Production Monitoring Industry Revenue (Million), by Country 2024 & 2032
- Figure 13: MEA Production Monitoring Industry Revenue Share (%), by Country 2024 & 2032
- Figure 14: North America Production Monitoring Industry Revenue (Million), by Component 2024 & 2032
- Figure 15: North America Production Monitoring Industry Revenue Share (%), by Component 2024 & 2032
- Figure 16: North America Production Monitoring Industry Revenue (Million), by Deployment 2024 & 2032
- Figure 17: North America Production Monitoring Industry Revenue Share (%), by Deployment 2024 & 2032
- Figure 18: North America Production Monitoring Industry Revenue (Million), by Application 2024 & 2032
- Figure 19: North America Production Monitoring Industry Revenue Share (%), by Application 2024 & 2032
- Figure 20: North America Production Monitoring Industry Revenue (Million), by End User 2024 & 2032
- Figure 21: North America Production Monitoring Industry Revenue Share (%), by End User 2024 & 2032
- Figure 22: North America Production Monitoring Industry Revenue (Million), by Country 2024 & 2032
- Figure 23: North America Production Monitoring Industry Revenue Share (%), by Country 2024 & 2032
- Figure 24: Europe Production Monitoring Industry Revenue (Million), by Component 2024 & 2032
- Figure 25: Europe Production Monitoring Industry Revenue Share (%), by Component 2024 & 2032
- Figure 26: Europe Production Monitoring Industry Revenue (Million), by Deployment 2024 & 2032
- Figure 27: Europe Production Monitoring Industry Revenue Share (%), by Deployment 2024 & 2032
- Figure 28: Europe Production Monitoring Industry Revenue (Million), by Application 2024 & 2032
- Figure 29: Europe Production Monitoring Industry Revenue Share (%), by Application 2024 & 2032
- Figure 30: Europe Production Monitoring Industry Revenue (Million), by End User 2024 & 2032
- Figure 31: Europe Production Monitoring Industry Revenue Share (%), by End User 2024 & 2032
- Figure 32: Europe Production Monitoring Industry Revenue (Million), by Country 2024 & 2032
- Figure 33: Europe Production Monitoring Industry Revenue Share (%), by Country 2024 & 2032
- Figure 34: Asia Pacific Production Monitoring Industry Revenue (Million), by Component 2024 & 2032
- Figure 35: Asia Pacific Production Monitoring Industry Revenue Share (%), by Component 2024 & 2032
- Figure 36: Asia Pacific Production Monitoring Industry Revenue (Million), by Deployment 2024 & 2032
- Figure 37: Asia Pacific Production Monitoring Industry Revenue Share (%), by Deployment 2024 & 2032
- Figure 38: Asia Pacific Production Monitoring Industry Revenue (Million), by Application 2024 & 2032
- Figure 39: Asia Pacific Production Monitoring Industry Revenue Share (%), by Application 2024 & 2032
- Figure 40: Asia Pacific Production Monitoring Industry Revenue (Million), by End User 2024 & 2032
- Figure 41: Asia Pacific Production Monitoring Industry Revenue Share (%), by End User 2024 & 2032
- Figure 42: Asia Pacific Production Monitoring Industry Revenue (Million), by Country 2024 & 2032
- Figure 43: Asia Pacific Production Monitoring Industry Revenue Share (%), by Country 2024 & 2032
- Figure 44: Rest of the World Production Monitoring Industry Revenue (Million), by Component 2024 & 2032
- Figure 45: Rest of the World Production Monitoring Industry Revenue Share (%), by Component 2024 & 2032
- Figure 46: Rest of the World Production Monitoring Industry Revenue (Million), by Deployment 2024 & 2032
- Figure 47: Rest of the World Production Monitoring Industry Revenue Share (%), by Deployment 2024 & 2032
- Figure 48: Rest of the World Production Monitoring Industry Revenue (Million), by Application 2024 & 2032
- Figure 49: Rest of the World Production Monitoring Industry Revenue Share (%), by Application 2024 & 2032
- Figure 50: Rest of the World Production Monitoring Industry Revenue (Million), by End User 2024 & 2032
- Figure 51: Rest of the World Production Monitoring Industry Revenue Share (%), by End User 2024 & 2032
- Figure 52: Rest of the World Production Monitoring Industry Revenue (Million), by Country 2024 & 2032
- Figure 53: Rest of the World Production Monitoring Industry Revenue Share (%), by Country 2024 & 2032
List of Tables
- Table 1: Global Production Monitoring Industry Revenue Million Forecast, by Region 2019 & 2032
- Table 2: Global Production Monitoring Industry Revenue Million Forecast, by Component 2019 & 2032
- Table 3: Global Production Monitoring Industry Revenue Million Forecast, by Deployment 2019 & 2032
- Table 4: Global Production Monitoring Industry Revenue Million Forecast, by Application 2019 & 2032
- Table 5: Global Production Monitoring Industry Revenue Million Forecast, by End User 2019 & 2032
- Table 6: Global Production Monitoring Industry Revenue Million Forecast, by Region 2019 & 2032
- Table 7: Global Production Monitoring Industry Revenue Million Forecast, by Country 2019 & 2032
- Table 8: United States Production Monitoring Industry Revenue (Million) Forecast, by Application 2019 & 2032
- Table 9: Canada Production Monitoring Industry Revenue (Million) Forecast, by Application 2019 & 2032
- Table 10: Mexico Production Monitoring Industry Revenue (Million) Forecast, by Application 2019 & 2032
- Table 11: Global Production Monitoring Industry Revenue Million Forecast, by Country 2019 & 2032
- Table 12: Germany Production Monitoring Industry Revenue (Million) Forecast, by Application 2019 & 2032
- Table 13: United Kingdom Production Monitoring Industry Revenue (Million) Forecast, by Application 2019 & 2032
- Table 14: France Production Monitoring Industry Revenue (Million) Forecast, by Application 2019 & 2032
- Table 15: Spain Production Monitoring Industry Revenue (Million) Forecast, by Application 2019 & 2032
- Table 16: Italy Production Monitoring Industry Revenue (Million) Forecast, by Application 2019 & 2032
- Table 17: Spain Production Monitoring Industry Revenue (Million) Forecast, by Application 2019 & 2032
- Table 18: Belgium Production Monitoring Industry Revenue (Million) Forecast, by Application 2019 & 2032
- Table 19: Netherland Production Monitoring Industry Revenue (Million) Forecast, by Application 2019 & 2032
- Table 20: Nordics Production Monitoring Industry Revenue (Million) Forecast, by Application 2019 & 2032
- Table 21: Rest of Europe Production Monitoring Industry Revenue (Million) Forecast, by Application 2019 & 2032
- Table 22: Global Production Monitoring Industry Revenue Million Forecast, by Country 2019 & 2032
- Table 23: China Production Monitoring Industry Revenue (Million) Forecast, by Application 2019 & 2032
- Table 24: Japan Production Monitoring Industry Revenue (Million) Forecast, by Application 2019 & 2032
- Table 25: India Production Monitoring Industry Revenue (Million) Forecast, by Application 2019 & 2032
- Table 26: South Korea Production Monitoring Industry Revenue (Million) Forecast, by Application 2019 & 2032
- Table 27: Southeast Asia Production Monitoring Industry Revenue (Million) Forecast, by Application 2019 & 2032
- Table 28: Australia Production Monitoring Industry Revenue (Million) Forecast, by Application 2019 & 2032
- Table 29: Indonesia Production Monitoring Industry Revenue (Million) Forecast, by Application 2019 & 2032
- Table 30: Phillipes Production Monitoring Industry Revenue (Million) Forecast, by Application 2019 & 2032
- Table 31: Singapore Production Monitoring Industry Revenue (Million) Forecast, by Application 2019 & 2032
- Table 32: Thailandc Production Monitoring Industry Revenue (Million) Forecast, by Application 2019 & 2032
- Table 33: Rest of Asia Pacific Production Monitoring Industry Revenue (Million) Forecast, by Application 2019 & 2032
- Table 34: Global Production Monitoring Industry Revenue Million Forecast, by Country 2019 & 2032
- Table 35: Brazil Production Monitoring Industry Revenue (Million) Forecast, by Application 2019 & 2032
- Table 36: Argentina Production Monitoring Industry Revenue (Million) Forecast, by Application 2019 & 2032
- Table 37: Peru Production Monitoring Industry Revenue (Million) Forecast, by Application 2019 & 2032
- Table 38: Chile Production Monitoring Industry Revenue (Million) Forecast, by Application 2019 & 2032
- Table 39: Colombia Production Monitoring Industry Revenue (Million) Forecast, by Application 2019 & 2032
- Table 40: Ecuador Production Monitoring Industry Revenue (Million) Forecast, by Application 2019 & 2032
- Table 41: Venezuela Production Monitoring Industry Revenue (Million) Forecast, by Application 2019 & 2032
- Table 42: Rest of South America Production Monitoring Industry Revenue (Million) Forecast, by Application 2019 & 2032
- Table 43: Global Production Monitoring Industry Revenue Million Forecast, by Country 2019 & 2032
- Table 44: United States Production Monitoring Industry Revenue (Million) Forecast, by Application 2019 & 2032
- Table 45: Canada Production Monitoring Industry Revenue (Million) Forecast, by Application 2019 & 2032
- Table 46: Mexico Production Monitoring Industry Revenue (Million) Forecast, by Application 2019 & 2032
- Table 47: Global Production Monitoring Industry Revenue Million Forecast, by Country 2019 & 2032
- Table 48: United Arab Emirates Production Monitoring Industry Revenue (Million) Forecast, by Application 2019 & 2032
- Table 49: Saudi Arabia Production Monitoring Industry Revenue (Million) Forecast, by Application 2019 & 2032
- Table 50: South Africa Production Monitoring Industry Revenue (Million) Forecast, by Application 2019 & 2032
- Table 51: Rest of Middle East and Africa Production Monitoring Industry Revenue (Million) Forecast, by Application 2019 & 2032
- Table 52: Global Production Monitoring Industry Revenue Million Forecast, by Component 2019 & 2032
- Table 53: Global Production Monitoring Industry Revenue Million Forecast, by Deployment 2019 & 2032
- Table 54: Global Production Monitoring Industry Revenue Million Forecast, by Application 2019 & 2032
- Table 55: Global Production Monitoring Industry Revenue Million Forecast, by End User 2019 & 2032
- Table 56: Global Production Monitoring Industry Revenue Million Forecast, by Country 2019 & 2032
- Table 57: United States Production Monitoring Industry Revenue (Million) Forecast, by Application 2019 & 2032
- Table 58: Canada Production Monitoring Industry Revenue (Million) Forecast, by Application 2019 & 2032
- Table 59: Global Production Monitoring Industry Revenue Million Forecast, by Component 2019 & 2032
- Table 60: Global Production Monitoring Industry Revenue Million Forecast, by Deployment 2019 & 2032
- Table 61: Global Production Monitoring Industry Revenue Million Forecast, by Application 2019 & 2032
- Table 62: Global Production Monitoring Industry Revenue Million Forecast, by End User 2019 & 2032
- Table 63: Global Production Monitoring Industry Revenue Million Forecast, by Country 2019 & 2032
- Table 64: Germany Production Monitoring Industry Revenue (Million) Forecast, by Application 2019 & 2032
- Table 65: United Kingdom Production Monitoring Industry Revenue (Million) Forecast, by Application 2019 & 2032
- Table 66: France Production Monitoring Industry Revenue (Million) Forecast, by Application 2019 & 2032
- Table 67: Rest of Europe Production Monitoring Industry Revenue (Million) Forecast, by Application 2019 & 2032
- Table 68: Global Production Monitoring Industry Revenue Million Forecast, by Component 2019 & 2032
- Table 69: Global Production Monitoring Industry Revenue Million Forecast, by Deployment 2019 & 2032
- Table 70: Global Production Monitoring Industry Revenue Million Forecast, by Application 2019 & 2032
- Table 71: Global Production Monitoring Industry Revenue Million Forecast, by End User 2019 & 2032
- Table 72: Global Production Monitoring Industry Revenue Million Forecast, by Country 2019 & 2032
- Table 73: India Production Monitoring Industry Revenue (Million) Forecast, by Application 2019 & 2032
- Table 74: China Production Monitoring Industry Revenue (Million) Forecast, by Application 2019 & 2032
- Table 75: Japan Production Monitoring Industry Revenue (Million) Forecast, by Application 2019 & 2032
- Table 76: Rest of Asia Pacific Production Monitoring Industry Revenue (Million) Forecast, by Application 2019 & 2032
- Table 77: Global Production Monitoring Industry Revenue Million Forecast, by Component 2019 & 2032
- Table 78: Global Production Monitoring Industry Revenue Million Forecast, by Deployment 2019 & 2032
- Table 79: Global Production Monitoring Industry Revenue Million Forecast, by Application 2019 & 2032
- Table 80: Global Production Monitoring Industry Revenue Million Forecast, by End User 2019 & 2032
- Table 81: Global Production Monitoring Industry Revenue Million Forecast, by Country 2019 & 2032
- Table 82: Latin America Production Monitoring Industry Revenue (Million) Forecast, by Application 2019 & 2032
- Table 83: Middle East and Africa Production Monitoring Industry Revenue (Million) Forecast, by Application 2019 & 2032
Frequently Asked Questions
1. What is the projected Compound Annual Growth Rate (CAGR) of the Production Monitoring Industry?
The projected CAGR is approximately 8.20%.
2. Which companies are prominent players in the Production Monitoring Industry?
Key companies in the market include IQMS Inc (Dassault Systemes), QIMA Limited, New Relic Inc, National Instruments Corporation, Konecranes Oyj, Capgemini SE, Emerson Electric Co, Siemens AG, Oracle Corporation, Rockwell Automation Inc.
3. What are the main segments of the Production Monitoring Industry?
The market segments include Component, Deployment, Application, End User.
4. Can you provide details about the market size?
The market size is estimated to be USD XX Million as of 2022.
5. What are some drivers contributing to market growth?
; Demand for Centralized Monitoring and Predictive Maintenance of Assets; Adoption of IoT-based Solution for Control and Monitoring of Additive Manufacturing Processes.
6. What are the notable trends driving market growth?
Automation and Control Management to Witness Significant Growth in Oil and Gas.
7. Are there any restraints impacting market growth?
; Data Security Concerns and Privacy Issues.
8. Can you provide examples of recent developments in the market?
N/A
9. What pricing options are available for accessing the report?
Pricing options include single-user, multi-user, and enterprise licenses priced at USD 4750, USD 5250, and USD 8750 respectively.
10. Is the market size provided in terms of value or volume?
The market size is provided in terms of value, measured in Million.
11. Are there any specific market keywords associated with the report?
Yes, the market keyword associated with the report is "Production Monitoring Industry," which aids in identifying and referencing the specific market segment covered.
12. How do I determine which pricing option suits my needs best?
The pricing options vary based on user requirements and access needs. Individual users may opt for single-user licenses, while businesses requiring broader access may choose multi-user or enterprise licenses for cost-effective access to the report.
13. Are there any additional resources or data provided in the Production Monitoring Industry report?
While the report offers comprehensive insights, it's advisable to review the specific contents or supplementary materials provided to ascertain if additional resources or data are available.
14. How can I stay updated on further developments or reports in the Production Monitoring Industry?
To stay informed about further developments, trends, and reports in the Production Monitoring Industry, consider subscribing to industry newsletters, following relevant companies and organizations, or regularly checking reputable industry news sources and publications.
Methodology
Step 1 - Identification of Relevant Samples Size from Population Database


Step 2 - Approaches for Defining Global Market Size (Value, Volume* & Price*)

Note*: In applicable scenarios
Step 3 - Data Sources
Primary Research
- Web Analytics
- Survey Reports
- Research Institute
- Latest Research Reports
- Opinion Leaders
Secondary Research
- Annual Reports
- White Paper
- Latest Press Release
- Industry Association
- Paid Database
- Investor Presentations

Step 4 - Data Triangulation
Involves using different sources of information in order to increase the validity of a study
These sources are likely to be stakeholders in a program - participants, other researchers, program staff, other community members, and so on.
Then we put all data in single framework & apply various statistical tools to find out the dynamic on the market.
During the analysis stage, feedback from the stakeholder groups would be compared to determine areas of agreement as well as areas of divergence


