
Key Insights
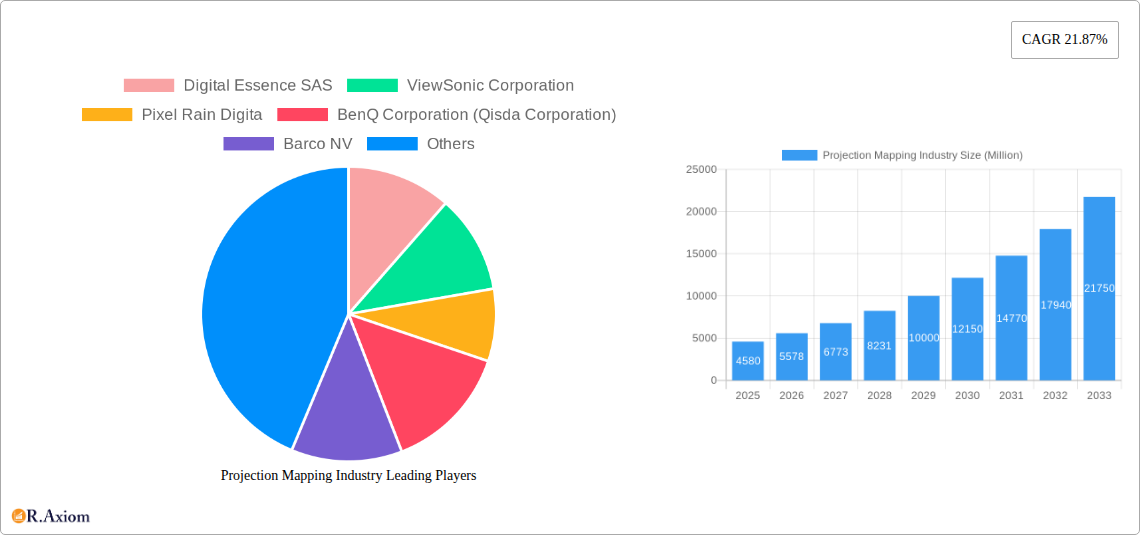
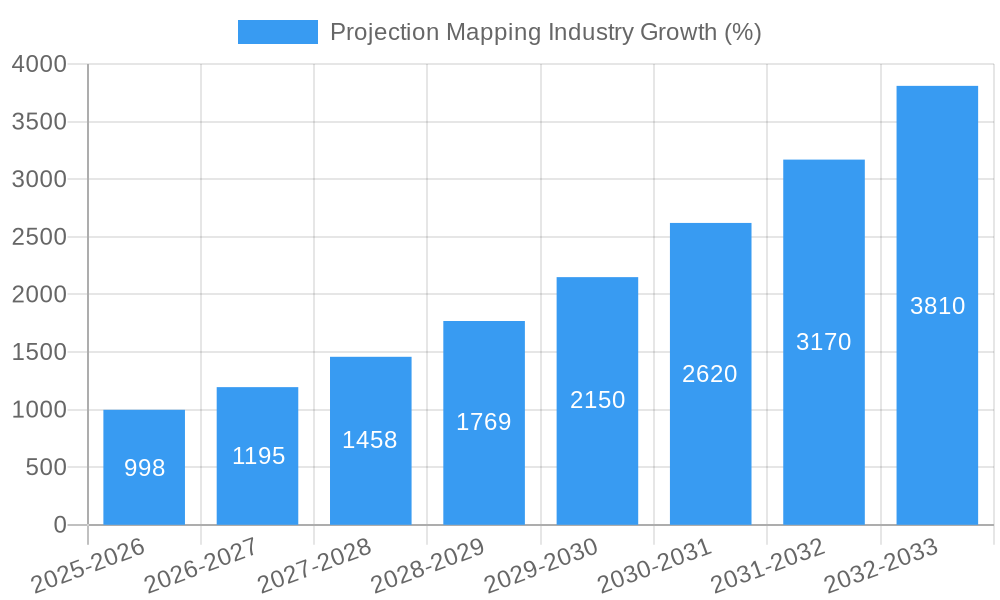
The projection mapping market, valued at $4.58 billion in 2025, is experiencing robust growth, projected to expand at a Compound Annual Growth Rate (CAGR) of 21.87% from 2025 to 2033. This surge is driven by several key factors. The increasing adoption of immersive technologies in entertainment, events, and large-venue installations fuels demand for sophisticated projection mapping solutions. Technological advancements, such as higher resolution projectors, improved software capabilities for content creation and mapping, and the emergence of 4D projection mapping experiences, are enhancing the visual appeal and application possibilities of the technology. Furthermore, the rising popularity of themed entertainment parks and experiential marketing campaigns further contributes to market expansion. Competition is fierce, with established players like Barco, Epson, and NEC Display Solutions alongside innovative companies like Digital Essence SAS and Pixel Rain Digital vying for market share. The market is segmented by offering (hardware and software), dimension (2D, 3D, 4D), throw distance (standard and short), and application (large venues, events, festivals, entertainment, and other applications). Growth is expected to be particularly strong in Asia, driven by expanding entertainment sectors and technological adoption.
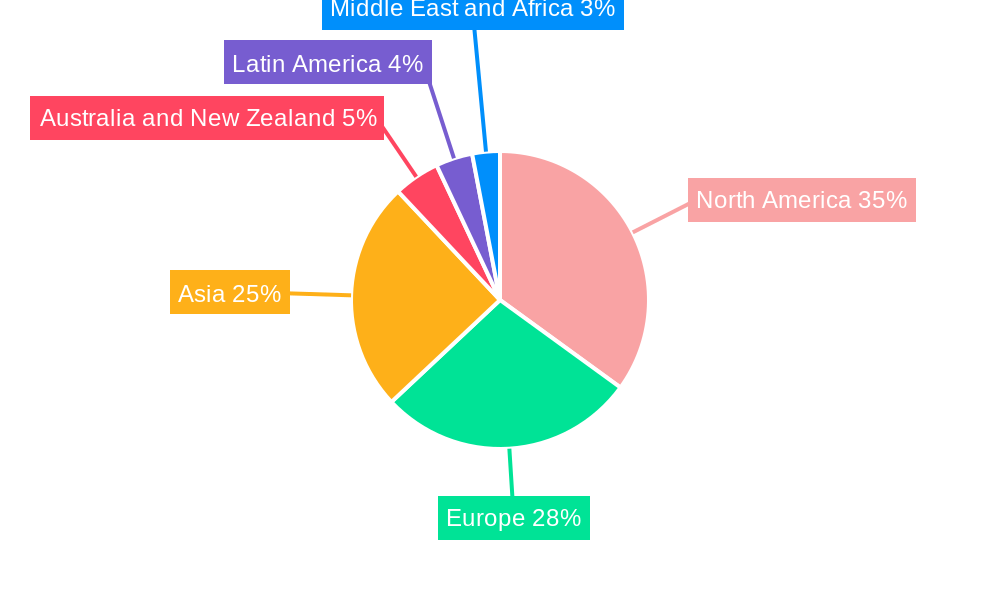
The market's segmentation offers significant opportunities for specialized providers. The hardware segment is expected to maintain a substantial share, driven by continuous innovation in projector technology. However, the software segment is poised for rapid growth due to the rising need for user-friendly and powerful content creation tools. The 3D and 4D segments will likely witness faster growth compared to 2D due to the enhanced immersive experience they offer. Geographically, North America and Europe currently hold significant market shares, but the Asia-Pacific region is projected to witness the highest growth rate over the forecast period due to increasing investments in infrastructure and entertainment. Challenges remain, however, including the high initial investment costs associated with implementing projection mapping systems, which can act as a barrier to entry for smaller businesses. Moreover, the market is subject to technological advancements and competition, requiring continuous innovation to maintain a competitive edge.
Projection Mapping Industry: A Comprehensive Market Report (2019-2033)
This detailed report provides a comprehensive analysis of the Projection Mapping industry, offering invaluable insights for stakeholders, investors, and industry professionals. Covering the period from 2019 to 2033, with a base year of 2025, this report projects a robust growth trajectory, analyzing market dynamics, technological advancements, and key players shaping the future of projection mapping. The global market size is estimated at xx Million in 2025 and is projected to reach xx Million by 2033, showcasing significant growth potential.
Projection Mapping Industry Market Concentration & Innovation
The projection mapping market exhibits a moderately concentrated landscape, with key players holding significant market share. However, the presence of numerous smaller, specialized firms fosters innovation and competition. Market share data for 2024 indicates that Seiko Epson Corporation holds approximately 15% of the market, followed by Barco NV with 12%, and BenQ Corporation with 10%. The remaining market share is distributed amongst other players including Digital Essence SAS, ViewSonic Corporation, Pixel Rain Digita, Vivitek (Delta Electronics), Digital Projection, Green Hippo Ltd, NEC Display Solutions (SHARP corporation), and Panasonic Corporation.
Innovation is a primary driver, fueled by advancements in display technologies (e.g., laser, LED, and 4K projection), software capabilities (enhanced mapping software, improved content creation tools), and the increasing demand for immersive experiences. Regulatory frameworks concerning data privacy and content usage are evolving and impacting industry practices. While direct substitutes are limited, competing technologies such as augmented and virtual reality present alternative solutions for certain applications. End-user trends reveal a growing preference for high-resolution, high-brightness projections and seamless integration with other technologies.
Mergers and acquisitions (M&A) activities have played a significant role in shaping the market landscape. Over the period 2019-2024, approximately xx Million in M&A deals have been recorded, primarily focused on consolidating market share and acquiring specialized technologies. These activities are expected to continue in the forecast period, driven by the pursuit of innovation and expansion into new markets.
Projection Mapping Industry Industry Trends & Insights
The projection mapping industry is experiencing robust growth, driven by several factors. The Compound Annual Growth Rate (CAGR) for the period 2025-2033 is projected to be xx%, fueled by rising demand across diverse applications. Technological advancements, such as the development of higher-resolution, brighter, and more energy-efficient projectors, are contributing to this growth. The increasing adoption of projection mapping in entertainment, events, and large venues is a major driver. Moreover, the increasing affordability of projection mapping systems and the rise of user-friendly software solutions are expanding market penetration.
However, the market faces challenges such as the high initial investment costs associated with setting up projection mapping systems. Competitive dynamics are intense, with established players and new entrants vying for market share. Consumer preferences are shifting towards more immersive and interactive projection mapping experiences, demanding continuous innovation from industry players.
Dominant Markets & Segments in Projection Mapping Industry
Leading Region/Country: North America currently holds the largest market share, driven by strong demand from the entertainment and advertising sectors. Asia-Pacific is emerging as a rapidly growing market due to increasing investments in infrastructure and events.
By Offering:
- Hardware: This segment dominates the market, accounting for approximately 70% of the total revenue. The high demand for advanced projection systems is driving this growth.
- Software: The software segment exhibits significant growth potential, with increased demand for user-friendly and feature-rich mapping software.
By Dimension:
- 2D: This remains the most prevalent dimension, largely due to its affordability and widespread application.
- 3D: The 3D segment is experiencing rapid growth, driven by the increasing demand for immersive experiences.
- 4D: This segment is still niche but is gaining traction, mainly in high-end entertainment and theme parks.
By Throw Distance:
- Standard: This segment is the largest and the most common throw distance due to versatile application.
- Short: The short throw distance segment is gaining traction, particularly in smaller venues and installations where space is limited.
By Application:
- Large Venue: This segment accounts for a significant portion of the market due to the use of projection mapping in concerts, sporting events, and other large-scale events.
- Event & Festival: This segment showcases significant growth owing to the increasing use of projection mapping to enhance the visual appeal of events.
- Entertainment: The entertainment industry is a major adopter of projection mapping technology for theatrical productions, theme parks, and similar experiences.
- Other Applications: This segment includes applications such as architectural projection mapping, museums, and retail displays, showing moderate growth.
Key drivers for the dominant segments include favorable economic policies promoting investment in the entertainment and events sectors, and robust infrastructure to support large-scale installations.
Projection Mapping Industry Product Developments
Recent product innovations focus on enhancing resolution, brightness, portability, and ease of use. Laser and LED technologies are gaining popularity due to their superior brightness and energy efficiency. Software developments are concentrating on intuitive interfaces, simplified content creation tools, and improved warping and blending capabilities. These advancements cater to the market demand for sophisticated yet user-friendly solutions, enabling wider adoption across various applications.
Report Scope & Segmentation Analysis
This report segments the projection mapping market by offering (hardware and software), dimension (2D, 3D, 4D), throw distance (standard and short), and application (large venue, event, festival, entertainment, and other applications). Each segment is analyzed in terms of market size, growth projections, and competitive dynamics. For instance, the hardware segment is projected to grow at a CAGR of xx% during the forecast period, driven by the increasing demand for high-resolution and high-brightness projectors. The software segment is anticipated to demonstrate a higher CAGR of xx%, propelled by the ongoing need for advanced mapping and content creation tools.
Key Drivers of Projection Mapping Industry Growth
The projection mapping industry's growth is fueled by technological advancements (higher resolution, brighter projectors, and user-friendly software), increasing demand for immersive experiences across various sectors (entertainment, advertising, and education), and favorable economic conditions supporting investment in entertainment and events. Government initiatives promoting technological innovation and cultural events further stimulate market expansion. For instance, Epson’s launch of its 4K ultra-lightweight 3LCD projector range highlights the continuous drive towards advanced projection technology, increasing the potential for adoption.
Challenges in the Projection Mapping Industry Sector
The projection mapping industry faces challenges such as high initial investment costs, which can limit adoption by smaller businesses and individuals. Supply chain disruptions and the increasing cost of raw materials also impact profitability. Intense competition, particularly from established players with extensive resources, further constrains market dynamics. These factors, coupled with the evolving regulatory landscape, can affect market growth if not effectively addressed.
Emerging Opportunities in Projection Mapping Industry
Emerging opportunities lie in the expanding applications of projection mapping technology in new sectors, such as interactive retail displays, educational environments, and architectural design. The integration of projection mapping with other technologies, like augmented and virtual reality (AR/VR), presents further growth potential. Furthermore, the increasing demand for personalized and interactive experiences creates new avenues for innovative product development and market expansion.
Leading Players in the Projection Mapping Industry Market
- Digital Essence SAS
- ViewSonic Corporation
- Pixel Rain Digita
- BenQ Corporation (Qisda Corporation)
- Barco NV
- Vivitek (Delta Electronics)
- Digital Projection
- Seiko Epson Corporation
- Green Hippo Ltd
- NEC Display Solutions (SHARP corporation)
- Panasonic Corporation
Key Developments in Projection Mapping Industry Industry
- January 2024: Epson's launch of its latest 4K ultra-lightweight 3LCD projector range, unveiled at ISE 2023, has significantly boosted its market position in the high-lumens projector segment.
- January 2024: BenQ's "Teach Your Way" Projector Program aims to expand the use of projection mapping technology in educational settings, fostering market growth in the education sector.
Strategic Outlook for Projection Mapping Industry Market
The projection mapping industry is poised for significant growth, driven by technological innovations, the growing demand for immersive experiences, and expansion into new applications. Future market potential lies in exploring new market segments, leveraging advancements in AR/VR technologies, and developing more user-friendly and affordable solutions. The industry's strategic outlook is positive, indicating substantial growth opportunities for businesses that can adapt to evolving consumer preferences and technological advancements.
Projection Mapping Industry Segmentation
-
1. Offering
- 1.1. Hardware
- 1.2. Software
-
2. Dimension
- 2.1. 2 Dimension
- 2.2. 3 Dimension
- 2.3. 4 Dimension
-
3. Throw Distance
- 3.1. Standard
- 3.2. Short
-
4. Application
- 4.1. Large Venue
- 4.2. Event
- 4.3. Festival
- 4.4. Entertainment
- 4.5. Other Applications
Projection Mapping Industry Segmentation By Geography
-
1. North America
- 1.1. United States
- 1.2. Canada
-
2. Europe
- 2.1. Germany
- 2.2. United Kingdom
- 2.3. France
-
3. Asia
- 3.1. India
- 3.2. China
- 3.3. Japan
- 4. Australia and New Zealand
-
5. Latin America
- 5.1. Brazil
- 5.2. Argentina
-
6. Middle East and Africa
- 6.1. United Arab Emirates
- 6.2. Saudi Arabia
Projection Mapping Industry REPORT HIGHLIGHTS
| Aspects | Details |
|---|---|
| Study Period | 2019-2033 |
| Base Year | 2024 |
| Estimated Year | 2025 |
| Forecast Period | 2025-2033 |
| Historical Period | 2019-2024 |
| Growth Rate | CAGR of 21.87% from 2019-2033 |
| Segmentation |
|
Table of Contents
- 1. Introduction
- 1.1. Research Scope
- 1.2. Market Segmentation
- 1.3. Research Methodology
- 1.4. Definitions and Assumptions
- 2. Executive Summary
- 2.1. Introduction
- 3. Market Dynamics
- 3.1. Introduction
- 3.2. Market Drivers
- 3.2.1 Increasing Demand for Projection Size
- 3.2.2 and High Brightness of the Projectors; Rapid Growth of Smart Cities
- 3.3. Market Restrains
- 3.3.1. Shorter Operating Range of WiGig Products
- 3.4. Market Trends
- 3.4.1. Event Segment to Witness Major Growth
- 4. Market Factor Analysis
- 4.1. Porters Five Forces
- 4.2. Supply/Value Chain
- 4.3. PESTEL analysis
- 4.4. Market Entropy
- 4.5. Patent/Trademark Analysis
- 5. Global Projection Mapping Industry Analysis, Insights and Forecast, 2019-2031
- 5.1. Market Analysis, Insights and Forecast - by Offering
- 5.1.1. Hardware
- 5.1.2. Software
- 5.2. Market Analysis, Insights and Forecast - by Dimension
- 5.2.1. 2 Dimension
- 5.2.2. 3 Dimension
- 5.2.3. 4 Dimension
- 5.3. Market Analysis, Insights and Forecast - by Throw Distance
- 5.3.1. Standard
- 5.3.2. Short
- 5.4. Market Analysis, Insights and Forecast - by Application
- 5.4.1. Large Venue
- 5.4.2. Event
- 5.4.3. Festival
- 5.4.4. Entertainment
- 5.4.5. Other Applications
- 5.5. Market Analysis, Insights and Forecast - by Region
- 5.5.1. North America
- 5.5.2. Europe
- 5.5.3. Asia
- 5.5.4. Australia and New Zealand
- 5.5.5. Latin America
- 5.5.6. Middle East and Africa
- 5.1. Market Analysis, Insights and Forecast - by Offering
- 6. North America Projection Mapping Industry Analysis, Insights and Forecast, 2019-2031
- 6.1. Market Analysis, Insights and Forecast - by Offering
- 6.1.1. Hardware
- 6.1.2. Software
- 6.2. Market Analysis, Insights and Forecast - by Dimension
- 6.2.1. 2 Dimension
- 6.2.2. 3 Dimension
- 6.2.3. 4 Dimension
- 6.3. Market Analysis, Insights and Forecast - by Throw Distance
- 6.3.1. Standard
- 6.3.2. Short
- 6.4. Market Analysis, Insights and Forecast - by Application
- 6.4.1. Large Venue
- 6.4.2. Event
- 6.4.3. Festival
- 6.4.4. Entertainment
- 6.4.5. Other Applications
- 6.1. Market Analysis, Insights and Forecast - by Offering
- 7. Europe Projection Mapping Industry Analysis, Insights and Forecast, 2019-2031
- 7.1. Market Analysis, Insights and Forecast - by Offering
- 7.1.1. Hardware
- 7.1.2. Software
- 7.2. Market Analysis, Insights and Forecast - by Dimension
- 7.2.1. 2 Dimension
- 7.2.2. 3 Dimension
- 7.2.3. 4 Dimension
- 7.3. Market Analysis, Insights and Forecast - by Throw Distance
- 7.3.1. Standard
- 7.3.2. Short
- 7.4. Market Analysis, Insights and Forecast - by Application
- 7.4.1. Large Venue
- 7.4.2. Event
- 7.4.3. Festival
- 7.4.4. Entertainment
- 7.4.5. Other Applications
- 7.1. Market Analysis, Insights and Forecast - by Offering
- 8. Asia Projection Mapping Industry Analysis, Insights and Forecast, 2019-2031
- 8.1. Market Analysis, Insights and Forecast - by Offering
- 8.1.1. Hardware
- 8.1.2. Software
- 8.2. Market Analysis, Insights and Forecast - by Dimension
- 8.2.1. 2 Dimension
- 8.2.2. 3 Dimension
- 8.2.3. 4 Dimension
- 8.3. Market Analysis, Insights and Forecast - by Throw Distance
- 8.3.1. Standard
- 8.3.2. Short
- 8.4. Market Analysis, Insights and Forecast - by Application
- 8.4.1. Large Venue
- 8.4.2. Event
- 8.4.3. Festival
- 8.4.4. Entertainment
- 8.4.5. Other Applications
- 8.1. Market Analysis, Insights and Forecast - by Offering
- 9. Australia and New Zealand Projection Mapping Industry Analysis, Insights and Forecast, 2019-2031
- 9.1. Market Analysis, Insights and Forecast - by Offering
- 9.1.1. Hardware
- 9.1.2. Software
- 9.2. Market Analysis, Insights and Forecast - by Dimension
- 9.2.1. 2 Dimension
- 9.2.2. 3 Dimension
- 9.2.3. 4 Dimension
- 9.3. Market Analysis, Insights and Forecast - by Throw Distance
- 9.3.1. Standard
- 9.3.2. Short
- 9.4. Market Analysis, Insights and Forecast - by Application
- 9.4.1. Large Venue
- 9.4.2. Event
- 9.4.3. Festival
- 9.4.4. Entertainment
- 9.4.5. Other Applications
- 9.1. Market Analysis, Insights and Forecast - by Offering
- 10. Latin America Projection Mapping Industry Analysis, Insights and Forecast, 2019-2031
- 10.1. Market Analysis, Insights and Forecast - by Offering
- 10.1.1. Hardware
- 10.1.2. Software
- 10.2. Market Analysis, Insights and Forecast - by Dimension
- 10.2.1. 2 Dimension
- 10.2.2. 3 Dimension
- 10.2.3. 4 Dimension
- 10.3. Market Analysis, Insights and Forecast - by Throw Distance
- 10.3.1. Standard
- 10.3.2. Short
- 10.4. Market Analysis, Insights and Forecast - by Application
- 10.4.1. Large Venue
- 10.4.2. Event
- 10.4.3. Festival
- 10.4.4. Entertainment
- 10.4.5. Other Applications
- 10.1. Market Analysis, Insights and Forecast - by Offering
- 11. Middle East and Africa Projection Mapping Industry Analysis, Insights and Forecast, 2019-2031
- 11.1. Market Analysis, Insights and Forecast - by Offering
- 11.1.1. Hardware
- 11.1.2. Software
- 11.2. Market Analysis, Insights and Forecast - by Dimension
- 11.2.1. 2 Dimension
- 11.2.2. 3 Dimension
- 11.2.3. 4 Dimension
- 11.3. Market Analysis, Insights and Forecast - by Throw Distance
- 11.3.1. Standard
- 11.3.2. Short
- 11.4. Market Analysis, Insights and Forecast - by Application
- 11.4.1. Large Venue
- 11.4.2. Event
- 11.4.3. Festival
- 11.4.4. Entertainment
- 11.4.5. Other Applications
- 11.1. Market Analysis, Insights and Forecast - by Offering
- 12. North America Projection Mapping Industry Analysis, Insights and Forecast, 2019-2031
- 12.1. Market Analysis, Insights and Forecast - By Country/Sub-region
- 12.1.1 United States
- 12.1.2 Canada
- 13. Europe Projection Mapping Industry Analysis, Insights and Forecast, 2019-2031
- 13.1. Market Analysis, Insights and Forecast - By Country/Sub-region
- 13.1.1 Germany
- 13.1.2 United Kingdom
- 13.1.3 France
- 14. Asia Projection Mapping Industry Analysis, Insights and Forecast, 2019-2031
- 14.1. Market Analysis, Insights and Forecast - By Country/Sub-region
- 14.1.1 India
- 14.1.2 China
- 14.1.3 Japan
- 15. Australia and New Zealand Projection Mapping Industry Analysis, Insights and Forecast, 2019-2031
- 15.1. Market Analysis, Insights and Forecast - By Country/Sub-region
- 15.1.1.
- 16. Latin America Projection Mapping Industry Analysis, Insights and Forecast, 2019-2031
- 16.1. Market Analysis, Insights and Forecast - By Country/Sub-region
- 16.1.1 Brazil
- 16.1.2 Argentina
- 17. Middle East and Africa Projection Mapping Industry Analysis, Insights and Forecast, 2019-2031
- 17.1. Market Analysis, Insights and Forecast - By Country/Sub-region
- 17.1.1 United Arab Emirates
- 17.1.2 Saudi Arabia
- 18. Competitive Analysis
- 18.1. Global Market Share Analysis 2024
- 18.2. Company Profiles
- 18.2.1 Digital Essence SAS
- 18.2.1.1. Overview
- 18.2.1.2. Products
- 18.2.1.3. SWOT Analysis
- 18.2.1.4. Recent Developments
- 18.2.1.5. Financials (Based on Availability)
- 18.2.2 ViewSonic Corporation
- 18.2.2.1. Overview
- 18.2.2.2. Products
- 18.2.2.3. SWOT Analysis
- 18.2.2.4. Recent Developments
- 18.2.2.5. Financials (Based on Availability)
- 18.2.3 Pixel Rain Digita
- 18.2.3.1. Overview
- 18.2.3.2. Products
- 18.2.3.3. SWOT Analysis
- 18.2.3.4. Recent Developments
- 18.2.3.5. Financials (Based on Availability)
- 18.2.4 BenQ Corporation (Qisda Corporation)
- 18.2.4.1. Overview
- 18.2.4.2. Products
- 18.2.4.3. SWOT Analysis
- 18.2.4.4. Recent Developments
- 18.2.4.5. Financials (Based on Availability)
- 18.2.5 Barco NV
- 18.2.5.1. Overview
- 18.2.5.2. Products
- 18.2.5.3. SWOT Analysis
- 18.2.5.4. Recent Developments
- 18.2.5.5. Financials (Based on Availability)
- 18.2.6 Vivitek (Delta Electronics)
- 18.2.6.1. Overview
- 18.2.6.2. Products
- 18.2.6.3. SWOT Analysis
- 18.2.6.4. Recent Developments
- 18.2.6.5. Financials (Based on Availability)
- 18.2.7 Digital Projection
- 18.2.7.1. Overview
- 18.2.7.2. Products
- 18.2.7.3. SWOT Analysis
- 18.2.7.4. Recent Developments
- 18.2.7.5. Financials (Based on Availability)
- 18.2.8 Seiko Epson Corporation
- 18.2.8.1. Overview
- 18.2.8.2. Products
- 18.2.8.3. SWOT Analysis
- 18.2.8.4. Recent Developments
- 18.2.8.5. Financials (Based on Availability)
- 18.2.9 Green Hippo Ltd
- 18.2.9.1. Overview
- 18.2.9.2. Products
- 18.2.9.3. SWOT Analysis
- 18.2.9.4. Recent Developments
- 18.2.9.5. Financials (Based on Availability)
- 18.2.10 NEC Display Solutions (SHARP corporation)
- 18.2.10.1. Overview
- 18.2.10.2. Products
- 18.2.10.3. SWOT Analysis
- 18.2.10.4. Recent Developments
- 18.2.10.5. Financials (Based on Availability)
- 18.2.11 Panasonic Corporation
- 18.2.11.1. Overview
- 18.2.11.2. Products
- 18.2.11.3. SWOT Analysis
- 18.2.11.4. Recent Developments
- 18.2.11.5. Financials (Based on Availability)
- 18.2.1 Digital Essence SAS
List of Figures
- Figure 1: Global Projection Mapping Industry Revenue Breakdown (Million, %) by Region 2024 & 2032
- Figure 2: North America Projection Mapping Industry Revenue (Million), by Country 2024 & 2032
- Figure 3: North America Projection Mapping Industry Revenue Share (%), by Country 2024 & 2032
- Figure 4: Europe Projection Mapping Industry Revenue (Million), by Country 2024 & 2032
- Figure 5: Europe Projection Mapping Industry Revenue Share (%), by Country 2024 & 2032
- Figure 6: Asia Projection Mapping Industry Revenue (Million), by Country 2024 & 2032
- Figure 7: Asia Projection Mapping Industry Revenue Share (%), by Country 2024 & 2032
- Figure 8: Australia and New Zealand Projection Mapping Industry Revenue (Million), by Country 2024 & 2032
- Figure 9: Australia and New Zealand Projection Mapping Industry Revenue Share (%), by Country 2024 & 2032
- Figure 10: Latin America Projection Mapping Industry Revenue (Million), by Country 2024 & 2032
- Figure 11: Latin America Projection Mapping Industry Revenue Share (%), by Country 2024 & 2032
- Figure 12: Middle East and Africa Projection Mapping Industry Revenue (Million), by Country 2024 & 2032
- Figure 13: Middle East and Africa Projection Mapping Industry Revenue Share (%), by Country 2024 & 2032
- Figure 14: North America Projection Mapping Industry Revenue (Million), by Offering 2024 & 2032
- Figure 15: North America Projection Mapping Industry Revenue Share (%), by Offering 2024 & 2032
- Figure 16: North America Projection Mapping Industry Revenue (Million), by Dimension 2024 & 2032
- Figure 17: North America Projection Mapping Industry Revenue Share (%), by Dimension 2024 & 2032
- Figure 18: North America Projection Mapping Industry Revenue (Million), by Throw Distance 2024 & 2032
- Figure 19: North America Projection Mapping Industry Revenue Share (%), by Throw Distance 2024 & 2032
- Figure 20: North America Projection Mapping Industry Revenue (Million), by Application 2024 & 2032
- Figure 21: North America Projection Mapping Industry Revenue Share (%), by Application 2024 & 2032
- Figure 22: North America Projection Mapping Industry Revenue (Million), by Country 2024 & 2032
- Figure 23: North America Projection Mapping Industry Revenue Share (%), by Country 2024 & 2032
- Figure 24: Europe Projection Mapping Industry Revenue (Million), by Offering 2024 & 2032
- Figure 25: Europe Projection Mapping Industry Revenue Share (%), by Offering 2024 & 2032
- Figure 26: Europe Projection Mapping Industry Revenue (Million), by Dimension 2024 & 2032
- Figure 27: Europe Projection Mapping Industry Revenue Share (%), by Dimension 2024 & 2032
- Figure 28: Europe Projection Mapping Industry Revenue (Million), by Throw Distance 2024 & 2032
- Figure 29: Europe Projection Mapping Industry Revenue Share (%), by Throw Distance 2024 & 2032
- Figure 30: Europe Projection Mapping Industry Revenue (Million), by Application 2024 & 2032
- Figure 31: Europe Projection Mapping Industry Revenue Share (%), by Application 2024 & 2032
- Figure 32: Europe Projection Mapping Industry Revenue (Million), by Country 2024 & 2032
- Figure 33: Europe Projection Mapping Industry Revenue Share (%), by Country 2024 & 2032
- Figure 34: Asia Projection Mapping Industry Revenue (Million), by Offering 2024 & 2032
- Figure 35: Asia Projection Mapping Industry Revenue Share (%), by Offering 2024 & 2032
- Figure 36: Asia Projection Mapping Industry Revenue (Million), by Dimension 2024 & 2032
- Figure 37: Asia Projection Mapping Industry Revenue Share (%), by Dimension 2024 & 2032
- Figure 38: Asia Projection Mapping Industry Revenue (Million), by Throw Distance 2024 & 2032
- Figure 39: Asia Projection Mapping Industry Revenue Share (%), by Throw Distance 2024 & 2032
- Figure 40: Asia Projection Mapping Industry Revenue (Million), by Application 2024 & 2032
- Figure 41: Asia Projection Mapping Industry Revenue Share (%), by Application 2024 & 2032
- Figure 42: Asia Projection Mapping Industry Revenue (Million), by Country 2024 & 2032
- Figure 43: Asia Projection Mapping Industry Revenue Share (%), by Country 2024 & 2032
- Figure 44: Australia and New Zealand Projection Mapping Industry Revenue (Million), by Offering 2024 & 2032
- Figure 45: Australia and New Zealand Projection Mapping Industry Revenue Share (%), by Offering 2024 & 2032
- Figure 46: Australia and New Zealand Projection Mapping Industry Revenue (Million), by Dimension 2024 & 2032
- Figure 47: Australia and New Zealand Projection Mapping Industry Revenue Share (%), by Dimension 2024 & 2032
- Figure 48: Australia and New Zealand Projection Mapping Industry Revenue (Million), by Throw Distance 2024 & 2032
- Figure 49: Australia and New Zealand Projection Mapping Industry Revenue Share (%), by Throw Distance 2024 & 2032
- Figure 50: Australia and New Zealand Projection Mapping Industry Revenue (Million), by Application 2024 & 2032
- Figure 51: Australia and New Zealand Projection Mapping Industry Revenue Share (%), by Application 2024 & 2032
- Figure 52: Australia and New Zealand Projection Mapping Industry Revenue (Million), by Country 2024 & 2032
- Figure 53: Australia and New Zealand Projection Mapping Industry Revenue Share (%), by Country 2024 & 2032
- Figure 54: Latin America Projection Mapping Industry Revenue (Million), by Offering 2024 & 2032
- Figure 55: Latin America Projection Mapping Industry Revenue Share (%), by Offering 2024 & 2032
- Figure 56: Latin America Projection Mapping Industry Revenue (Million), by Dimension 2024 & 2032
- Figure 57: Latin America Projection Mapping Industry Revenue Share (%), by Dimension 2024 & 2032
- Figure 58: Latin America Projection Mapping Industry Revenue (Million), by Throw Distance 2024 & 2032
- Figure 59: Latin America Projection Mapping Industry Revenue Share (%), by Throw Distance 2024 & 2032
- Figure 60: Latin America Projection Mapping Industry Revenue (Million), by Application 2024 & 2032
- Figure 61: Latin America Projection Mapping Industry Revenue Share (%), by Application 2024 & 2032
- Figure 62: Latin America Projection Mapping Industry Revenue (Million), by Country 2024 & 2032
- Figure 63: Latin America Projection Mapping Industry Revenue Share (%), by Country 2024 & 2032
- Figure 64: Middle East and Africa Projection Mapping Industry Revenue (Million), by Offering 2024 & 2032
- Figure 65: Middle East and Africa Projection Mapping Industry Revenue Share (%), by Offering 2024 & 2032
- Figure 66: Middle East and Africa Projection Mapping Industry Revenue (Million), by Dimension 2024 & 2032
- Figure 67: Middle East and Africa Projection Mapping Industry Revenue Share (%), by Dimension 2024 & 2032
- Figure 68: Middle East and Africa Projection Mapping Industry Revenue (Million), by Throw Distance 2024 & 2032
- Figure 69: Middle East and Africa Projection Mapping Industry Revenue Share (%), by Throw Distance 2024 & 2032
- Figure 70: Middle East and Africa Projection Mapping Industry Revenue (Million), by Application 2024 & 2032
- Figure 71: Middle East and Africa Projection Mapping Industry Revenue Share (%), by Application 2024 & 2032
- Figure 72: Middle East and Africa Projection Mapping Industry Revenue (Million), by Country 2024 & 2032
- Figure 73: Middle East and Africa Projection Mapping Industry Revenue Share (%), by Country 2024 & 2032
List of Tables
- Table 1: Global Projection Mapping Industry Revenue Million Forecast, by Region 2019 & 2032
- Table 2: Global Projection Mapping Industry Revenue Million Forecast, by Offering 2019 & 2032
- Table 3: Global Projection Mapping Industry Revenue Million Forecast, by Dimension 2019 & 2032
- Table 4: Global Projection Mapping Industry Revenue Million Forecast, by Throw Distance 2019 & 2032
- Table 5: Global Projection Mapping Industry Revenue Million Forecast, by Application 2019 & 2032
- Table 6: Global Projection Mapping Industry Revenue Million Forecast, by Region 2019 & 2032
- Table 7: Global Projection Mapping Industry Revenue Million Forecast, by Country 2019 & 2032
- Table 8: United States Projection Mapping Industry Revenue (Million) Forecast, by Application 2019 & 2032
- Table 9: Canada Projection Mapping Industry Revenue (Million) Forecast, by Application 2019 & 2032
- Table 10: Global Projection Mapping Industry Revenue Million Forecast, by Country 2019 & 2032
- Table 11: Germany Projection Mapping Industry Revenue (Million) Forecast, by Application 2019 & 2032
- Table 12: United Kingdom Projection Mapping Industry Revenue (Million) Forecast, by Application 2019 & 2032
- Table 13: France Projection Mapping Industry Revenue (Million) Forecast, by Application 2019 & 2032
- Table 14: Global Projection Mapping Industry Revenue Million Forecast, by Country 2019 & 2032
- Table 15: India Projection Mapping Industry Revenue (Million) Forecast, by Application 2019 & 2032
- Table 16: China Projection Mapping Industry Revenue (Million) Forecast, by Application 2019 & 2032
- Table 17: Japan Projection Mapping Industry Revenue (Million) Forecast, by Application 2019 & 2032
- Table 18: Global Projection Mapping Industry Revenue Million Forecast, by Country 2019 & 2032
- Table 19: Projection Mapping Industry Revenue (Million) Forecast, by Application 2019 & 2032
- Table 20: Global Projection Mapping Industry Revenue Million Forecast, by Country 2019 & 2032
- Table 21: Brazil Projection Mapping Industry Revenue (Million) Forecast, by Application 2019 & 2032
- Table 22: Argentina Projection Mapping Industry Revenue (Million) Forecast, by Application 2019 & 2032
- Table 23: Global Projection Mapping Industry Revenue Million Forecast, by Country 2019 & 2032
- Table 24: United Arab Emirates Projection Mapping Industry Revenue (Million) Forecast, by Application 2019 & 2032
- Table 25: Saudi Arabia Projection Mapping Industry Revenue (Million) Forecast, by Application 2019 & 2032
- Table 26: Global Projection Mapping Industry Revenue Million Forecast, by Offering 2019 & 2032
- Table 27: Global Projection Mapping Industry Revenue Million Forecast, by Dimension 2019 & 2032
- Table 28: Global Projection Mapping Industry Revenue Million Forecast, by Throw Distance 2019 & 2032
- Table 29: Global Projection Mapping Industry Revenue Million Forecast, by Application 2019 & 2032
- Table 30: Global Projection Mapping Industry Revenue Million Forecast, by Country 2019 & 2032
- Table 31: United States Projection Mapping Industry Revenue (Million) Forecast, by Application 2019 & 2032
- Table 32: Canada Projection Mapping Industry Revenue (Million) Forecast, by Application 2019 & 2032
- Table 33: Global Projection Mapping Industry Revenue Million Forecast, by Offering 2019 & 2032
- Table 34: Global Projection Mapping Industry Revenue Million Forecast, by Dimension 2019 & 2032
- Table 35: Global Projection Mapping Industry Revenue Million Forecast, by Throw Distance 2019 & 2032
- Table 36: Global Projection Mapping Industry Revenue Million Forecast, by Application 2019 & 2032
- Table 37: Global Projection Mapping Industry Revenue Million Forecast, by Country 2019 & 2032
- Table 38: Germany Projection Mapping Industry Revenue (Million) Forecast, by Application 2019 & 2032
- Table 39: United Kingdom Projection Mapping Industry Revenue (Million) Forecast, by Application 2019 & 2032
- Table 40: France Projection Mapping Industry Revenue (Million) Forecast, by Application 2019 & 2032
- Table 41: Global Projection Mapping Industry Revenue Million Forecast, by Offering 2019 & 2032
- Table 42: Global Projection Mapping Industry Revenue Million Forecast, by Dimension 2019 & 2032
- Table 43: Global Projection Mapping Industry Revenue Million Forecast, by Throw Distance 2019 & 2032
- Table 44: Global Projection Mapping Industry Revenue Million Forecast, by Application 2019 & 2032
- Table 45: Global Projection Mapping Industry Revenue Million Forecast, by Country 2019 & 2032
- Table 46: India Projection Mapping Industry Revenue (Million) Forecast, by Application 2019 & 2032
- Table 47: China Projection Mapping Industry Revenue (Million) Forecast, by Application 2019 & 2032
- Table 48: Japan Projection Mapping Industry Revenue (Million) Forecast, by Application 2019 & 2032
- Table 49: Global Projection Mapping Industry Revenue Million Forecast, by Offering 2019 & 2032
- Table 50: Global Projection Mapping Industry Revenue Million Forecast, by Dimension 2019 & 2032
- Table 51: Global Projection Mapping Industry Revenue Million Forecast, by Throw Distance 2019 & 2032
- Table 52: Global Projection Mapping Industry Revenue Million Forecast, by Application 2019 & 2032
- Table 53: Global Projection Mapping Industry Revenue Million Forecast, by Country 2019 & 2032
- Table 54: Global Projection Mapping Industry Revenue Million Forecast, by Offering 2019 & 2032
- Table 55: Global Projection Mapping Industry Revenue Million Forecast, by Dimension 2019 & 2032
- Table 56: Global Projection Mapping Industry Revenue Million Forecast, by Throw Distance 2019 & 2032
- Table 57: Global Projection Mapping Industry Revenue Million Forecast, by Application 2019 & 2032
- Table 58: Global Projection Mapping Industry Revenue Million Forecast, by Country 2019 & 2032
- Table 59: Brazil Projection Mapping Industry Revenue (Million) Forecast, by Application 2019 & 2032
- Table 60: Argentina Projection Mapping Industry Revenue (Million) Forecast, by Application 2019 & 2032
- Table 61: Global Projection Mapping Industry Revenue Million Forecast, by Offering 2019 & 2032
- Table 62: Global Projection Mapping Industry Revenue Million Forecast, by Dimension 2019 & 2032
- Table 63: Global Projection Mapping Industry Revenue Million Forecast, by Throw Distance 2019 & 2032
- Table 64: Global Projection Mapping Industry Revenue Million Forecast, by Application 2019 & 2032
- Table 65: Global Projection Mapping Industry Revenue Million Forecast, by Country 2019 & 2032
- Table 66: United Arab Emirates Projection Mapping Industry Revenue (Million) Forecast, by Application 2019 & 2032
- Table 67: Saudi Arabia Projection Mapping Industry Revenue (Million) Forecast, by Application 2019 & 2032
Frequently Asked Questions
1. What is the projected Compound Annual Growth Rate (CAGR) of the Projection Mapping Industry?
The projected CAGR is approximately 21.87%.
2. Which companies are prominent players in the Projection Mapping Industry?
Key companies in the market include Digital Essence SAS, ViewSonic Corporation, Pixel Rain Digita, BenQ Corporation (Qisda Corporation), Barco NV, Vivitek (Delta Electronics), Digital Projection, Seiko Epson Corporation, Green Hippo Ltd, NEC Display Solutions (SHARP corporation), Panasonic Corporation.
3. What are the main segments of the Projection Mapping Industry?
The market segments include Offering, Dimension, Throw Distance, Application.
4. Can you provide details about the market size?
The market size is estimated to be USD 4.58 Million as of 2022.
5. What are some drivers contributing to market growth?
Increasing Demand for Projection Size. and High Brightness of the Projectors; Rapid Growth of Smart Cities.
6. What are the notable trends driving market growth?
Event Segment to Witness Major Growth.
7. Are there any restraints impacting market growth?
Shorter Operating Range of WiGig Products.
8. Can you provide examples of recent developments in the market?
January 2024 - Epson's latest 4K ultra-lightweight 3LCD projector range, unveiled at ISE 2023, has garnered substantial orders from its rental partner, AED Display. This move solidifies Epson's position as the go-to manufacturer in the high-lumens projector segment.
9. What pricing options are available for accessing the report?
Pricing options include single-user, multi-user, and enterprise licenses priced at USD 4750, USD 5250, and USD 8750 respectively.
10. Is the market size provided in terms of value or volume?
The market size is provided in terms of value, measured in Million.
11. Are there any specific market keywords associated with the report?
Yes, the market keyword associated with the report is "Projection Mapping Industry," which aids in identifying and referencing the specific market segment covered.
12. How do I determine which pricing option suits my needs best?
The pricing options vary based on user requirements and access needs. Individual users may opt for single-user licenses, while businesses requiring broader access may choose multi-user or enterprise licenses for cost-effective access to the report.
13. Are there any additional resources or data provided in the Projection Mapping Industry report?
While the report offers comprehensive insights, it's advisable to review the specific contents or supplementary materials provided to ascertain if additional resources or data are available.
14. How can I stay updated on further developments or reports in the Projection Mapping Industry?
To stay informed about further developments, trends, and reports in the Projection Mapping Industry, consider subscribing to industry newsletters, following relevant companies and organizations, or regularly checking reputable industry news sources and publications.
Methodology
Step 1 - Identification of Relevant Samples Size from Population Database


Step 2 - Approaches for Defining Global Market Size (Value, Volume* & Price*)

Note*: In applicable scenarios
Step 3 - Data Sources
Primary Research
- Web Analytics
- Survey Reports
- Research Institute
- Latest Research Reports
- Opinion Leaders
Secondary Research
- Annual Reports
- White Paper
- Latest Press Release
- Industry Association
- Paid Database
- Investor Presentations

Step 4 - Data Triangulation
Involves using different sources of information in order to increase the validity of a study
These sources are likely to be stakeholders in a program - participants, other researchers, program staff, other community members, and so on.
Then we put all data in single framework & apply various statistical tools to find out the dynamic on the market.
During the analysis stage, feedback from the stakeholder groups would be compared to determine areas of agreement as well as areas of divergence


