
Key Insights
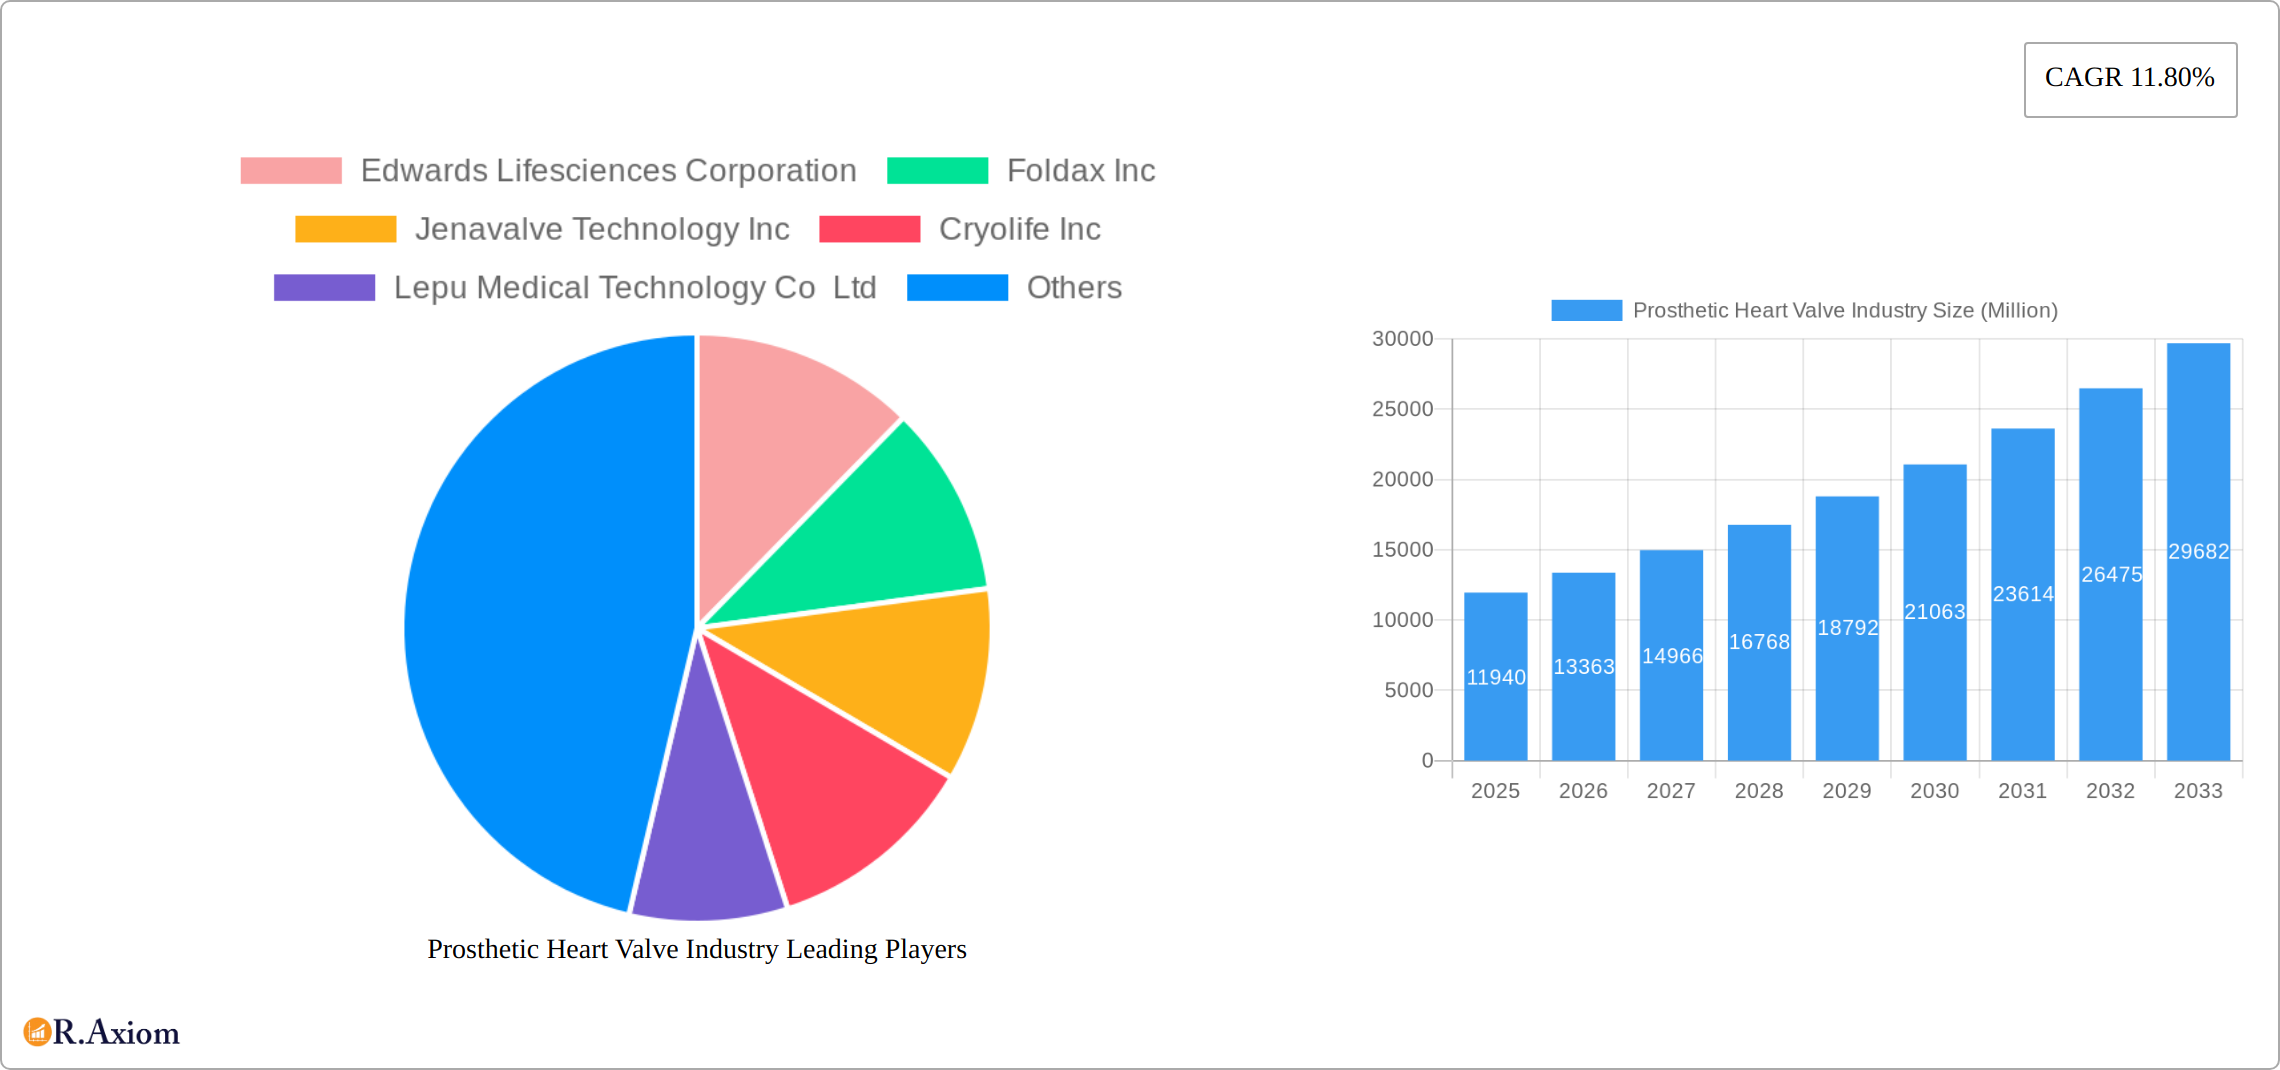
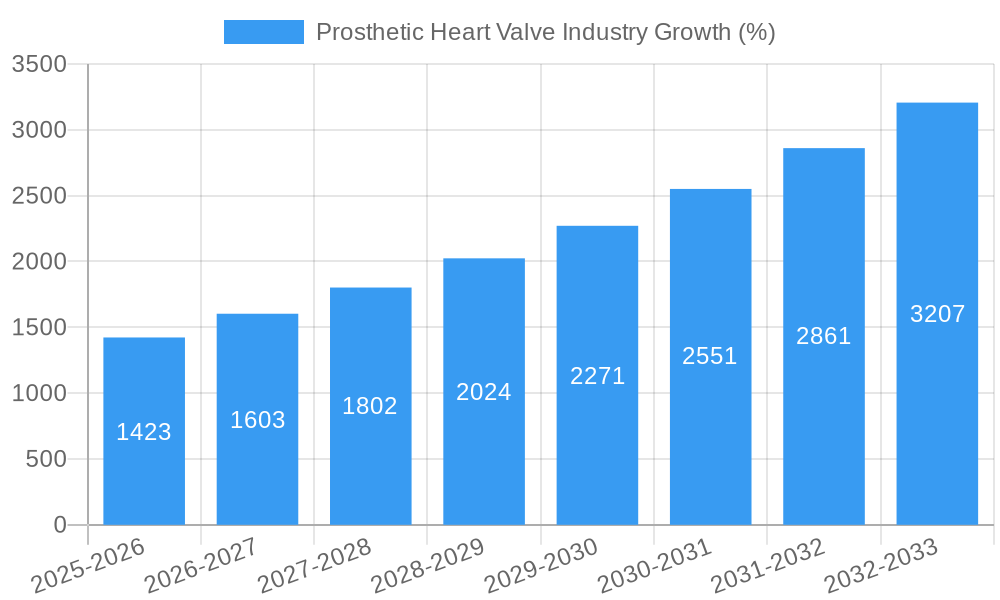
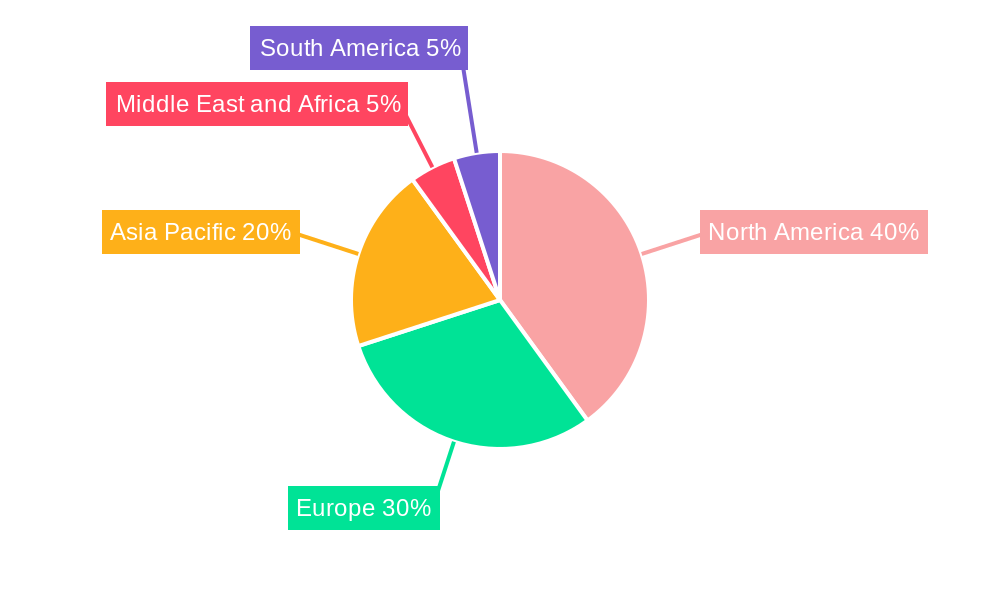
The global prosthetic heart valve market, valued at $11.94 billion in 2025, is projected to experience robust growth, driven by a rising geriatric population susceptible to cardiovascular diseases, advancements in minimally invasive surgical techniques (such as transcatheter aortic valve replacement – TAVR), and increasing awareness about the availability of effective treatment options. The market's Compound Annual Growth Rate (CAGR) of 11.80% from 2025 to 2033 indicates significant expansion potential. Key market segments include mechanical, bioprosthetic, and transcatheter heart valves, with the latter witnessing particularly rapid growth due to its less invasive nature and improved patient outcomes. The aortic and mitral valves represent the largest segments within the positional classification, reflecting the higher prevalence of associated diseases. Leading companies like Edwards Lifesciences, Medtronic, and Abbott Laboratories are driving innovation through research and development, expanding their product portfolios, and strategically acquiring smaller companies to strengthen their market positions. Regional variations exist, with North America currently holding a substantial market share due to high healthcare expenditure and technological advancements; however, Asia Pacific is poised for significant growth owing to expanding healthcare infrastructure and a burgeoning elderly population.
Continued growth in the prosthetic heart valve market is anticipated to be fueled by several factors. Technological advancements continue to improve valve durability, reduce complications, and broaden patient eligibility for less invasive procedures. Furthermore, increasing investment in research and development by major players will lead to the introduction of innovative valve designs and improved materials, potentially further expanding the market. While challenges exist, such as high treatment costs and potential complications associated with specific valve types, the overall positive outlook is underpinned by a growing need for effective heart valve replacement solutions and the continuous drive for improved medical technology. The market's segmentation by valve type and position allows for targeted strategies by manufacturers and provides a clear understanding of future trends and opportunities for growth within specific niches.
Prosthetic Heart Valve Industry: A Comprehensive Market Report (2019-2033)
This comprehensive report provides an in-depth analysis of the global prosthetic heart valve industry, covering market size, segmentation, key players, technological advancements, and future growth prospects. The study period spans from 2019 to 2033, with 2025 serving as both the base and estimated year. The report offers actionable insights for industry stakeholders, including manufacturers, investors, and healthcare professionals.
Prosthetic Heart Valve Industry Market Concentration & Innovation
The prosthetic heart valve industry exhibits moderate concentration, with several major players holding significant market share. Edwards Lifesciences Corporation, Medtronic PLC, and Abbott Laboratories (St. Jude Medical Inc.) are among the dominant players, collectively accounting for an estimated xx% of the global market in 2025. However, smaller companies like JenaValve Technology Inc. and Foldax Inc. are making inroads with innovative technologies.
Market Concentration Metrics (2025 Estimates):
- Top 3 Players Market Share: xx%
- Top 5 Players Market Share: xx%
- Average M&A Deal Value (2019-2024): $xx Million
Innovation is a crucial driver, fueled by the need for minimally invasive procedures, improved valve durability, and reduced complications. Stringent regulatory frameworks, such as those set by the FDA, influence product development and market entry. The industry witnesses ongoing M&A activity, with larger companies acquiring smaller innovative firms to expand their product portfolios and gain access to new technologies. Product substitutes, such as improved medical therapies, present a challenge, but the growing geriatric population and rising prevalence of cardiovascular diseases continue to drive demand for prosthetic heart valves. End-user trends favor less invasive procedures and improved patient outcomes, shaping product design and market strategies.
Prosthetic Heart Valve Industry Industry Trends & Insights
The global prosthetic heart valve market is experiencing robust growth, driven by several factors. The aging global population, increasing prevalence of cardiovascular diseases (like aortic stenosis and mitral regurgitation), and advancements in minimally invasive transcatheter aortic valve replacement (TAVR) procedures are major contributors to this expansion. The market is projected to witness a Compound Annual Growth Rate (CAGR) of xx% during the forecast period (2025-2033), reaching a market value of $xx Million by 2033. Technological disruptions, particularly in TAVR technology, are revolutionizing the industry, offering less invasive alternatives to traditional open-heart surgery. Consumer preferences increasingly favor minimally invasive procedures with shorter recovery times and fewer complications. This trend is fueling the growth of the transcatheter heart valve segment. Competitive dynamics are intense, with established players and emerging companies vying for market share through innovation, strategic partnerships, and acquisitions. Market penetration of TAVR procedures is steadily increasing, further driving market growth.
Dominant Markets & Segments in Prosthetic Heart Valve Industry
North America currently holds the largest market share in the prosthetic heart valve industry, driven by high healthcare expenditure, advanced medical infrastructure, and a large aging population. However, Asia-Pacific is exhibiting the fastest growth rate, fueled by rising healthcare awareness, increasing disposable incomes, and expanding medical tourism.
Key Drivers of Regional Dominance:
- North America: High healthcare spending, advanced infrastructure, technological advancements.
- Europe: Well-established healthcare systems, high prevalence of cardiovascular diseases.
- Asia-Pacific: Rapidly growing aging population, increasing healthcare awareness and spending.
Segment Dominance Analysis:
- Type of Valve: The transcatheter heart valve (THV) segment is experiencing the fastest growth due to its minimally invasive nature and improved patient outcomes. The bioprosthetic heart valve segment maintains a significant market share due to its long-term efficacy and reduced risk of blood clots.
- Position: The aortic valve segment holds the largest market share, followed by the mitral valve segment, reflecting the higher prevalence of aortic valve diseases.
Prosthetic Heart Valve Industry Product Developments
Recent product innovations focus on improving valve durability, reducing thrombosis risk, and enhancing patient outcomes. Transcatheter valves are gaining significant traction due to their minimally invasive nature. Companies are investing in biocompatible materials and advanced designs to minimize complications and improve long-term efficacy. This translates to improved market fit by meeting the growing demand for less invasive and more effective treatments.
Report Scope & Segmentation Analysis
This report provides a comprehensive analysis of the prosthetic heart valve market segmented by:
Type of Valve:
- Mechanical Heart Valve: This segment is characterized by its durability but carries a higher risk of thromboembolic complications. Market growth is expected to be moderate due to the availability of less invasive alternatives.
- Bioprosthetic Heart Valve: This segment benefits from improved biocompatibility and reduced risk of blood clots. Market growth will continue driven by its suitability for younger patients.
- Transcatheter Heart Valve (TAVR): This segment is experiencing rapid growth due to its minimally invasive nature. Technological advancements and increasing adoption will drive market expansion.
Position:
- Aortic Valve: This segment holds the largest market share due to the high prevalence of aortic valve diseases. Growth will be driven by technological advancements in TAVR procedures.
- Mitral Valve: This segment is growing steadily with the introduction of new transcatheter mitral valve therapies (TMVR).
- Other Positions: This segment includes valves for other cardiac positions and holds a relatively smaller market share.
Key Drivers of Prosthetic Heart Valve Industry Growth
The prosthetic heart valve industry's growth is propelled by several factors:
- Aging Population: The global aging population is leading to a surge in cardiovascular diseases.
- Technological Advancements: Minimally invasive procedures like TAVR are driving market expansion.
- Rising Healthcare Expenditure: Increased healthcare spending globally supports adoption of advanced treatments.
- Favorable Regulatory Environment: Approvals for new technologies and procedures facilitate market entry.
Challenges in the Prosthetic Heart Valve Industry Sector
The industry faces several challenges including:
- High Procedure Costs: The cost of prosthetic heart valve procedures can be prohibitive, limiting access in certain regions.
- Stringent Regulatory Approvals: Securing regulatory approvals for new devices can be time-consuming and costly.
- Potential for Complications: While advancements have improved outcomes, risks of complications remain a concern.
- Competition: Intense competition among established and emerging players necessitates continuous innovation.
Emerging Opportunities in Prosthetic Heart Valve Industry
Emerging opportunities include:
- Expansion into Emerging Markets: Untapped potential exists in developing economies with growing healthcare needs.
- Development of Innovative Materials: Research into biocompatible materials is improving valve longevity and performance.
- Personalized Medicine: Tailoring treatment plans based on patient-specific factors can optimize outcomes.
- Integration of AI and Machine Learning: AI can improve diagnostics, surgical planning, and post-operative care.
Leading Players in the Prosthetic Heart Valve Industry Market
- Edwards Lifesciences Corporation
- Foldax Inc
- Jenavalve Technology Inc
- Cryolife Inc
- Lepu Medical Technology Co Ltd
- Medtronic PLC
- Abbott Laboratories (St Jude Medical Inc)
- Symetis SA
- Colibri Heart Valve LLC
- Boston Scientific Corporation
- TTK Healthcare Limited
Key Developments in Prosthetic Heart Valve Industry Industry
- March 2022: Edwards Lifesciences received FDA approval for the MITRIS RESILIA valve, a tissue valve replacement for the mitral position. This expanded their product portfolio and strengthened their market position.
- January 2022: JenaValve Technology Inc. secured an exclusive technology licensing agreement with Peijia Medical Limited in China for its Trilogy TAVR systems, significantly expanding its market reach in a key region.
Strategic Outlook for Prosthetic Heart Valve Industry Market
The prosthetic heart valve market is poised for continued growth driven by technological advancements, an aging global population, and rising healthcare spending. Innovation in minimally invasive procedures, coupled with the development of biocompatible materials and improved valve designs, will shape the future of the industry. Expanding access to these life-saving procedures in emerging markets presents a significant growth opportunity. Companies that effectively leverage technological advancements and adapt to evolving regulatory landscapes will be well-positioned to succeed in this dynamic market.
Prosthetic Heart Valve Industry Segmentation
-
1. Type of Valve
- 1.1. Mechanical Heart Valve
- 1.2. Bioprosthetic Heart Valve
- 1.3. Transcatheter Heart Valve
-
2. Position
- 2.1. Mitral Valve
- 2.2. Aortic Valve
- 2.3. Other Positions
Prosthetic Heart Valve Industry Segmentation By Geography
-
1. North America
- 1.1. United States
- 1.2. Canada
- 1.3. Mexico
-
2. Europe
- 2.1. Germany
- 2.2. United Kingdom
- 2.3. France
- 2.4. Italy
- 2.5. Spain
- 2.6. Rest of Europe
-
3. Asia Pacific
- 3.1. China
- 3.2. Japan
- 3.3. India
- 3.4. Australia
- 3.5. South Korea
- 3.6. Rest of Asia Pacific
-
4. Middle East and Africa
- 4.1. GCC
- 4.2. South Africa
- 4.3. Rest of Middle East and Africa
-
5. South America
- 5.1. Brazil
- 5.2. Argentina
- 5.3. Rest of South America
Prosthetic Heart Valve Industry REPORT HIGHLIGHTS
| Aspects | Details |
|---|---|
| Study Period | 2019-2033 |
| Base Year | 2024 |
| Estimated Year | 2025 |
| Forecast Period | 2025-2033 |
| Historical Period | 2019-2024 |
| Growth Rate | CAGR of 11.80% from 2019-2033 |
| Segmentation |
|
Table of Contents
- 1. Introduction
- 1.1. Research Scope
- 1.2. Market Segmentation
- 1.3. Research Methodology
- 1.4. Definitions and Assumptions
- 2. Executive Summary
- 2.1. Introduction
- 3. Market Dynamics
- 3.1. Introduction
- 3.2. Market Drivers
- 3.2.1. Increasing Prevalence of Heart Valve Disease; Rising Regulatory Approvals for New and Advanced Prosthetic Heart Valve
- 3.3. Market Restrains
- 3.3.1. High Cost of Transcatheter Aortic Valve Replacement (TAVR) Procedures; Availability of Alternative Methods for Treating Heart Valve Diseases (HVD)
- 3.4. Market Trends
- 3.4.1. Transcatheter Heart Valve Segment is Expected to Register Robust Growth During the Forecast Period
- 4. Market Factor Analysis
- 4.1. Porters Five Forces
- 4.2. Supply/Value Chain
- 4.3. PESTEL analysis
- 4.4. Market Entropy
- 4.5. Patent/Trademark Analysis
- 5. Global Prosthetic Heart Valve Industry Analysis, Insights and Forecast, 2019-2031
- 5.1. Market Analysis, Insights and Forecast - by Type of Valve
- 5.1.1. Mechanical Heart Valve
- 5.1.2. Bioprosthetic Heart Valve
- 5.1.3. Transcatheter Heart Valve
- 5.2. Market Analysis, Insights and Forecast - by Position
- 5.2.1. Mitral Valve
- 5.2.2. Aortic Valve
- 5.2.3. Other Positions
- 5.3. Market Analysis, Insights and Forecast - by Region
- 5.3.1. North America
- 5.3.2. Europe
- 5.3.3. Asia Pacific
- 5.3.4. Middle East and Africa
- 5.3.5. South America
- 5.1. Market Analysis, Insights and Forecast - by Type of Valve
- 6. North America Prosthetic Heart Valve Industry Analysis, Insights and Forecast, 2019-2031
- 6.1. Market Analysis, Insights and Forecast - by Type of Valve
- 6.1.1. Mechanical Heart Valve
- 6.1.2. Bioprosthetic Heart Valve
- 6.1.3. Transcatheter Heart Valve
- 6.2. Market Analysis, Insights and Forecast - by Position
- 6.2.1. Mitral Valve
- 6.2.2. Aortic Valve
- 6.2.3. Other Positions
- 6.1. Market Analysis, Insights and Forecast - by Type of Valve
- 7. Europe Prosthetic Heart Valve Industry Analysis, Insights and Forecast, 2019-2031
- 7.1. Market Analysis, Insights and Forecast - by Type of Valve
- 7.1.1. Mechanical Heart Valve
- 7.1.2. Bioprosthetic Heart Valve
- 7.1.3. Transcatheter Heart Valve
- 7.2. Market Analysis, Insights and Forecast - by Position
- 7.2.1. Mitral Valve
- 7.2.2. Aortic Valve
- 7.2.3. Other Positions
- 7.1. Market Analysis, Insights and Forecast - by Type of Valve
- 8. Asia Pacific Prosthetic Heart Valve Industry Analysis, Insights and Forecast, 2019-2031
- 8.1. Market Analysis, Insights and Forecast - by Type of Valve
- 8.1.1. Mechanical Heart Valve
- 8.1.2. Bioprosthetic Heart Valve
- 8.1.3. Transcatheter Heart Valve
- 8.2. Market Analysis, Insights and Forecast - by Position
- 8.2.1. Mitral Valve
- 8.2.2. Aortic Valve
- 8.2.3. Other Positions
- 8.1. Market Analysis, Insights and Forecast - by Type of Valve
- 9. Middle East and Africa Prosthetic Heart Valve Industry Analysis, Insights and Forecast, 2019-2031
- 9.1. Market Analysis, Insights and Forecast - by Type of Valve
- 9.1.1. Mechanical Heart Valve
- 9.1.2. Bioprosthetic Heart Valve
- 9.1.3. Transcatheter Heart Valve
- 9.2. Market Analysis, Insights and Forecast - by Position
- 9.2.1. Mitral Valve
- 9.2.2. Aortic Valve
- 9.2.3. Other Positions
- 9.1. Market Analysis, Insights and Forecast - by Type of Valve
- 10. South America Prosthetic Heart Valve Industry Analysis, Insights and Forecast, 2019-2031
- 10.1. Market Analysis, Insights and Forecast - by Type of Valve
- 10.1.1. Mechanical Heart Valve
- 10.1.2. Bioprosthetic Heart Valve
- 10.1.3. Transcatheter Heart Valve
- 10.2. Market Analysis, Insights and Forecast - by Position
- 10.2.1. Mitral Valve
- 10.2.2. Aortic Valve
- 10.2.3. Other Positions
- 10.1. Market Analysis, Insights and Forecast - by Type of Valve
- 11. North America Prosthetic Heart Valve Industry Analysis, Insights and Forecast, 2019-2031
- 11.1. Market Analysis, Insights and Forecast - By Country/Sub-region
- 11.1.1. undefined
- 12. Europe Prosthetic Heart Valve Industry Analysis, Insights and Forecast, 2019-2031
- 12.1. Market Analysis, Insights and Forecast - By Country/Sub-region
- 12.1.1. undefined
- 13. Asia Pacific Prosthetic Heart Valve Industry Analysis, Insights and Forecast, 2019-2031
- 13.1. Market Analysis, Insights and Forecast - By Country/Sub-region
- 13.1.1. undefined
- 14. Middle East and Africa Prosthetic Heart Valve Industry Analysis, Insights and Forecast, 2019-2031
- 14.1. Market Analysis, Insights and Forecast - By Country/Sub-region
- 14.1.1. undefined
- 15. South America Prosthetic Heart Valve Industry Analysis, Insights and Forecast, 2019-2031
- 15.1. Market Analysis, Insights and Forecast - By Country/Sub-region
- 15.1.1. undefined
- 16. Competitive Analysis
- 16.1. Global Market Share Analysis 2024
- 16.2. Company Profiles
- 16.2.1 Edwards Lifesciences Corporation
- 16.2.1.1. Overview
- 16.2.1.2. Products
- 16.2.1.3. SWOT Analysis
- 16.2.1.4. Recent Developments
- 16.2.1.5. Financials (Based on Availability)
- 16.2.2 Foldax Inc
- 16.2.2.1. Overview
- 16.2.2.2. Products
- 16.2.2.3. SWOT Analysis
- 16.2.2.4. Recent Developments
- 16.2.2.5. Financials (Based on Availability)
- 16.2.3 Jenavalve Technology Inc
- 16.2.3.1. Overview
- 16.2.3.2. Products
- 16.2.3.3. SWOT Analysis
- 16.2.3.4. Recent Developments
- 16.2.3.5. Financials (Based on Availability)
- 16.2.4 Cryolife Inc
- 16.2.4.1. Overview
- 16.2.4.2. Products
- 16.2.4.3. SWOT Analysis
- 16.2.4.4. Recent Developments
- 16.2.4.5. Financials (Based on Availability)
- 16.2.5 Lepu Medical Technology Co Ltd
- 16.2.5.1. Overview
- 16.2.5.2. Products
- 16.2.5.3. SWOT Analysis
- 16.2.5.4. Recent Developments
- 16.2.5.5. Financials (Based on Availability)
- 16.2.6 Medtronic PLC
- 16.2.6.1. Overview
- 16.2.6.2. Products
- 16.2.6.3. SWOT Analysis
- 16.2.6.4. Recent Developments
- 16.2.6.5. Financials (Based on Availability)
- 16.2.7 Abbott Laboratories (St Jude Medical Inc )
- 16.2.7.1. Overview
- 16.2.7.2. Products
- 16.2.7.3. SWOT Analysis
- 16.2.7.4. Recent Developments
- 16.2.7.5. Financials (Based on Availability)
- 16.2.8 Symetis SA
- 16.2.8.1. Overview
- 16.2.8.2. Products
- 16.2.8.3. SWOT Analysis
- 16.2.8.4. Recent Developments
- 16.2.8.5. Financials (Based on Availability)
- 16.2.9 Colibri Heart Valve LLC
- 16.2.9.1. Overview
- 16.2.9.2. Products
- 16.2.9.3. SWOT Analysis
- 16.2.9.4. Recent Developments
- 16.2.9.5. Financials (Based on Availability)
- 16.2.10 Boston Scientific Corporation
- 16.2.10.1. Overview
- 16.2.10.2. Products
- 16.2.10.3. SWOT Analysis
- 16.2.10.4. Recent Developments
- 16.2.10.5. Financials (Based on Availability)
- 16.2.11 TTK Healthcare Limited
- 16.2.11.1. Overview
- 16.2.11.2. Products
- 16.2.11.3. SWOT Analysis
- 16.2.11.4. Recent Developments
- 16.2.11.5. Financials (Based on Availability)
- 16.2.1 Edwards Lifesciences Corporation
List of Figures
- Figure 1: Global Prosthetic Heart Valve Industry Revenue Breakdown (Million, %) by Region 2024 & 2032
- Figure 2: Global Prosthetic Heart Valve Industry Volume Breakdown (K Unit, %) by Region 2024 & 2032
- Figure 3: North America Prosthetic Heart Valve Industry Revenue (Million), by Country 2024 & 2032
- Figure 4: North America Prosthetic Heart Valve Industry Volume (K Unit), by Country 2024 & 2032
- Figure 5: North America Prosthetic Heart Valve Industry Revenue Share (%), by Country 2024 & 2032
- Figure 6: North America Prosthetic Heart Valve Industry Volume Share (%), by Country 2024 & 2032
- Figure 7: Europe Prosthetic Heart Valve Industry Revenue (Million), by Country 2024 & 2032
- Figure 8: Europe Prosthetic Heart Valve Industry Volume (K Unit), by Country 2024 & 2032
- Figure 9: Europe Prosthetic Heart Valve Industry Revenue Share (%), by Country 2024 & 2032
- Figure 10: Europe Prosthetic Heart Valve Industry Volume Share (%), by Country 2024 & 2032
- Figure 11: Asia Pacific Prosthetic Heart Valve Industry Revenue (Million), by Country 2024 & 2032
- Figure 12: Asia Pacific Prosthetic Heart Valve Industry Volume (K Unit), by Country 2024 & 2032
- Figure 13: Asia Pacific Prosthetic Heart Valve Industry Revenue Share (%), by Country 2024 & 2032
- Figure 14: Asia Pacific Prosthetic Heart Valve Industry Volume Share (%), by Country 2024 & 2032
- Figure 15: Middle East and Africa Prosthetic Heart Valve Industry Revenue (Million), by Country 2024 & 2032
- Figure 16: Middle East and Africa Prosthetic Heart Valve Industry Volume (K Unit), by Country 2024 & 2032
- Figure 17: Middle East and Africa Prosthetic Heart Valve Industry Revenue Share (%), by Country 2024 & 2032
- Figure 18: Middle East and Africa Prosthetic Heart Valve Industry Volume Share (%), by Country 2024 & 2032
- Figure 19: South America Prosthetic Heart Valve Industry Revenue (Million), by Country 2024 & 2032
- Figure 20: South America Prosthetic Heart Valve Industry Volume (K Unit), by Country 2024 & 2032
- Figure 21: South America Prosthetic Heart Valve Industry Revenue Share (%), by Country 2024 & 2032
- Figure 22: South America Prosthetic Heart Valve Industry Volume Share (%), by Country 2024 & 2032
- Figure 23: North America Prosthetic Heart Valve Industry Revenue (Million), by Type of Valve 2024 & 2032
- Figure 24: North America Prosthetic Heart Valve Industry Volume (K Unit), by Type of Valve 2024 & 2032
- Figure 25: North America Prosthetic Heart Valve Industry Revenue Share (%), by Type of Valve 2024 & 2032
- Figure 26: North America Prosthetic Heart Valve Industry Volume Share (%), by Type of Valve 2024 & 2032
- Figure 27: North America Prosthetic Heart Valve Industry Revenue (Million), by Position 2024 & 2032
- Figure 28: North America Prosthetic Heart Valve Industry Volume (K Unit), by Position 2024 & 2032
- Figure 29: North America Prosthetic Heart Valve Industry Revenue Share (%), by Position 2024 & 2032
- Figure 30: North America Prosthetic Heart Valve Industry Volume Share (%), by Position 2024 & 2032
- Figure 31: North America Prosthetic Heart Valve Industry Revenue (Million), by Country 2024 & 2032
- Figure 32: North America Prosthetic Heart Valve Industry Volume (K Unit), by Country 2024 & 2032
- Figure 33: North America Prosthetic Heart Valve Industry Revenue Share (%), by Country 2024 & 2032
- Figure 34: North America Prosthetic Heart Valve Industry Volume Share (%), by Country 2024 & 2032
- Figure 35: Europe Prosthetic Heart Valve Industry Revenue (Million), by Type of Valve 2024 & 2032
- Figure 36: Europe Prosthetic Heart Valve Industry Volume (K Unit), by Type of Valve 2024 & 2032
- Figure 37: Europe Prosthetic Heart Valve Industry Revenue Share (%), by Type of Valve 2024 & 2032
- Figure 38: Europe Prosthetic Heart Valve Industry Volume Share (%), by Type of Valve 2024 & 2032
- Figure 39: Europe Prosthetic Heart Valve Industry Revenue (Million), by Position 2024 & 2032
- Figure 40: Europe Prosthetic Heart Valve Industry Volume (K Unit), by Position 2024 & 2032
- Figure 41: Europe Prosthetic Heart Valve Industry Revenue Share (%), by Position 2024 & 2032
- Figure 42: Europe Prosthetic Heart Valve Industry Volume Share (%), by Position 2024 & 2032
- Figure 43: Europe Prosthetic Heart Valve Industry Revenue (Million), by Country 2024 & 2032
- Figure 44: Europe Prosthetic Heart Valve Industry Volume (K Unit), by Country 2024 & 2032
- Figure 45: Europe Prosthetic Heart Valve Industry Revenue Share (%), by Country 2024 & 2032
- Figure 46: Europe Prosthetic Heart Valve Industry Volume Share (%), by Country 2024 & 2032
- Figure 47: Asia Pacific Prosthetic Heart Valve Industry Revenue (Million), by Type of Valve 2024 & 2032
- Figure 48: Asia Pacific Prosthetic Heart Valve Industry Volume (K Unit), by Type of Valve 2024 & 2032
- Figure 49: Asia Pacific Prosthetic Heart Valve Industry Revenue Share (%), by Type of Valve 2024 & 2032
- Figure 50: Asia Pacific Prosthetic Heart Valve Industry Volume Share (%), by Type of Valve 2024 & 2032
- Figure 51: Asia Pacific Prosthetic Heart Valve Industry Revenue (Million), by Position 2024 & 2032
- Figure 52: Asia Pacific Prosthetic Heart Valve Industry Volume (K Unit), by Position 2024 & 2032
- Figure 53: Asia Pacific Prosthetic Heart Valve Industry Revenue Share (%), by Position 2024 & 2032
- Figure 54: Asia Pacific Prosthetic Heart Valve Industry Volume Share (%), by Position 2024 & 2032
- Figure 55: Asia Pacific Prosthetic Heart Valve Industry Revenue (Million), by Country 2024 & 2032
- Figure 56: Asia Pacific Prosthetic Heart Valve Industry Volume (K Unit), by Country 2024 & 2032
- Figure 57: Asia Pacific Prosthetic Heart Valve Industry Revenue Share (%), by Country 2024 & 2032
- Figure 58: Asia Pacific Prosthetic Heart Valve Industry Volume Share (%), by Country 2024 & 2032
- Figure 59: Middle East and Africa Prosthetic Heart Valve Industry Revenue (Million), by Type of Valve 2024 & 2032
- Figure 60: Middle East and Africa Prosthetic Heart Valve Industry Volume (K Unit), by Type of Valve 2024 & 2032
- Figure 61: Middle East and Africa Prosthetic Heart Valve Industry Revenue Share (%), by Type of Valve 2024 & 2032
- Figure 62: Middle East and Africa Prosthetic Heart Valve Industry Volume Share (%), by Type of Valve 2024 & 2032
- Figure 63: Middle East and Africa Prosthetic Heart Valve Industry Revenue (Million), by Position 2024 & 2032
- Figure 64: Middle East and Africa Prosthetic Heart Valve Industry Volume (K Unit), by Position 2024 & 2032
- Figure 65: Middle East and Africa Prosthetic Heart Valve Industry Revenue Share (%), by Position 2024 & 2032
- Figure 66: Middle East and Africa Prosthetic Heart Valve Industry Volume Share (%), by Position 2024 & 2032
- Figure 67: Middle East and Africa Prosthetic Heart Valve Industry Revenue (Million), by Country 2024 & 2032
- Figure 68: Middle East and Africa Prosthetic Heart Valve Industry Volume (K Unit), by Country 2024 & 2032
- Figure 69: Middle East and Africa Prosthetic Heart Valve Industry Revenue Share (%), by Country 2024 & 2032
- Figure 70: Middle East and Africa Prosthetic Heart Valve Industry Volume Share (%), by Country 2024 & 2032
- Figure 71: South America Prosthetic Heart Valve Industry Revenue (Million), by Type of Valve 2024 & 2032
- Figure 72: South America Prosthetic Heart Valve Industry Volume (K Unit), by Type of Valve 2024 & 2032
- Figure 73: South America Prosthetic Heart Valve Industry Revenue Share (%), by Type of Valve 2024 & 2032
- Figure 74: South America Prosthetic Heart Valve Industry Volume Share (%), by Type of Valve 2024 & 2032
- Figure 75: South America Prosthetic Heart Valve Industry Revenue (Million), by Position 2024 & 2032
- Figure 76: South America Prosthetic Heart Valve Industry Volume (K Unit), by Position 2024 & 2032
- Figure 77: South America Prosthetic Heart Valve Industry Revenue Share (%), by Position 2024 & 2032
- Figure 78: South America Prosthetic Heart Valve Industry Volume Share (%), by Position 2024 & 2032
- Figure 79: South America Prosthetic Heart Valve Industry Revenue (Million), by Country 2024 & 2032
- Figure 80: South America Prosthetic Heart Valve Industry Volume (K Unit), by Country 2024 & 2032
- Figure 81: South America Prosthetic Heart Valve Industry Revenue Share (%), by Country 2024 & 2032
- Figure 82: South America Prosthetic Heart Valve Industry Volume Share (%), by Country 2024 & 2032
List of Tables
- Table 1: Global Prosthetic Heart Valve Industry Revenue Million Forecast, by Region 2019 & 2032
- Table 2: Global Prosthetic Heart Valve Industry Volume K Unit Forecast, by Region 2019 & 2032
- Table 3: Global Prosthetic Heart Valve Industry Revenue Million Forecast, by Type of Valve 2019 & 2032
- Table 4: Global Prosthetic Heart Valve Industry Volume K Unit Forecast, by Type of Valve 2019 & 2032
- Table 5: Global Prosthetic Heart Valve Industry Revenue Million Forecast, by Position 2019 & 2032
- Table 6: Global Prosthetic Heart Valve Industry Volume K Unit Forecast, by Position 2019 & 2032
- Table 7: Global Prosthetic Heart Valve Industry Revenue Million Forecast, by Region 2019 & 2032
- Table 8: Global Prosthetic Heart Valve Industry Volume K Unit Forecast, by Region 2019 & 2032
- Table 9: Global Prosthetic Heart Valve Industry Revenue Million Forecast, by Country 2019 & 2032
- Table 10: Global Prosthetic Heart Valve Industry Volume K Unit Forecast, by Country 2019 & 2032
- Table 11: Global Prosthetic Heart Valve Industry Revenue Million Forecast, by Country 2019 & 2032
- Table 12: Global Prosthetic Heart Valve Industry Volume K Unit Forecast, by Country 2019 & 2032
- Table 13: Global Prosthetic Heart Valve Industry Revenue Million Forecast, by Country 2019 & 2032
- Table 14: Global Prosthetic Heart Valve Industry Volume K Unit Forecast, by Country 2019 & 2032
- Table 15: Global Prosthetic Heart Valve Industry Revenue Million Forecast, by Country 2019 & 2032
- Table 16: Global Prosthetic Heart Valve Industry Volume K Unit Forecast, by Country 2019 & 2032
- Table 17: Global Prosthetic Heart Valve Industry Revenue Million Forecast, by Country 2019 & 2032
- Table 18: Global Prosthetic Heart Valve Industry Volume K Unit Forecast, by Country 2019 & 2032
- Table 19: Global Prosthetic Heart Valve Industry Revenue Million Forecast, by Type of Valve 2019 & 2032
- Table 20: Global Prosthetic Heart Valve Industry Volume K Unit Forecast, by Type of Valve 2019 & 2032
- Table 21: Global Prosthetic Heart Valve Industry Revenue Million Forecast, by Position 2019 & 2032
- Table 22: Global Prosthetic Heart Valve Industry Volume K Unit Forecast, by Position 2019 & 2032
- Table 23: Global Prosthetic Heart Valve Industry Revenue Million Forecast, by Country 2019 & 2032
- Table 24: Global Prosthetic Heart Valve Industry Volume K Unit Forecast, by Country 2019 & 2032
- Table 25: United States Prosthetic Heart Valve Industry Revenue (Million) Forecast, by Application 2019 & 2032
- Table 26: United States Prosthetic Heart Valve Industry Volume (K Unit) Forecast, by Application 2019 & 2032
- Table 27: Canada Prosthetic Heart Valve Industry Revenue (Million) Forecast, by Application 2019 & 2032
- Table 28: Canada Prosthetic Heart Valve Industry Volume (K Unit) Forecast, by Application 2019 & 2032
- Table 29: Mexico Prosthetic Heart Valve Industry Revenue (Million) Forecast, by Application 2019 & 2032
- Table 30: Mexico Prosthetic Heart Valve Industry Volume (K Unit) Forecast, by Application 2019 & 2032
- Table 31: Global Prosthetic Heart Valve Industry Revenue Million Forecast, by Type of Valve 2019 & 2032
- Table 32: Global Prosthetic Heart Valve Industry Volume K Unit Forecast, by Type of Valve 2019 & 2032
- Table 33: Global Prosthetic Heart Valve Industry Revenue Million Forecast, by Position 2019 & 2032
- Table 34: Global Prosthetic Heart Valve Industry Volume K Unit Forecast, by Position 2019 & 2032
- Table 35: Global Prosthetic Heart Valve Industry Revenue Million Forecast, by Country 2019 & 2032
- Table 36: Global Prosthetic Heart Valve Industry Volume K Unit Forecast, by Country 2019 & 2032
- Table 37: Germany Prosthetic Heart Valve Industry Revenue (Million) Forecast, by Application 2019 & 2032
- Table 38: Germany Prosthetic Heart Valve Industry Volume (K Unit) Forecast, by Application 2019 & 2032
- Table 39: United Kingdom Prosthetic Heart Valve Industry Revenue (Million) Forecast, by Application 2019 & 2032
- Table 40: United Kingdom Prosthetic Heart Valve Industry Volume (K Unit) Forecast, by Application 2019 & 2032
- Table 41: France Prosthetic Heart Valve Industry Revenue (Million) Forecast, by Application 2019 & 2032
- Table 42: France Prosthetic Heart Valve Industry Volume (K Unit) Forecast, by Application 2019 & 2032
- Table 43: Italy Prosthetic Heart Valve Industry Revenue (Million) Forecast, by Application 2019 & 2032
- Table 44: Italy Prosthetic Heart Valve Industry Volume (K Unit) Forecast, by Application 2019 & 2032
- Table 45: Spain Prosthetic Heart Valve Industry Revenue (Million) Forecast, by Application 2019 & 2032
- Table 46: Spain Prosthetic Heart Valve Industry Volume (K Unit) Forecast, by Application 2019 & 2032
- Table 47: Rest of Europe Prosthetic Heart Valve Industry Revenue (Million) Forecast, by Application 2019 & 2032
- Table 48: Rest of Europe Prosthetic Heart Valve Industry Volume (K Unit) Forecast, by Application 2019 & 2032
- Table 49: Global Prosthetic Heart Valve Industry Revenue Million Forecast, by Type of Valve 2019 & 2032
- Table 50: Global Prosthetic Heart Valve Industry Volume K Unit Forecast, by Type of Valve 2019 & 2032
- Table 51: Global Prosthetic Heart Valve Industry Revenue Million Forecast, by Position 2019 & 2032
- Table 52: Global Prosthetic Heart Valve Industry Volume K Unit Forecast, by Position 2019 & 2032
- Table 53: Global Prosthetic Heart Valve Industry Revenue Million Forecast, by Country 2019 & 2032
- Table 54: Global Prosthetic Heart Valve Industry Volume K Unit Forecast, by Country 2019 & 2032
- Table 55: China Prosthetic Heart Valve Industry Revenue (Million) Forecast, by Application 2019 & 2032
- Table 56: China Prosthetic Heart Valve Industry Volume (K Unit) Forecast, by Application 2019 & 2032
- Table 57: Japan Prosthetic Heart Valve Industry Revenue (Million) Forecast, by Application 2019 & 2032
- Table 58: Japan Prosthetic Heart Valve Industry Volume (K Unit) Forecast, by Application 2019 & 2032
- Table 59: India Prosthetic Heart Valve Industry Revenue (Million) Forecast, by Application 2019 & 2032
- Table 60: India Prosthetic Heart Valve Industry Volume (K Unit) Forecast, by Application 2019 & 2032
- Table 61: Australia Prosthetic Heart Valve Industry Revenue (Million) Forecast, by Application 2019 & 2032
- Table 62: Australia Prosthetic Heart Valve Industry Volume (K Unit) Forecast, by Application 2019 & 2032
- Table 63: South Korea Prosthetic Heart Valve Industry Revenue (Million) Forecast, by Application 2019 & 2032
- Table 64: South Korea Prosthetic Heart Valve Industry Volume (K Unit) Forecast, by Application 2019 & 2032
- Table 65: Rest of Asia Pacific Prosthetic Heart Valve Industry Revenue (Million) Forecast, by Application 2019 & 2032
- Table 66: Rest of Asia Pacific Prosthetic Heart Valve Industry Volume (K Unit) Forecast, by Application 2019 & 2032
- Table 67: Global Prosthetic Heart Valve Industry Revenue Million Forecast, by Type of Valve 2019 & 2032
- Table 68: Global Prosthetic Heart Valve Industry Volume K Unit Forecast, by Type of Valve 2019 & 2032
- Table 69: Global Prosthetic Heart Valve Industry Revenue Million Forecast, by Position 2019 & 2032
- Table 70: Global Prosthetic Heart Valve Industry Volume K Unit Forecast, by Position 2019 & 2032
- Table 71: Global Prosthetic Heart Valve Industry Revenue Million Forecast, by Country 2019 & 2032
- Table 72: Global Prosthetic Heart Valve Industry Volume K Unit Forecast, by Country 2019 & 2032
- Table 73: GCC Prosthetic Heart Valve Industry Revenue (Million) Forecast, by Application 2019 & 2032
- Table 74: GCC Prosthetic Heart Valve Industry Volume (K Unit) Forecast, by Application 2019 & 2032
- Table 75: South Africa Prosthetic Heart Valve Industry Revenue (Million) Forecast, by Application 2019 & 2032
- Table 76: South Africa Prosthetic Heart Valve Industry Volume (K Unit) Forecast, by Application 2019 & 2032
- Table 77: Rest of Middle East and Africa Prosthetic Heart Valve Industry Revenue (Million) Forecast, by Application 2019 & 2032
- Table 78: Rest of Middle East and Africa Prosthetic Heart Valve Industry Volume (K Unit) Forecast, by Application 2019 & 2032
- Table 79: Global Prosthetic Heart Valve Industry Revenue Million Forecast, by Type of Valve 2019 & 2032
- Table 80: Global Prosthetic Heart Valve Industry Volume K Unit Forecast, by Type of Valve 2019 & 2032
- Table 81: Global Prosthetic Heart Valve Industry Revenue Million Forecast, by Position 2019 & 2032
- Table 82: Global Prosthetic Heart Valve Industry Volume K Unit Forecast, by Position 2019 & 2032
- Table 83: Global Prosthetic Heart Valve Industry Revenue Million Forecast, by Country 2019 & 2032
- Table 84: Global Prosthetic Heart Valve Industry Volume K Unit Forecast, by Country 2019 & 2032
- Table 85: Brazil Prosthetic Heart Valve Industry Revenue (Million) Forecast, by Application 2019 & 2032
- Table 86: Brazil Prosthetic Heart Valve Industry Volume (K Unit) Forecast, by Application 2019 & 2032
- Table 87: Argentina Prosthetic Heart Valve Industry Revenue (Million) Forecast, by Application 2019 & 2032
- Table 88: Argentina Prosthetic Heart Valve Industry Volume (K Unit) Forecast, by Application 2019 & 2032
- Table 89: Rest of South America Prosthetic Heart Valve Industry Revenue (Million) Forecast, by Application 2019 & 2032
- Table 90: Rest of South America Prosthetic Heart Valve Industry Volume (K Unit) Forecast, by Application 2019 & 2032
Frequently Asked Questions
1. What is the projected Compound Annual Growth Rate (CAGR) of the Prosthetic Heart Valve Industry?
The projected CAGR is approximately 11.80%.
2. Which companies are prominent players in the Prosthetic Heart Valve Industry?
Key companies in the market include Edwards Lifesciences Corporation, Foldax Inc, Jenavalve Technology Inc, Cryolife Inc, Lepu Medical Technology Co Ltd, Medtronic PLC, Abbott Laboratories (St Jude Medical Inc ), Symetis SA, Colibri Heart Valve LLC, Boston Scientific Corporation, TTK Healthcare Limited.
3. What are the main segments of the Prosthetic Heart Valve Industry?
The market segments include Type of Valve, Position.
4. Can you provide details about the market size?
The market size is estimated to be USD 11.94 Million as of 2022.
5. What are some drivers contributing to market growth?
Increasing Prevalence of Heart Valve Disease; Rising Regulatory Approvals for New and Advanced Prosthetic Heart Valve.
6. What are the notable trends driving market growth?
Transcatheter Heart Valve Segment is Expected to Register Robust Growth During the Forecast Period.
7. Are there any restraints impacting market growth?
High Cost of Transcatheter Aortic Valve Replacement (TAVR) Procedures; Availability of Alternative Methods for Treating Heart Valve Diseases (HVD).
8. Can you provide examples of recent developments in the market?
In March 2022, Edwards Lifesciences received approval from the United States Food and Drug Administration (FDA) for the MITRIS RESILIA valve. It is a tissue valve replacement specifically designed for the heart's mitral position.
9. What pricing options are available for accessing the report?
Pricing options include single-user, multi-user, and enterprise licenses priced at USD 4750, USD 5250, and USD 8750 respectively.
10. Is the market size provided in terms of value or volume?
The market size is provided in terms of value, measured in Million and volume, measured in K Unit.
11. Are there any specific market keywords associated with the report?
Yes, the market keyword associated with the report is "Prosthetic Heart Valve Industry," which aids in identifying and referencing the specific market segment covered.
12. How do I determine which pricing option suits my needs best?
The pricing options vary based on user requirements and access needs. Individual users may opt for single-user licenses, while businesses requiring broader access may choose multi-user or enterprise licenses for cost-effective access to the report.
13. Are there any additional resources or data provided in the Prosthetic Heart Valve Industry report?
While the report offers comprehensive insights, it's advisable to review the specific contents or supplementary materials provided to ascertain if additional resources or data are available.
14. How can I stay updated on further developments or reports in the Prosthetic Heart Valve Industry?
To stay informed about further developments, trends, and reports in the Prosthetic Heart Valve Industry, consider subscribing to industry newsletters, following relevant companies and organizations, or regularly checking reputable industry news sources and publications.
Methodology
Step 1 - Identification of Relevant Samples Size from Population Database


Step 2 - Approaches for Defining Global Market Size (Value, Volume* & Price*)

Note*: In applicable scenarios
Step 3 - Data Sources
Primary Research
- Web Analytics
- Survey Reports
- Research Institute
- Latest Research Reports
- Opinion Leaders
Secondary Research
- Annual Reports
- White Paper
- Latest Press Release
- Industry Association
- Paid Database
- Investor Presentations

Step 4 - Data Triangulation
Involves using different sources of information in order to increase the validity of a study
These sources are likely to be stakeholders in a program - participants, other researchers, program staff, other community members, and so on.
Then we put all data in single framework & apply various statistical tools to find out the dynamic on the market.
During the analysis stage, feedback from the stakeholder groups would be compared to determine areas of agreement as well as areas of divergence


