
Key Insights
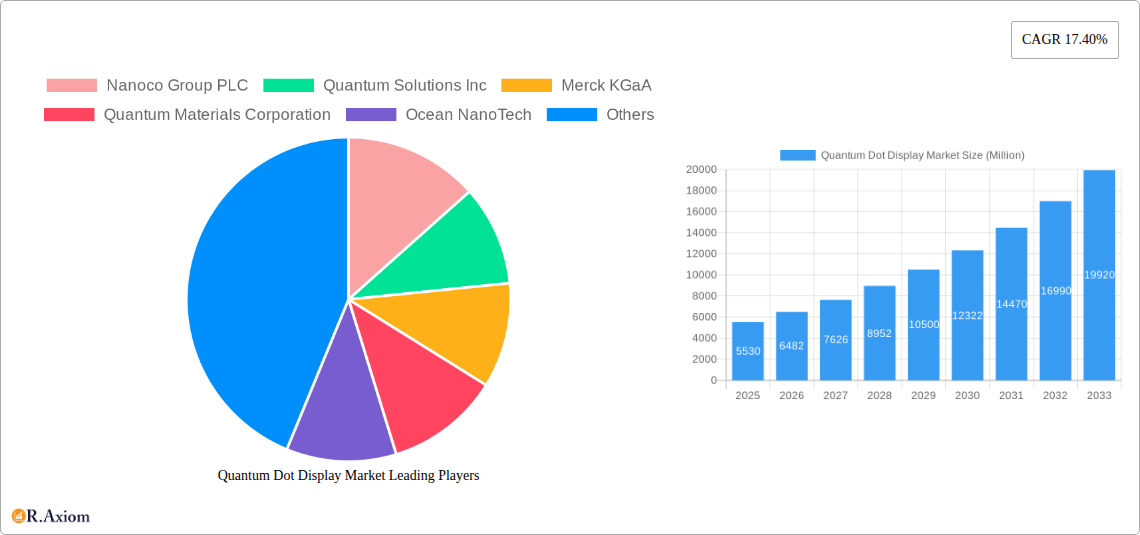
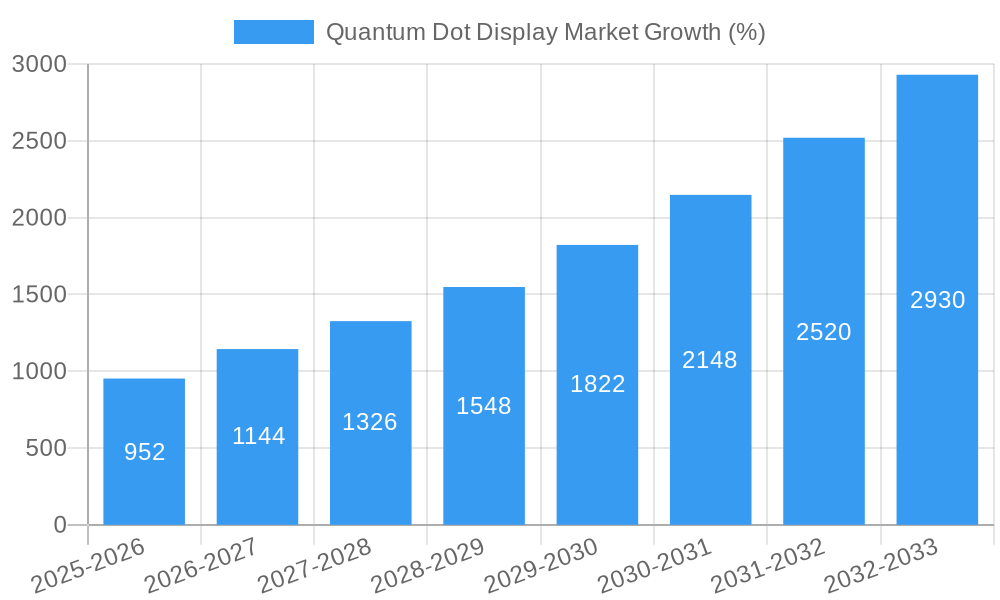
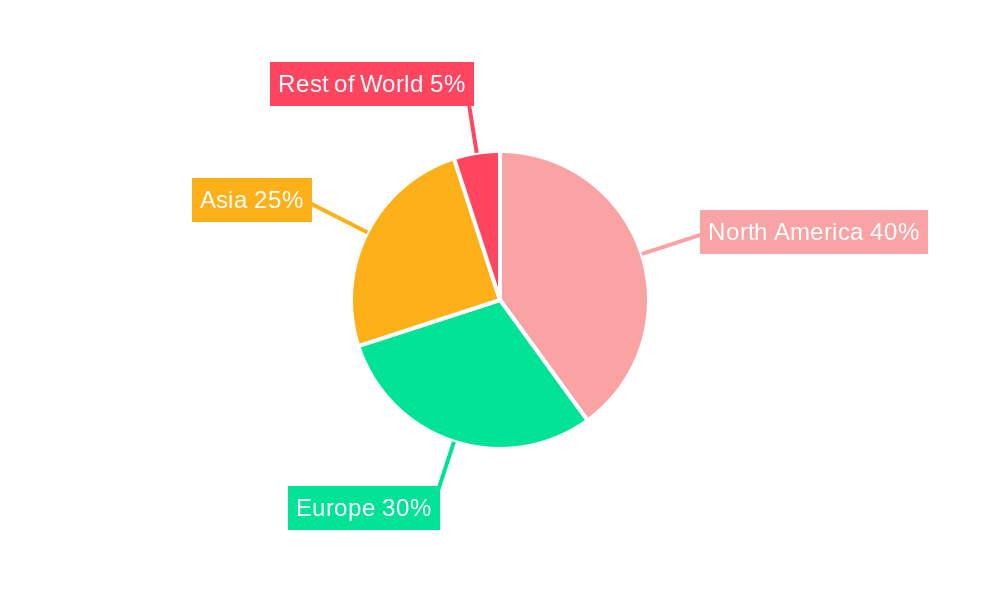
The Quantum Dot Display (QDD) market is experiencing robust growth, projected to reach a market size of $5.53 billion in 2025 and exhibiting a Compound Annual Growth Rate (CAGR) of 17.40% from 2025 to 2033. This significant expansion is driven by several key factors. Firstly, the superior color gamut, brightness, and energy efficiency of QDD technology compared to traditional LCD and OLED displays are fueling strong demand across various applications. The increasing adoption of QDDs in high-end televisions, smartphones, and monitors is a major contributor to market growth. Furthermore, ongoing advancements in quantum dot synthesis, leading to improved stability and cost-effectiveness, are making QDD technology more accessible. The growing demand for premium visual experiences in consumer electronics and the increasing penetration of large-screen displays in homes and workplaces further accelerate market expansion. Specific application segments like optoelectronics and optical components are leading the way, followed by promising growth in medical imaging and other niche applications like agriculture and alternative energy. Leading players like Nanoco Group PLC, Quantum Materials Corporation, and Merck KGaA are investing heavily in research and development to enhance QDD technology and expand their market presence. Geographic regions such as North America and Asia are expected to show considerable growth, fueled by high consumer spending on electronics and favorable government initiatives promoting technological advancement.
The competitive landscape is characterized by a mix of established materials companies and specialized quantum dot manufacturers. The market is witnessing increased mergers and acquisitions, strategic collaborations, and the introduction of innovative products, further intensifying competition. While challenges remain, such as the need for continuous improvement in quantum dot stability and cost reduction to achieve wider market penetration, the overall outlook for the QDD market remains highly positive, driven by strong technological advancements and increasing consumer demand for enhanced visual displays. The forecast period (2025-2033) promises significant opportunities for industry players to capitalize on the rising adoption of this next-generation display technology.
This in-depth report provides a comprehensive analysis of the Quantum Dot Display Market, offering actionable insights for industry stakeholders. The study covers the period from 2019 to 2033, with a base year of 2025 and a forecast period from 2025 to 2033. The report segments the market by type (III-V-Semiconductors, II-VI-Semiconductors, Silicon (Si)) and application (Optoelectronics and Optical Components, Medicine, Agriculture, Alternative Energy, Other Applications), providing a granular understanding of market dynamics and growth potential. The report value is in Millions.
Quantum Dot Display Market Concentration & Innovation
This section analyzes the competitive landscape of the quantum dot display market, examining market concentration, innovation drivers, regulatory frameworks, and key industry trends. We explore the impact of mergers and acquisitions (M&A) activities and their influence on market share. The analysis will delve into the strategies employed by leading players to maintain their competitive edge and capitalize on emerging opportunities. The report will also examine the role of intellectual property rights and potential antitrust concerns.
Market Concentration: We will assess the market share held by key players such as Nanoco Group PLC, Quantum Solutions Inc, Merck KGaA, Quantum Materials Corporation, Ocean NanoTech, Thermo Fisher Scientific Inc, NnCrystal US Corporation (NN-Labs), UbiQD Inc, Nanosys Inc (Shoei Electronic Materials Inc), and NanoOptical Materials Inc, identifying any significant market dominance and associated implications. Market share data will be presented graphically and analyzed for trends. We will also examine the Herfindahl-Hirschman Index (HHI) to quantify market concentration.
Innovation Drivers: We will examine the factors driving innovation in this sector, focusing on advancements in materials science, nanotechnology, and display technologies. This includes evaluating the impact of R&D investments, government funding initiatives, and collaborative research efforts.
Regulatory Frameworks: A detailed analysis of international and regional regulations impacting the manufacturing, distribution, and application of quantum dot displays is presented. This will include discussions of safety standards, environmental regulations, and trade policies.
Product Substitutes: We will evaluate the threat of substitute technologies to quantum dot displays, considering their advantages and disadvantages relative to existing and emerging alternatives.
End-User Trends: We assess how the adoption of quantum dot displays is influenced by consumer demand, emerging display technologies, and the preferences of various end-user sectors.
M&A Activities: An in-depth analysis of significant M&A activities in the market during the historical period (2019-2024) will be included. This analysis will encompass deal values (in Millions) and the strategic implications of these transactions for market structure and competition. We will also project potential future M&A activity.
Quantum Dot Display Market Industry Trends & Insights
This section provides a comprehensive overview of the key trends shaping the Quantum Dot Display Market. We examine market growth drivers, technological disruptions, consumer preferences, and competitive dynamics. We will analyze data to provide forecasts for market growth and penetration rates by segment.
This section will discuss factors such as the increasing demand for high-resolution displays, advancements in quantum dot materials synthesis, and the growing adoption of quantum dot displays across various applications, such as consumer electronics, healthcare, and displays for the automotive industry. The analysis will also incorporate data from a variety of sources, including market research reports, industry publications, and government reports. This analysis will delve into the competitive landscape, highlighting market share, strategic partnerships, and technological advancements. The CAGR (Compound Annual Growth Rate) for the forecast period (2025-2033) will be calculated and presented. Market penetration rates within various key segments will also be explored. The impact of emerging technologies such as microLED and OLED on the quantum dot display market will be comprehensively assessed.
Dominant Markets & Segments in Quantum Dot Display Market
This section identifies the leading regions, countries, and market segments within the Quantum Dot Display Market. It analyzes the factors driving market dominance, highlighting key drivers specific to each segment and region.
By Type:
III-V-Semiconductors: This section will analyze the market size and growth prospects of III-V-Semiconductor-based quantum dots in the display market. Key drivers for this segment include its superior performance characteristics and market acceptance in high-end applications. We will also detail any limitations, costs associated, and the overall competitive landscape. Projected market size for 2033: xx Million
II-VI-Semiconductors: Similar to the III-V analysis, this section will assess the market size and growth projections for II-VI-Semiconductor-based quantum dots. We will delve into their advantages and disadvantages, emphasizing areas of improvement. Projected market size for 2033: xx Million
Silicon (Si): This section will cover the use of silicon-based quantum dots in displays. We'll explore its potential advantages, limitations, and growth prospects, including its cost-effectiveness and scalability. Projected market size for 2033: xx Million
By Application:
Optoelectronics and Optical Components: This segment will analyze the leading application area, examining the market size and growth drivers for quantum dot displays in optoelectronics and optical components. Factors like increased demand for advanced display technologies will be discussed. Projected market size for 2033: xx Million
Medicine: We'll delve into the medical applications of quantum dots, their market size, and drivers. This includes discussions of imaging, diagnostics, and therapeutics. Projected market size for 2033: xx Million
Agriculture: This section will detail the emerging use of quantum dots in agriculture and their market potential. Factors like improved crop yields and sustainable farming will be addressed. Projected market size for 2033: xx Million
Alternative Energy: We will explore the potential for quantum dots in solar cells and other alternative energy technologies, focusing on efficiency improvements and cost reductions. Projected market size for 2033: xx Million
Other Applications: We'll briefly analyze the minor applications for quantum dots and estimate their collective market size. Projected market size for 2033: xx Million
Quantum Dot Display Market Product Developments
Recent advancements in quantum dot technology have led to significant improvements in display performance, including enhanced color accuracy, wider color gamut, and improved energy efficiency. This has resulted in a surge in the adoption of quantum dot displays across various applications. The ongoing research and development efforts focusing on optimizing quantum dot materials and manufacturing processes are expected to drive further innovation and expand market opportunities. This includes the development of new materials with improved stability and higher performance. Competition among manufacturers is fostering rapid innovation.
Report Scope & Segmentation Analysis
This report provides a comprehensive analysis of the global quantum dot display market, segmented by type (III-V-Semiconductors, II-VI-Semiconductors, Silicon (Si)) and application (Optoelectronics and Optical Components, Medicine, Agriculture, Alternative Energy, Other Applications). Each segment's market size, growth projections, and competitive dynamics are analyzed in detail, offering a clear picture of the market's structure and future potential. Detailed analysis of each segment includes competitive assessments, identifying key players and their market strategies.
Key Drivers of Quantum Dot Display Market Growth
Several factors contribute to the growth of the Quantum Dot Display Market. These include the increasing demand for high-quality displays with improved color accuracy and wider color gamut in consumer electronics, the continuous advancements in quantum dot materials and manufacturing technologies leading to cost reductions and performance improvements, and supportive government policies and funding initiatives that encourage the development and adoption of this technology. The growing adoption of quantum dots in medical imaging, agricultural technologies, and alternative energy solutions will also drive market growth.
Challenges in the Quantum Dot Display Market Sector
Despite significant growth potential, the Quantum Dot Display Market faces certain challenges. These include the high manufacturing cost of quantum dots, the need for continuous improvements in the stability and durability of the materials, and potential environmental concerns related to the use of certain quantum dot materials. Competitive pressures from other display technologies, like OLED and MicroLED, also pose a threat to market growth. Furthermore, the complexities of the supply chain and potential material shortages can impact manufacturing and market availability.
Emerging Opportunities in Quantum Dot Display Market
Emerging opportunities exist in the Quantum Dot Display Market, including the development of new applications for quantum dots in areas such as bio-imaging and sensing, the potential for integration of quantum dots with other display technologies to create hybrid displays with enhanced functionality, and the increasing demand for high-performance displays in various emerging markets, including automotive, wearables and augmented/virtual reality. New materials with enhanced characteristics are expected to open up additional applications and improve cost-effectiveness.
Leading Players in the Quantum Dot Display Market Market
- Nanoco Group PLC
- Quantum Solutions Inc
- Merck KGaA
- Quantum Materials Corporation
- Ocean NanoTech
- Thermo Fisher Scientific Inc
- NnCrystal US Corporation (NN-Labs)
- UbiQD Inc
- Nanosys Inc (Shoei Electronic Materials Inc)
- NanoOptical Materials Inc
Key Developments in Quantum Dot Display Market Industry
- November 2023: UbiQD Inc. announced UbiGro Cover, enhancing greenhouse productivity.
- January 2024: Quantum Solutions launched QDot Perovskite CsPbBr3 Single Crystals for X-ray sensors, collaborating with AY Sensors. This offers a superior alternative to CdTe and CZT crystals in direct X-ray sensors.
Strategic Outlook for Quantum Dot Display Market Market
The future of the Quantum Dot Display Market is promising, driven by ongoing technological advancements, increasing demand for high-quality displays, and expanding applications across diverse sectors. Continuous innovation in materials science and manufacturing processes will further reduce costs and improve performance, leading to wider adoption and market expansion. Strategic partnerships and M&A activities will continue to shape the competitive landscape, leading to further consolidation and innovation in this rapidly developing market. The market is poised for robust growth, driven by several factors that are projected to translate to significant revenue generation in the coming decade.
Quantum Dot Display Market Segmentation
-
1. Type
- 1.1. III-V-Semiconductors
- 1.2. II-VI-Semiconductors
- 1.3. Silicon (Si)
-
2. Application
- 2.1. Optoelectronics and Optical Components
- 2.2. Medicine
- 2.3. Agriculture
- 2.4. Alternative Energy
- 2.5. Other Applications
Quantum Dot Display Market Segmentation By Geography
-
1. North America
- 1.1. United States
- 1.2. Canada
-
2. Europe
- 2.1. United Kingdom
- 2.2. Germany
- 2.3. France
-
3. Asia
- 3.1. China
- 3.2. Japan
- 3.3. India
- 3.4. Australia and New Zealand
Quantum Dot Display Market REPORT HIGHLIGHTS
| Aspects | Details |
|---|---|
| Study Period | 2019-2033 |
| Base Year | 2024 |
| Estimated Year | 2025 |
| Forecast Period | 2025-2033 |
| Historical Period | 2019-2024 |
| Growth Rate | CAGR of 17.40% from 2019-2033 |
| Segmentation |
|
Table of Contents
- 1. Introduction
- 1.1. Research Scope
- 1.2. Market Segmentation
- 1.3. Research Methodology
- 1.4. Definitions and Assumptions
- 2. Executive Summary
- 2.1. Introduction
- 3. Market Dynamics
- 3.1. Introduction
- 3.2. Market Drivers
- 3.2.1. Increasing Demand for Quantum Dots in High-Quality Display Devices; Growing Demand for Energy-efficient Solutions
- 3.3. Market Restrains
- 3.3.1. Complexity Associated with the 3D Electronics and Limited Material Selection
- 3.4. Market Trends
- 3.4.1. Optoelectronics and Optical Components to Witness Significant Growth
- 4. Market Factor Analysis
- 4.1. Porters Five Forces
- 4.2. Supply/Value Chain
- 4.3. PESTEL analysis
- 4.4. Market Entropy
- 4.5. Patent/Trademark Analysis
- 5. Global Quantum Dot Display Market Analysis, Insights and Forecast, 2019-2031
- 5.1. Market Analysis, Insights and Forecast - by Type
- 5.1.1. III-V-Semiconductors
- 5.1.2. II-VI-Semiconductors
- 5.1.3. Silicon (Si)
- 5.2. Market Analysis, Insights and Forecast - by Application
- 5.2.1. Optoelectronics and Optical Components
- 5.2.2. Medicine
- 5.2.3. Agriculture
- 5.2.4. Alternative Energy
- 5.2.5. Other Applications
- 5.3. Market Analysis, Insights and Forecast - by Region
- 5.3.1. North America
- 5.3.2. Europe
- 5.3.3. Asia
- 5.1. Market Analysis, Insights and Forecast - by Type
- 6. North America Quantum Dot Display Market Analysis, Insights and Forecast, 2019-2031
- 6.1. Market Analysis, Insights and Forecast - by Type
- 6.1.1. III-V-Semiconductors
- 6.1.2. II-VI-Semiconductors
- 6.1.3. Silicon (Si)
- 6.2. Market Analysis, Insights and Forecast - by Application
- 6.2.1. Optoelectronics and Optical Components
- 6.2.2. Medicine
- 6.2.3. Agriculture
- 6.2.4. Alternative Energy
- 6.2.5. Other Applications
- 6.1. Market Analysis, Insights and Forecast - by Type
- 7. Europe Quantum Dot Display Market Analysis, Insights and Forecast, 2019-2031
- 7.1. Market Analysis, Insights and Forecast - by Type
- 7.1.1. III-V-Semiconductors
- 7.1.2. II-VI-Semiconductors
- 7.1.3. Silicon (Si)
- 7.2. Market Analysis, Insights and Forecast - by Application
- 7.2.1. Optoelectronics and Optical Components
- 7.2.2. Medicine
- 7.2.3. Agriculture
- 7.2.4. Alternative Energy
- 7.2.5. Other Applications
- 7.1. Market Analysis, Insights and Forecast - by Type
- 8. Asia Quantum Dot Display Market Analysis, Insights and Forecast, 2019-2031
- 8.1. Market Analysis, Insights and Forecast - by Type
- 8.1.1. III-V-Semiconductors
- 8.1.2. II-VI-Semiconductors
- 8.1.3. Silicon (Si)
- 8.2. Market Analysis, Insights and Forecast - by Application
- 8.2.1. Optoelectronics and Optical Components
- 8.2.2. Medicine
- 8.2.3. Agriculture
- 8.2.4. Alternative Energy
- 8.2.5. Other Applications
- 8.1. Market Analysis, Insights and Forecast - by Type
- 9. North America Quantum Dot Display Market Analysis, Insights and Forecast, 2019-2031
- 9.1. Market Analysis, Insights and Forecast - By Country/Sub-region
- 9.1.1 United States
- 9.1.2 Canada
- 10. Europe Quantum Dot Display Market Analysis, Insights and Forecast, 2019-2031
- 10.1. Market Analysis, Insights and Forecast - By Country/Sub-region
- 10.1.1 United Kingdom
- 10.1.2 Germany
- 10.1.3 France
- 11. Asia Quantum Dot Display Market Analysis, Insights and Forecast, 2019-2031
- 11.1. Market Analysis, Insights and Forecast - By Country/Sub-region
- 11.1.1 China
- 11.1.2 Japan
- 11.1.3 India
- 11.1.4 Australia and New Zealand
- 12. Competitive Analysis
- 12.1. Global Market Share Analysis 2024
- 12.2. Company Profiles
- 12.2.1 Nanoco Group PLC
- 12.2.1.1. Overview
- 12.2.1.2. Products
- 12.2.1.3. SWOT Analysis
- 12.2.1.4. Recent Developments
- 12.2.1.5. Financials (Based on Availability)
- 12.2.2 Quantum Solutions Inc
- 12.2.2.1. Overview
- 12.2.2.2. Products
- 12.2.2.3. SWOT Analysis
- 12.2.2.4. Recent Developments
- 12.2.2.5. Financials (Based on Availability)
- 12.2.3 Merck KGaA
- 12.2.3.1. Overview
- 12.2.3.2. Products
- 12.2.3.3. SWOT Analysis
- 12.2.3.4. Recent Developments
- 12.2.3.5. Financials (Based on Availability)
- 12.2.4 Quantum Materials Corporation
- 12.2.4.1. Overview
- 12.2.4.2. Products
- 12.2.4.3. SWOT Analysis
- 12.2.4.4. Recent Developments
- 12.2.4.5. Financials (Based on Availability)
- 12.2.5 Ocean NanoTech
- 12.2.5.1. Overview
- 12.2.5.2. Products
- 12.2.5.3. SWOT Analysis
- 12.2.5.4. Recent Developments
- 12.2.5.5. Financials (Based on Availability)
- 12.2.6 Thermo Fisher Scientific Inc
- 12.2.6.1. Overview
- 12.2.6.2. Products
- 12.2.6.3. SWOT Analysis
- 12.2.6.4. Recent Developments
- 12.2.6.5. Financials (Based on Availability)
- 12.2.7 NnCrystal US Corporation (NN-Labs)
- 12.2.7.1. Overview
- 12.2.7.2. Products
- 12.2.7.3. SWOT Analysis
- 12.2.7.4. Recent Developments
- 12.2.7.5. Financials (Based on Availability)
- 12.2.8 UbiQD Inc
- 12.2.8.1. Overview
- 12.2.8.2. Products
- 12.2.8.3. SWOT Analysis
- 12.2.8.4. Recent Developments
- 12.2.8.5. Financials (Based on Availability)
- 12.2.9 Nanosys Inc (Shoei Electronic Materials Inc)
- 12.2.9.1. Overview
- 12.2.9.2. Products
- 12.2.9.3. SWOT Analysis
- 12.2.9.4. Recent Developments
- 12.2.9.5. Financials (Based on Availability)
- 12.2.10 NanoOptical Materials Inc
- 12.2.10.1. Overview
- 12.2.10.2. Products
- 12.2.10.3. SWOT Analysis
- 12.2.10.4. Recent Developments
- 12.2.10.5. Financials (Based on Availability)
- 12.2.1 Nanoco Group PLC
List of Figures
- Figure 1: Global Quantum Dot Display Market Revenue Breakdown (Million, %) by Region 2024 & 2032
- Figure 2: North America Quantum Dot Display Market Revenue (Million), by Country 2024 & 2032
- Figure 3: North America Quantum Dot Display Market Revenue Share (%), by Country 2024 & 2032
- Figure 4: Europe Quantum Dot Display Market Revenue (Million), by Country 2024 & 2032
- Figure 5: Europe Quantum Dot Display Market Revenue Share (%), by Country 2024 & 2032
- Figure 6: Asia Quantum Dot Display Market Revenue (Million), by Country 2024 & 2032
- Figure 7: Asia Quantum Dot Display Market Revenue Share (%), by Country 2024 & 2032
- Figure 8: North America Quantum Dot Display Market Revenue (Million), by Type 2024 & 2032
- Figure 9: North America Quantum Dot Display Market Revenue Share (%), by Type 2024 & 2032
- Figure 10: North America Quantum Dot Display Market Revenue (Million), by Application 2024 & 2032
- Figure 11: North America Quantum Dot Display Market Revenue Share (%), by Application 2024 & 2032
- Figure 12: North America Quantum Dot Display Market Revenue (Million), by Country 2024 & 2032
- Figure 13: North America Quantum Dot Display Market Revenue Share (%), by Country 2024 & 2032
- Figure 14: Europe Quantum Dot Display Market Revenue (Million), by Type 2024 & 2032
- Figure 15: Europe Quantum Dot Display Market Revenue Share (%), by Type 2024 & 2032
- Figure 16: Europe Quantum Dot Display Market Revenue (Million), by Application 2024 & 2032
- Figure 17: Europe Quantum Dot Display Market Revenue Share (%), by Application 2024 & 2032
- Figure 18: Europe Quantum Dot Display Market Revenue (Million), by Country 2024 & 2032
- Figure 19: Europe Quantum Dot Display Market Revenue Share (%), by Country 2024 & 2032
- Figure 20: Asia Quantum Dot Display Market Revenue (Million), by Type 2024 & 2032
- Figure 21: Asia Quantum Dot Display Market Revenue Share (%), by Type 2024 & 2032
- Figure 22: Asia Quantum Dot Display Market Revenue (Million), by Application 2024 & 2032
- Figure 23: Asia Quantum Dot Display Market Revenue Share (%), by Application 2024 & 2032
- Figure 24: Asia Quantum Dot Display Market Revenue (Million), by Country 2024 & 2032
- Figure 25: Asia Quantum Dot Display Market Revenue Share (%), by Country 2024 & 2032
List of Tables
- Table 1: Global Quantum Dot Display Market Revenue Million Forecast, by Region 2019 & 2032
- Table 2: Global Quantum Dot Display Market Revenue Million Forecast, by Type 2019 & 2032
- Table 3: Global Quantum Dot Display Market Revenue Million Forecast, by Application 2019 & 2032
- Table 4: Global Quantum Dot Display Market Revenue Million Forecast, by Region 2019 & 2032
- Table 5: Global Quantum Dot Display Market Revenue Million Forecast, by Country 2019 & 2032
- Table 6: United States Quantum Dot Display Market Revenue (Million) Forecast, by Application 2019 & 2032
- Table 7: Canada Quantum Dot Display Market Revenue (Million) Forecast, by Application 2019 & 2032
- Table 8: Global Quantum Dot Display Market Revenue Million Forecast, by Country 2019 & 2032
- Table 9: United Kingdom Quantum Dot Display Market Revenue (Million) Forecast, by Application 2019 & 2032
- Table 10: Germany Quantum Dot Display Market Revenue (Million) Forecast, by Application 2019 & 2032
- Table 11: France Quantum Dot Display Market Revenue (Million) Forecast, by Application 2019 & 2032
- Table 12: Global Quantum Dot Display Market Revenue Million Forecast, by Country 2019 & 2032
- Table 13: China Quantum Dot Display Market Revenue (Million) Forecast, by Application 2019 & 2032
- Table 14: Japan Quantum Dot Display Market Revenue (Million) Forecast, by Application 2019 & 2032
- Table 15: India Quantum Dot Display Market Revenue (Million) Forecast, by Application 2019 & 2032
- Table 16: Australia and New Zealand Quantum Dot Display Market Revenue (Million) Forecast, by Application 2019 & 2032
- Table 17: Global Quantum Dot Display Market Revenue Million Forecast, by Type 2019 & 2032
- Table 18: Global Quantum Dot Display Market Revenue Million Forecast, by Application 2019 & 2032
- Table 19: Global Quantum Dot Display Market Revenue Million Forecast, by Country 2019 & 2032
- Table 20: United States Quantum Dot Display Market Revenue (Million) Forecast, by Application 2019 & 2032
- Table 21: Canada Quantum Dot Display Market Revenue (Million) Forecast, by Application 2019 & 2032
- Table 22: Global Quantum Dot Display Market Revenue Million Forecast, by Type 2019 & 2032
- Table 23: Global Quantum Dot Display Market Revenue Million Forecast, by Application 2019 & 2032
- Table 24: Global Quantum Dot Display Market Revenue Million Forecast, by Country 2019 & 2032
- Table 25: United Kingdom Quantum Dot Display Market Revenue (Million) Forecast, by Application 2019 & 2032
- Table 26: Germany Quantum Dot Display Market Revenue (Million) Forecast, by Application 2019 & 2032
- Table 27: France Quantum Dot Display Market Revenue (Million) Forecast, by Application 2019 & 2032
- Table 28: Global Quantum Dot Display Market Revenue Million Forecast, by Type 2019 & 2032
- Table 29: Global Quantum Dot Display Market Revenue Million Forecast, by Application 2019 & 2032
- Table 30: Global Quantum Dot Display Market Revenue Million Forecast, by Country 2019 & 2032
- Table 31: China Quantum Dot Display Market Revenue (Million) Forecast, by Application 2019 & 2032
- Table 32: Japan Quantum Dot Display Market Revenue (Million) Forecast, by Application 2019 & 2032
- Table 33: India Quantum Dot Display Market Revenue (Million) Forecast, by Application 2019 & 2032
- Table 34: Australia and New Zealand Quantum Dot Display Market Revenue (Million) Forecast, by Application 2019 & 2032
Frequently Asked Questions
1. What is the projected Compound Annual Growth Rate (CAGR) of the Quantum Dot Display Market?
The projected CAGR is approximately 17.40%.
2. Which companies are prominent players in the Quantum Dot Display Market?
Key companies in the market include Nanoco Group PLC, Quantum Solutions Inc, Merck KGaA, Quantum Materials Corporation, Ocean NanoTech, Thermo Fisher Scientific Inc, NnCrystal US Corporation (NN-Labs), UbiQD Inc, Nanosys Inc (Shoei Electronic Materials Inc), NanoOptical Materials Inc.
3. What are the main segments of the Quantum Dot Display Market?
The market segments include Type, Application.
4. Can you provide details about the market size?
The market size is estimated to be USD 5.53 Million as of 2022.
5. What are some drivers contributing to market growth?
Increasing Demand for Quantum Dots in High-Quality Display Devices; Growing Demand for Energy-efficient Solutions.
6. What are the notable trends driving market growth?
Optoelectronics and Optical Components to Witness Significant Growth.
7. Are there any restraints impacting market growth?
Complexity Associated with the 3D Electronics and Limited Material Selection.
8. Can you provide examples of recent developments in the market?
January 2024 - Quantum Solutions announced the release of QDot Perovskite CsPbBr3 Single Crystals for X-ray sensors. The product is released in collaboration with AY Sensors. This material is a significant alternative to CdTe and CdZnTe (CZT) crystals used in direct X-ray sensors. CsPbBr3 single crystals are regarded as the most favorable perovskite composition for X-ray sensors in terms of performance and long-term stability.
9. What pricing options are available for accessing the report?
Pricing options include single-user, multi-user, and enterprise licenses priced at USD 4750, USD 5250, and USD 8750 respectively.
10. Is the market size provided in terms of value or volume?
The market size is provided in terms of value, measured in Million.
11. Are there any specific market keywords associated with the report?
Yes, the market keyword associated with the report is "Quantum Dot Display Market," which aids in identifying and referencing the specific market segment covered.
12. How do I determine which pricing option suits my needs best?
The pricing options vary based on user requirements and access needs. Individual users may opt for single-user licenses, while businesses requiring broader access may choose multi-user or enterprise licenses for cost-effective access to the report.
13. Are there any additional resources or data provided in the Quantum Dot Display Market report?
While the report offers comprehensive insights, it's advisable to review the specific contents or supplementary materials provided to ascertain if additional resources or data are available.
14. How can I stay updated on further developments or reports in the Quantum Dot Display Market?
To stay informed about further developments, trends, and reports in the Quantum Dot Display Market, consider subscribing to industry newsletters, following relevant companies and organizations, or regularly checking reputable industry news sources and publications.
Methodology
Step 1 - Identification of Relevant Samples Size from Population Database


Step 2 - Approaches for Defining Global Market Size (Value, Volume* & Price*)

Note*: In applicable scenarios
Step 3 - Data Sources
Primary Research
- Web Analytics
- Survey Reports
- Research Institute
- Latest Research Reports
- Opinion Leaders
Secondary Research
- Annual Reports
- White Paper
- Latest Press Release
- Industry Association
- Paid Database
- Investor Presentations

Step 4 - Data Triangulation
Involves using different sources of information in order to increase the validity of a study
These sources are likely to be stakeholders in a program - participants, other researchers, program staff, other community members, and so on.
Then we put all data in single framework & apply various statistical tools to find out the dynamic on the market.
During the analysis stage, feedback from the stakeholder groups would be compared to determine areas of agreement as well as areas of divergence


