
Key Insights
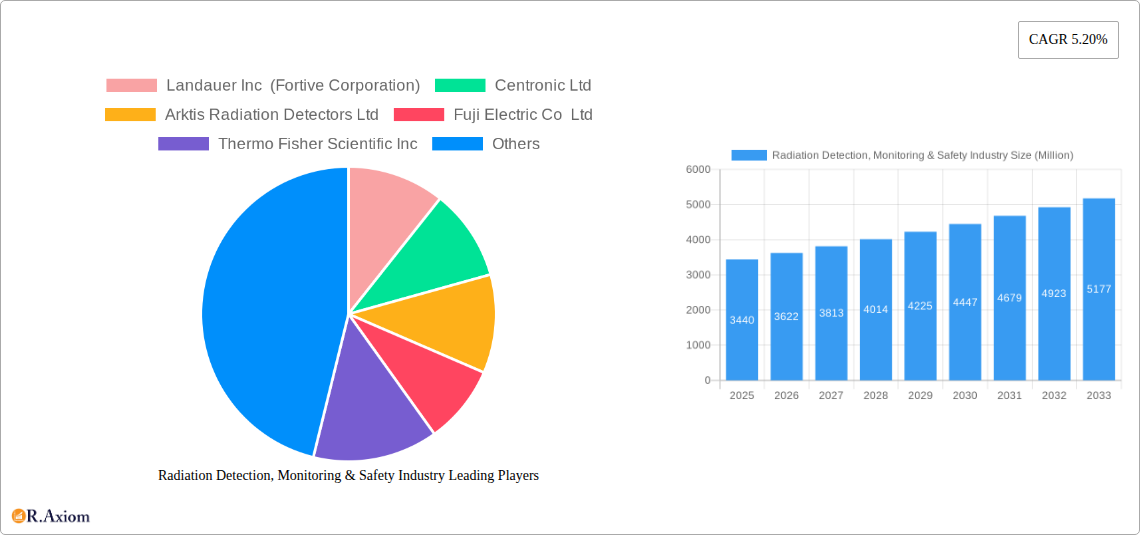
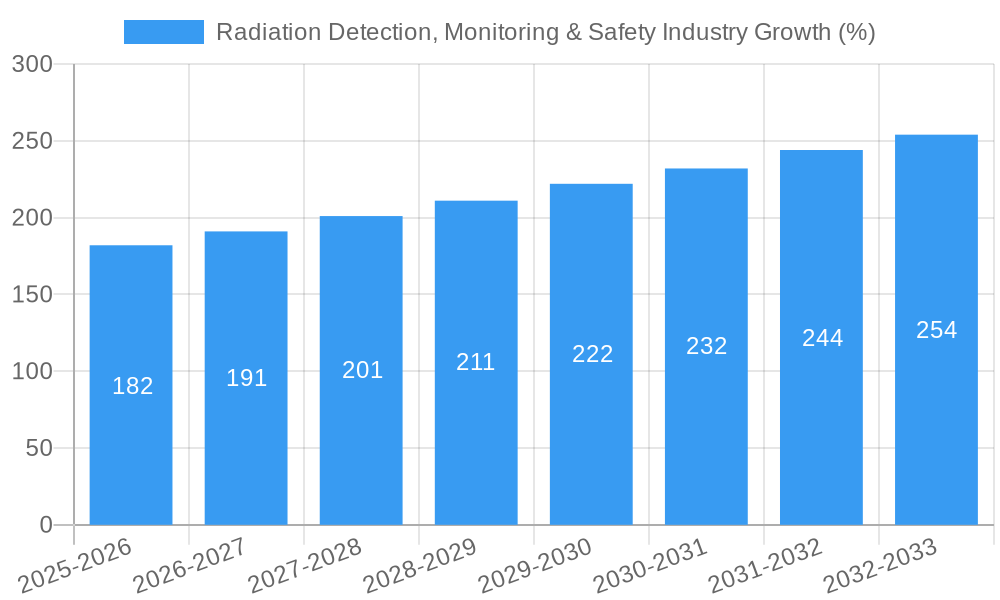
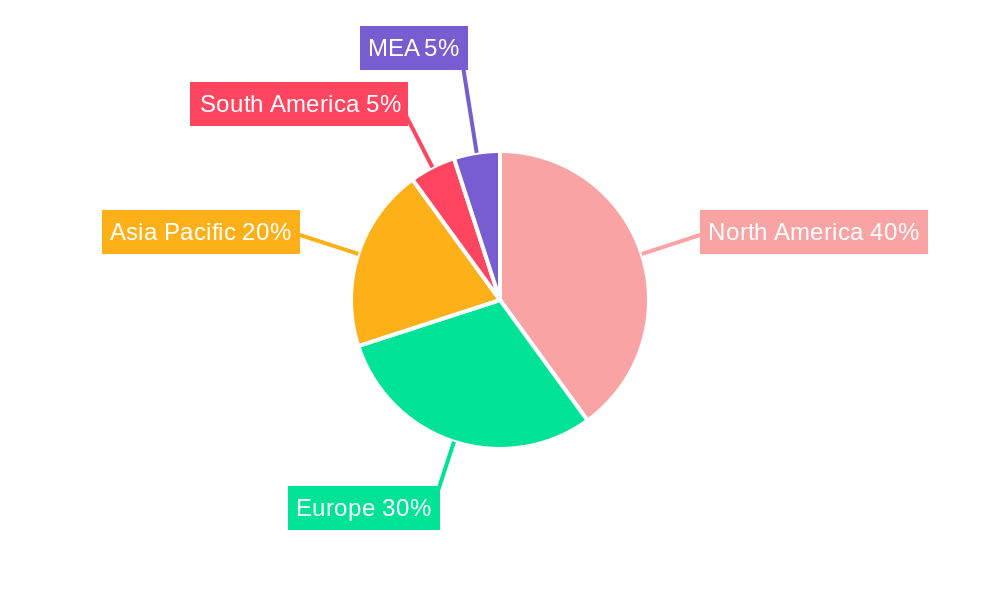
The Radiation Detection, Monitoring & Safety market is experiencing robust growth, projected to reach a substantial size driven by increasing concerns regarding nuclear security, advancements in medical imaging technology, and the expanding industrial sector's need for safety protocols. The market's Compound Annual Growth Rate (CAGR) of 5.20% from 2019-2033 indicates a consistent upward trajectory. Key segments driving this growth include the detection and monitoring product type, heavily utilized in medical and healthcare, industrial, and homeland security applications. The North American region currently holds a significant market share, largely due to the advanced technological infrastructure and stringent safety regulations in the United States and Canada. However, the Asia-Pacific region is poised for significant growth fueled by rapid industrialization and increasing government investments in radiation safety. The presence of established players like Fortive Corporation (Landauer Inc.), Thermo Fisher Scientific Inc., and Mirion Technologies Inc., alongside emerging companies, indicates a competitive yet dynamic market landscape. Factors such as increasing regulatory compliance requirements and the rising adoption of sophisticated radiation detection technologies contribute to market expansion. Conversely, high initial investment costs for advanced equipment and potential limitations in technological advancements in certain regions could present challenges.
Further analysis reveals a strong correlation between market growth and technological innovation. The development of more portable, user-friendly, and cost-effective radiation detection devices is a major contributing factor. Moreover, the increasing use of radiation in various industries necessitates robust monitoring and safety measures, bolstering market demand. The ongoing development of advanced sensors, data analytics, and cloud-based platforms for radiation detection and safety management are likely to further enhance market growth in the coming years. While challenges remain, including the need for skilled professionals to operate and maintain sophisticated equipment, the overall outlook for the Radiation Detection, Monitoring & Safety market remains positive, promising substantial expansion throughout the forecast period. The competitive landscape is expected to remain dynamic, with both established players and innovative entrants vying for market share.
Radiation Detection, Monitoring & Safety Industry Market Report: 2019-2033
This comprehensive report provides a detailed analysis of the Radiation Detection, Monitoring & Safety industry, offering invaluable insights for stakeholders, investors, and industry professionals. Covering the period 2019-2033, with a base year of 2025 and a forecast period of 2025-2033, this report meticulously examines market trends, competitive landscapes, and future growth opportunities. The global market size is estimated at $xx Million in 2025 and is projected to reach $xx Million by 2033, exhibiting a CAGR of xx% during the forecast period.
Radiation Detection, Monitoring & Safety Industry Market Concentration & Innovation
The Radiation Detection, Monitoring & Safety industry exhibits a moderately concentrated market structure, with several key players holding significant market share. While precise market share data for each company requires further detailed research, companies like Fortive Corporation (Landauer Inc.), Thermo Fisher Scientific Inc and Ametek Inc (ORTEC) are recognized as major players. Market concentration is influenced by factors including technological advancements, regulatory compliance, and economies of scale.
Innovation Drivers:
- Technological advancements: Continuous improvements in sensor technology, data analytics, and miniaturization are driving innovation.
- Regulatory compliance: Stringent safety regulations across various end-user industries are pushing the adoption of advanced detection and monitoring systems.
- Emerging applications: Expanding applications in homeland security, nuclear medicine, and industrial settings are fueling demand for specialized solutions.
M&A Activities: The industry has witnessed several mergers and acquisitions in recent years, with deal values ranging from $xx Million to $xx Million. These activities aim to expand market reach, enhance technological capabilities, and strengthen competitive positions. Further research is needed to determine the precise number and value of these transactions.
Product Substitutes: While direct substitutes are limited, advancements in alternative technologies (e.g., AI-powered anomaly detection) could pose a competitive challenge in the long term.
End-User Trends: The growing awareness of radiation safety and the increasing demand for sophisticated monitoring solutions across various sectors like healthcare and energy are key end-user trends impacting industry growth.
Radiation Detection, Monitoring & Safety Industry Industry Trends & Insights
The Radiation Detection, Monitoring & Safety industry is witnessing robust growth driven by several key factors. Increasing regulatory scrutiny, rising awareness of radiation safety risks across industries (particularly nuclear power, healthcare and defense), and technological advancements in detection and monitoring systems are the primary drivers. The market is experiencing a significant shift towards advanced technologies such as AI-powered systems and real-time monitoring solutions, enhancing accuracy, speed, and efficiency. This is further fueled by the integration of cloud computing and IoT technologies which enables remote monitoring and data analysis capabilities. Consumer preferences are shifting towards user-friendly, portable, and highly sensitive devices. The competitive landscape is characterized by both established players and emerging companies introducing innovative solutions. The market exhibits a high degree of fragmentation, with many specialized companies catering to niche segments. This results in a competitive landscape characterized by continuous innovation and strategic partnerships.
Dominant Markets & Segments in Radiation Detection, Monitoring & Safety Industry
The North American market currently holds a dominant position in the Radiation Detection, Monitoring & Safety industry, driven by robust government spending on defense and homeland security, along with stringent regulatory environments promoting radiation safety. Europe and Asia Pacific follow, with significant growth potential in developing economies.
Dominant Segments:
- Product Type: The Detection and Monitoring segment dominates, driven by high demand for advanced radiation detection instruments across various sectors. The Safety segment is experiencing substantial growth, fueled by stricter safety regulations and rising concerns over radiation-related health risks.
- End-user Industry: The Medical and Healthcare sector represents a significant market, owing to the widespread use of radiation in diagnostic and therapeutic procedures. The Industrial sector is another significant contributor, with ongoing efforts to enhance safety in industrial settings handling radioactive materials. The Homeland Security and Defense segment demonstrates strong growth, driven by government initiatives to improve radiation detection capabilities. The Energy and Power segment, driven by nuclear power generation, remains a significant application for radiation detection and safety equipment.
Key Drivers by Segment:
- Medical and Healthcare: Increased adoption of nuclear medicine procedures and growing emphasis on radiation safety protocols.
- Industrial: Stringent safety regulations and growing awareness of radiation risks in industrial processes.
- Homeland Security and Defense: Increased government spending on security technologies and counter-terrorism measures.
- Energy and Power: Reliance on nuclear power and stringent regulations governing nuclear waste management.
Radiation Detection, Monitoring & Safety Industry Product Developments
Recent product innovations focus on enhancing portability, sensitivity, and data analysis capabilities. Miniaturized detectors, advanced algorithms for data interpretation, and integration with cloud platforms are prominent trends. These innovations cater to the growing need for real-time monitoring, remote accessibility, and improved user experience across diverse applications.
Report Scope & Segmentation Analysis
This report segments the Radiation Detection, Monitoring & Safety industry by:
Product Type: Detection and Monitoring, Safety. The Detection and Monitoring segment is projected to witness significant growth due to increasing demand for advanced monitoring systems in various applications. The Safety segment is expected to showcase steady growth driven by heightened safety regulations and risk aversion.
End-user Industry: Medical and Healthcare, Industrial, Homeland Security and Defense, Energy and Power, Other End-user Industries. The Medical and Healthcare segment is anticipated to be a major revenue generator due to the widespread use of radiation in healthcare. The Industrial and Homeland Security & Defense segments demonstrate promising growth prospects driven by safety regulations and security concerns.
Key Drivers of Radiation Detection, Monitoring & Safety Industry Growth
Several factors fuel market growth: Stringent government regulations on radiation safety across diverse industries, growing awareness of potential health hazards associated with radiation exposure, technological advancements leading to more accurate, sensitive, and portable detection systems, and the expanding application of radiation in healthcare and industrial settings all contribute.
Challenges in the Radiation Detection, Monitoring & Safety Industry Sector
Challenges include stringent regulatory compliance requirements, the high cost of advanced equipment, the need for skilled professionals for operation and maintenance, and potential supply chain disruptions impacting the availability of critical components. These factors can limit market growth and penetration.
Emerging Opportunities in Radiation Detection, Monitoring & Safety Industry
Emerging opportunities lie in the development of AI-powered radiation detection systems, miniaturized and portable detectors, advanced data analytics for real-time monitoring and risk assessment, and expansion into new applications, such as environmental monitoring and industrial process control.
Leading Players in the Radiation Detection, Monitoring & Safety Industry Market
- Landauer Inc (Fortive Corporation)
- Centronic Ltd
- Arktis Radiation Detectors Ltd
- Fuji Electric Co Ltd
- Thermo Fisher Scientific Inc
- Amray Group Limited
- ORTEC (Ametek Inc)
- Mirion Technologies Inc
- Burlington Medical LLC
- ATOMTEX SP
- Radiation Detection Company
- Teledyne FLIR Systems Inc
- RAE Systems Inc (Honeywell International Inc)
- Unfors RaySafe AB
Key Developments in Radiation Detection, Monitoring & Safety Industry Industry
- October 2023: Honeywell launched the infrared-based FS24X Plus Flame Detector, enhancing safety in hydrogen-related industries.
- January 2024: The US military upgraded its radiation detection equipment with the modular Radiological Detection System by D-Tect Systems (Ludlum), replacing outdated models. This highlights the ongoing need for advanced and adaptable radiation detection technology in critical sectors.
Strategic Outlook for Radiation Detection, Monitoring & Safety Industry Market
The Radiation Detection, Monitoring & Safety industry is poised for continued growth driven by technological advancements, stringent regulations, and the increasing need for radiation safety across diverse sectors. The focus on miniaturization, improved sensitivity, real-time monitoring, and advanced data analytics will shape the future of the market, presenting numerous opportunities for innovation and expansion.
Radiation Detection, Monitoring & Safety Industry Segmentation
-
1. Product Type
- 1.1. Detection and Monitoring
- 1.2. Safety
-
2. End-user Industry
- 2.1. Medical and Healthcare
- 2.2. Industrial
- 2.3. Homeland Security and Defense
- 2.4. Energy and Power
- 2.5. Other End-user Industries
Radiation Detection, Monitoring & Safety Industry Segmentation By Geography
- 1. North America
- 2. Europe
- 3. Asia
- 4. Australia and New Zealand
- 5. Latin America
- 6. Middle East and Africa
Radiation Detection, Monitoring & Safety Industry REPORT HIGHLIGHTS
| Aspects | Details |
|---|---|
| Study Period | 2019-2033 |
| Base Year | 2024 |
| Estimated Year | 2025 |
| Forecast Period | 2025-2033 |
| Historical Period | 2019-2024 |
| Growth Rate | CAGR of 5.20% from 2019-2033 |
| Segmentation |
|
Table of Contents
- 1. Introduction
- 1.1. Research Scope
- 1.2. Market Segmentation
- 1.3. Research Methodology
- 1.4. Definitions and Assumptions
- 2. Executive Summary
- 2.1. Introduction
- 3. Market Dynamics
- 3.1. Introduction
- 3.2. Market Drivers
- 3.2.1. Increasing Incidence of Cancer and Other Chronic Diseases; Growing Use of Drones for Radiation Monitoring
- 3.3. Market Restrains
- 3.3.1. Stringent Government Regulations; Lack of Skilled Radiation Professionals
- 3.4. Market Trends
- 3.4.1. Medical and Healthcare Industry to be the Largest End User
- 4. Market Factor Analysis
- 4.1. Porters Five Forces
- 4.2. Supply/Value Chain
- 4.3. PESTEL analysis
- 4.4. Market Entropy
- 4.5. Patent/Trademark Analysis
- 5. Global Radiation Detection, Monitoring & Safety Industry Analysis, Insights and Forecast, 2019-2031
- 5.1. Market Analysis, Insights and Forecast - by Product Type
- 5.1.1. Detection and Monitoring
- 5.1.2. Safety
- 5.2. Market Analysis, Insights and Forecast - by End-user Industry
- 5.2.1. Medical and Healthcare
- 5.2.2. Industrial
- 5.2.3. Homeland Security and Defense
- 5.2.4. Energy and Power
- 5.2.5. Other End-user Industries
- 5.3. Market Analysis, Insights and Forecast - by Region
- 5.3.1. North America
- 5.3.2. Europe
- 5.3.3. Asia
- 5.3.4. Australia and New Zealand
- 5.3.5. Latin America
- 5.3.6. Middle East and Africa
- 5.1. Market Analysis, Insights and Forecast - by Product Type
- 6. North America Radiation Detection, Monitoring & Safety Industry Analysis, Insights and Forecast, 2019-2031
- 6.1. Market Analysis, Insights and Forecast - by Product Type
- 6.1.1. Detection and Monitoring
- 6.1.2. Safety
- 6.2. Market Analysis, Insights and Forecast - by End-user Industry
- 6.2.1. Medical and Healthcare
- 6.2.2. Industrial
- 6.2.3. Homeland Security and Defense
- 6.2.4. Energy and Power
- 6.2.5. Other End-user Industries
- 6.1. Market Analysis, Insights and Forecast - by Product Type
- 7. Europe Radiation Detection, Monitoring & Safety Industry Analysis, Insights and Forecast, 2019-2031
- 7.1. Market Analysis, Insights and Forecast - by Product Type
- 7.1.1. Detection and Monitoring
- 7.1.2. Safety
- 7.2. Market Analysis, Insights and Forecast - by End-user Industry
- 7.2.1. Medical and Healthcare
- 7.2.2. Industrial
- 7.2.3. Homeland Security and Defense
- 7.2.4. Energy and Power
- 7.2.5. Other End-user Industries
- 7.1. Market Analysis, Insights and Forecast - by Product Type
- 8. Asia Radiation Detection, Monitoring & Safety Industry Analysis, Insights and Forecast, 2019-2031
- 8.1. Market Analysis, Insights and Forecast - by Product Type
- 8.1.1. Detection and Monitoring
- 8.1.2. Safety
- 8.2. Market Analysis, Insights and Forecast - by End-user Industry
- 8.2.1. Medical and Healthcare
- 8.2.2. Industrial
- 8.2.3. Homeland Security and Defense
- 8.2.4. Energy and Power
- 8.2.5. Other End-user Industries
- 8.1. Market Analysis, Insights and Forecast - by Product Type
- 9. Australia and New Zealand Radiation Detection, Monitoring & Safety Industry Analysis, Insights and Forecast, 2019-2031
- 9.1. Market Analysis, Insights and Forecast - by Product Type
- 9.1.1. Detection and Monitoring
- 9.1.2. Safety
- 9.2. Market Analysis, Insights and Forecast - by End-user Industry
- 9.2.1. Medical and Healthcare
- 9.2.2. Industrial
- 9.2.3. Homeland Security and Defense
- 9.2.4. Energy and Power
- 9.2.5. Other End-user Industries
- 9.1. Market Analysis, Insights and Forecast - by Product Type
- 10. Latin America Radiation Detection, Monitoring & Safety Industry Analysis, Insights and Forecast, 2019-2031
- 10.1. Market Analysis, Insights and Forecast - by Product Type
- 10.1.1. Detection and Monitoring
- 10.1.2. Safety
- 10.2. Market Analysis, Insights and Forecast - by End-user Industry
- 10.2.1. Medical and Healthcare
- 10.2.2. Industrial
- 10.2.3. Homeland Security and Defense
- 10.2.4. Energy and Power
- 10.2.5. Other End-user Industries
- 10.1. Market Analysis, Insights and Forecast - by Product Type
- 11. Middle East and Africa Radiation Detection, Monitoring & Safety Industry Analysis, Insights and Forecast, 2019-2031
- 11.1. Market Analysis, Insights and Forecast - by Product Type
- 11.1.1. Detection and Monitoring
- 11.1.2. Safety
- 11.2. Market Analysis, Insights and Forecast - by End-user Industry
- 11.2.1. Medical and Healthcare
- 11.2.2. Industrial
- 11.2.3. Homeland Security and Defense
- 11.2.4. Energy and Power
- 11.2.5. Other End-user Industries
- 11.1. Market Analysis, Insights and Forecast - by Product Type
- 12. North America Radiation Detection, Monitoring & Safety Industry Analysis, Insights and Forecast, 2019-2031
- 12.1. Market Analysis, Insights and Forecast - By Country/Sub-region
- 12.1.1 United States
- 12.1.2 Canada
- 12.1.3 Mexico
- 13. Europe Radiation Detection, Monitoring & Safety Industry Analysis, Insights and Forecast, 2019-2031
- 13.1. Market Analysis, Insights and Forecast - By Country/Sub-region
- 13.1.1 Germany
- 13.1.2 United Kingdom
- 13.1.3 France
- 13.1.4 Spain
- 13.1.5 Italy
- 13.1.6 Spain
- 13.1.7 Belgium
- 13.1.8 Netherland
- 13.1.9 Nordics
- 13.1.10 Rest of Europe
- 14. Asia Pacific Radiation Detection, Monitoring & Safety Industry Analysis, Insights and Forecast, 2019-2031
- 14.1. Market Analysis, Insights and Forecast - By Country/Sub-region
- 14.1.1 China
- 14.1.2 Japan
- 14.1.3 India
- 14.1.4 South Korea
- 14.1.5 Southeast Asia
- 14.1.6 Australia
- 14.1.7 Indonesia
- 14.1.8 Phillipes
- 14.1.9 Singapore
- 14.1.10 Thailandc
- 14.1.11 Rest of Asia Pacific
- 15. South America Radiation Detection, Monitoring & Safety Industry Analysis, Insights and Forecast, 2019-2031
- 15.1. Market Analysis, Insights and Forecast - By Country/Sub-region
- 15.1.1 Brazil
- 15.1.2 Argentina
- 15.1.3 Peru
- 15.1.4 Chile
- 15.1.5 Colombia
- 15.1.6 Ecuador
- 15.1.7 Venezuela
- 15.1.8 Rest of South America
- 16. MEA Radiation Detection, Monitoring & Safety Industry Analysis, Insights and Forecast, 2019-2031
- 16.1. Market Analysis, Insights and Forecast - By Country/Sub-region
- 16.1.1 United Arab Emirates
- 16.1.2 Saudi Arabia
- 16.1.3 South Africa
- 16.1.4 Rest of Middle East and Africa
- 17. Competitive Analysis
- 17.1. Global Market Share Analysis 2024
- 17.2. Company Profiles
- 17.2.1 Landauer Inc (Fortive Corporation)
- 17.2.1.1. Overview
- 17.2.1.2. Products
- 17.2.1.3. SWOT Analysis
- 17.2.1.4. Recent Developments
- 17.2.1.5. Financials (Based on Availability)
- 17.2.2 Centronic Ltd
- 17.2.2.1. Overview
- 17.2.2.2. Products
- 17.2.2.3. SWOT Analysis
- 17.2.2.4. Recent Developments
- 17.2.2.5. Financials (Based on Availability)
- 17.2.3 Arktis Radiation Detectors Ltd
- 17.2.3.1. Overview
- 17.2.3.2. Products
- 17.2.3.3. SWOT Analysis
- 17.2.3.4. Recent Developments
- 17.2.3.5. Financials (Based on Availability)
- 17.2.4 Fuji Electric Co Ltd
- 17.2.4.1. Overview
- 17.2.4.2. Products
- 17.2.4.3. SWOT Analysis
- 17.2.4.4. Recent Developments
- 17.2.4.5. Financials (Based on Availability)
- 17.2.5 Thermo Fisher Scientific Inc
- 17.2.5.1. Overview
- 17.2.5.2. Products
- 17.2.5.3. SWOT Analysis
- 17.2.5.4. Recent Developments
- 17.2.5.5. Financials (Based on Availability)
- 17.2.6 Amray Group Limited
- 17.2.6.1. Overview
- 17.2.6.2. Products
- 17.2.6.3. SWOT Analysis
- 17.2.6.4. Recent Developments
- 17.2.6.5. Financials (Based on Availability)
- 17.2.7 ORTEC (Ametek Inc )
- 17.2.7.1. Overview
- 17.2.7.2. Products
- 17.2.7.3. SWOT Analysis
- 17.2.7.4. Recent Developments
- 17.2.7.5. Financials (Based on Availability)
- 17.2.8 Mirion Technologies Inc
- 17.2.8.1. Overview
- 17.2.8.2. Products
- 17.2.8.3. SWOT Analysis
- 17.2.8.4. Recent Developments
- 17.2.8.5. Financials (Based on Availability)
- 17.2.9 Burlington Medical LLC
- 17.2.9.1. Overview
- 17.2.9.2. Products
- 17.2.9.3. SWOT Analysis
- 17.2.9.4. Recent Developments
- 17.2.9.5. Financials (Based on Availability)
- 17.2.10 ATOMTEX SP
- 17.2.10.1. Overview
- 17.2.10.2. Products
- 17.2.10.3. SWOT Analysis
- 17.2.10.4. Recent Developments
- 17.2.10.5. Financials (Based on Availability)
- 17.2.11 Radiation Detection Company
- 17.2.11.1. Overview
- 17.2.11.2. Products
- 17.2.11.3. SWOT Analysis
- 17.2.11.4. Recent Developments
- 17.2.11.5. Financials (Based on Availability)
- 17.2.12 Teledyne FLIR Systems Inc
- 17.2.12.1. Overview
- 17.2.12.2. Products
- 17.2.12.3. SWOT Analysis
- 17.2.12.4. Recent Developments
- 17.2.12.5. Financials (Based on Availability)
- 17.2.13 RAE Systems Inc (Honeywell International Inc )
- 17.2.13.1. Overview
- 17.2.13.2. Products
- 17.2.13.3. SWOT Analysis
- 17.2.13.4. Recent Developments
- 17.2.13.5. Financials (Based on Availability)
- 17.2.14 Unfors RaySafe AB
- 17.2.14.1. Overview
- 17.2.14.2. Products
- 17.2.14.3. SWOT Analysis
- 17.2.14.4. Recent Developments
- 17.2.14.5. Financials (Based on Availability)
- 17.2.1 Landauer Inc (Fortive Corporation)
List of Figures
- Figure 1: Global Radiation Detection, Monitoring & Safety Industry Revenue Breakdown (Million, %) by Region 2024 & 2032
- Figure 2: North America Radiation Detection, Monitoring & Safety Industry Revenue (Million), by Country 2024 & 2032
- Figure 3: North America Radiation Detection, Monitoring & Safety Industry Revenue Share (%), by Country 2024 & 2032
- Figure 4: Europe Radiation Detection, Monitoring & Safety Industry Revenue (Million), by Country 2024 & 2032
- Figure 5: Europe Radiation Detection, Monitoring & Safety Industry Revenue Share (%), by Country 2024 & 2032
- Figure 6: Asia Pacific Radiation Detection, Monitoring & Safety Industry Revenue (Million), by Country 2024 & 2032
- Figure 7: Asia Pacific Radiation Detection, Monitoring & Safety Industry Revenue Share (%), by Country 2024 & 2032
- Figure 8: South America Radiation Detection, Monitoring & Safety Industry Revenue (Million), by Country 2024 & 2032
- Figure 9: South America Radiation Detection, Monitoring & Safety Industry Revenue Share (%), by Country 2024 & 2032
- Figure 10: MEA Radiation Detection, Monitoring & Safety Industry Revenue (Million), by Country 2024 & 2032
- Figure 11: MEA Radiation Detection, Monitoring & Safety Industry Revenue Share (%), by Country 2024 & 2032
- Figure 12: North America Radiation Detection, Monitoring & Safety Industry Revenue (Million), by Product Type 2024 & 2032
- Figure 13: North America Radiation Detection, Monitoring & Safety Industry Revenue Share (%), by Product Type 2024 & 2032
- Figure 14: North America Radiation Detection, Monitoring & Safety Industry Revenue (Million), by End-user Industry 2024 & 2032
- Figure 15: North America Radiation Detection, Monitoring & Safety Industry Revenue Share (%), by End-user Industry 2024 & 2032
- Figure 16: North America Radiation Detection, Monitoring & Safety Industry Revenue (Million), by Country 2024 & 2032
- Figure 17: North America Radiation Detection, Monitoring & Safety Industry Revenue Share (%), by Country 2024 & 2032
- Figure 18: Europe Radiation Detection, Monitoring & Safety Industry Revenue (Million), by Product Type 2024 & 2032
- Figure 19: Europe Radiation Detection, Monitoring & Safety Industry Revenue Share (%), by Product Type 2024 & 2032
- Figure 20: Europe Radiation Detection, Monitoring & Safety Industry Revenue (Million), by End-user Industry 2024 & 2032
- Figure 21: Europe Radiation Detection, Monitoring & Safety Industry Revenue Share (%), by End-user Industry 2024 & 2032
- Figure 22: Europe Radiation Detection, Monitoring & Safety Industry Revenue (Million), by Country 2024 & 2032
- Figure 23: Europe Radiation Detection, Monitoring & Safety Industry Revenue Share (%), by Country 2024 & 2032
- Figure 24: Asia Radiation Detection, Monitoring & Safety Industry Revenue (Million), by Product Type 2024 & 2032
- Figure 25: Asia Radiation Detection, Monitoring & Safety Industry Revenue Share (%), by Product Type 2024 & 2032
- Figure 26: Asia Radiation Detection, Monitoring & Safety Industry Revenue (Million), by End-user Industry 2024 & 2032
- Figure 27: Asia Radiation Detection, Monitoring & Safety Industry Revenue Share (%), by End-user Industry 2024 & 2032
- Figure 28: Asia Radiation Detection, Monitoring & Safety Industry Revenue (Million), by Country 2024 & 2032
- Figure 29: Asia Radiation Detection, Monitoring & Safety Industry Revenue Share (%), by Country 2024 & 2032
- Figure 30: Australia and New Zealand Radiation Detection, Monitoring & Safety Industry Revenue (Million), by Product Type 2024 & 2032
- Figure 31: Australia and New Zealand Radiation Detection, Monitoring & Safety Industry Revenue Share (%), by Product Type 2024 & 2032
- Figure 32: Australia and New Zealand Radiation Detection, Monitoring & Safety Industry Revenue (Million), by End-user Industry 2024 & 2032
- Figure 33: Australia and New Zealand Radiation Detection, Monitoring & Safety Industry Revenue Share (%), by End-user Industry 2024 & 2032
- Figure 34: Australia and New Zealand Radiation Detection, Monitoring & Safety Industry Revenue (Million), by Country 2024 & 2032
- Figure 35: Australia and New Zealand Radiation Detection, Monitoring & Safety Industry Revenue Share (%), by Country 2024 & 2032
- Figure 36: Latin America Radiation Detection, Monitoring & Safety Industry Revenue (Million), by Product Type 2024 & 2032
- Figure 37: Latin America Radiation Detection, Monitoring & Safety Industry Revenue Share (%), by Product Type 2024 & 2032
- Figure 38: Latin America Radiation Detection, Monitoring & Safety Industry Revenue (Million), by End-user Industry 2024 & 2032
- Figure 39: Latin America Radiation Detection, Monitoring & Safety Industry Revenue Share (%), by End-user Industry 2024 & 2032
- Figure 40: Latin America Radiation Detection, Monitoring & Safety Industry Revenue (Million), by Country 2024 & 2032
- Figure 41: Latin America Radiation Detection, Monitoring & Safety Industry Revenue Share (%), by Country 2024 & 2032
- Figure 42: Middle East and Africa Radiation Detection, Monitoring & Safety Industry Revenue (Million), by Product Type 2024 & 2032
- Figure 43: Middle East and Africa Radiation Detection, Monitoring & Safety Industry Revenue Share (%), by Product Type 2024 & 2032
- Figure 44: Middle East and Africa Radiation Detection, Monitoring & Safety Industry Revenue (Million), by End-user Industry 2024 & 2032
- Figure 45: Middle East and Africa Radiation Detection, Monitoring & Safety Industry Revenue Share (%), by End-user Industry 2024 & 2032
- Figure 46: Middle East and Africa Radiation Detection, Monitoring & Safety Industry Revenue (Million), by Country 2024 & 2032
- Figure 47: Middle East and Africa Radiation Detection, Monitoring & Safety Industry Revenue Share (%), by Country 2024 & 2032
List of Tables
- Table 1: Global Radiation Detection, Monitoring & Safety Industry Revenue Million Forecast, by Region 2019 & 2032
- Table 2: Global Radiation Detection, Monitoring & Safety Industry Revenue Million Forecast, by Product Type 2019 & 2032
- Table 3: Global Radiation Detection, Monitoring & Safety Industry Revenue Million Forecast, by End-user Industry 2019 & 2032
- Table 4: Global Radiation Detection, Monitoring & Safety Industry Revenue Million Forecast, by Region 2019 & 2032
- Table 5: Global Radiation Detection, Monitoring & Safety Industry Revenue Million Forecast, by Country 2019 & 2032
- Table 6: United States Radiation Detection, Monitoring & Safety Industry Revenue (Million) Forecast, by Application 2019 & 2032
- Table 7: Canada Radiation Detection, Monitoring & Safety Industry Revenue (Million) Forecast, by Application 2019 & 2032
- Table 8: Mexico Radiation Detection, Monitoring & Safety Industry Revenue (Million) Forecast, by Application 2019 & 2032
- Table 9: Global Radiation Detection, Monitoring & Safety Industry Revenue Million Forecast, by Country 2019 & 2032
- Table 10: Germany Radiation Detection, Monitoring & Safety Industry Revenue (Million) Forecast, by Application 2019 & 2032
- Table 11: United Kingdom Radiation Detection, Monitoring & Safety Industry Revenue (Million) Forecast, by Application 2019 & 2032
- Table 12: France Radiation Detection, Monitoring & Safety Industry Revenue (Million) Forecast, by Application 2019 & 2032
- Table 13: Spain Radiation Detection, Monitoring & Safety Industry Revenue (Million) Forecast, by Application 2019 & 2032
- Table 14: Italy Radiation Detection, Monitoring & Safety Industry Revenue (Million) Forecast, by Application 2019 & 2032
- Table 15: Spain Radiation Detection, Monitoring & Safety Industry Revenue (Million) Forecast, by Application 2019 & 2032
- Table 16: Belgium Radiation Detection, Monitoring & Safety Industry Revenue (Million) Forecast, by Application 2019 & 2032
- Table 17: Netherland Radiation Detection, Monitoring & Safety Industry Revenue (Million) Forecast, by Application 2019 & 2032
- Table 18: Nordics Radiation Detection, Monitoring & Safety Industry Revenue (Million) Forecast, by Application 2019 & 2032
- Table 19: Rest of Europe Radiation Detection, Monitoring & Safety Industry Revenue (Million) Forecast, by Application 2019 & 2032
- Table 20: Global Radiation Detection, Monitoring & Safety Industry Revenue Million Forecast, by Country 2019 & 2032
- Table 21: China Radiation Detection, Monitoring & Safety Industry Revenue (Million) Forecast, by Application 2019 & 2032
- Table 22: Japan Radiation Detection, Monitoring & Safety Industry Revenue (Million) Forecast, by Application 2019 & 2032
- Table 23: India Radiation Detection, Monitoring & Safety Industry Revenue (Million) Forecast, by Application 2019 & 2032
- Table 24: South Korea Radiation Detection, Monitoring & Safety Industry Revenue (Million) Forecast, by Application 2019 & 2032
- Table 25: Southeast Asia Radiation Detection, Monitoring & Safety Industry Revenue (Million) Forecast, by Application 2019 & 2032
- Table 26: Australia Radiation Detection, Monitoring & Safety Industry Revenue (Million) Forecast, by Application 2019 & 2032
- Table 27: Indonesia Radiation Detection, Monitoring & Safety Industry Revenue (Million) Forecast, by Application 2019 & 2032
- Table 28: Phillipes Radiation Detection, Monitoring & Safety Industry Revenue (Million) Forecast, by Application 2019 & 2032
- Table 29: Singapore Radiation Detection, Monitoring & Safety Industry Revenue (Million) Forecast, by Application 2019 & 2032
- Table 30: Thailandc Radiation Detection, Monitoring & Safety Industry Revenue (Million) Forecast, by Application 2019 & 2032
- Table 31: Rest of Asia Pacific Radiation Detection, Monitoring & Safety Industry Revenue (Million) Forecast, by Application 2019 & 2032
- Table 32: Global Radiation Detection, Monitoring & Safety Industry Revenue Million Forecast, by Country 2019 & 2032
- Table 33: Brazil Radiation Detection, Monitoring & Safety Industry Revenue (Million) Forecast, by Application 2019 & 2032
- Table 34: Argentina Radiation Detection, Monitoring & Safety Industry Revenue (Million) Forecast, by Application 2019 & 2032
- Table 35: Peru Radiation Detection, Monitoring & Safety Industry Revenue (Million) Forecast, by Application 2019 & 2032
- Table 36: Chile Radiation Detection, Monitoring & Safety Industry Revenue (Million) Forecast, by Application 2019 & 2032
- Table 37: Colombia Radiation Detection, Monitoring & Safety Industry Revenue (Million) Forecast, by Application 2019 & 2032
- Table 38: Ecuador Radiation Detection, Monitoring & Safety Industry Revenue (Million) Forecast, by Application 2019 & 2032
- Table 39: Venezuela Radiation Detection, Monitoring & Safety Industry Revenue (Million) Forecast, by Application 2019 & 2032
- Table 40: Rest of South America Radiation Detection, Monitoring & Safety Industry Revenue (Million) Forecast, by Application 2019 & 2032
- Table 41: Global Radiation Detection, Monitoring & Safety Industry Revenue Million Forecast, by Country 2019 & 2032
- Table 42: United Arab Emirates Radiation Detection, Monitoring & Safety Industry Revenue (Million) Forecast, by Application 2019 & 2032
- Table 43: Saudi Arabia Radiation Detection, Monitoring & Safety Industry Revenue (Million) Forecast, by Application 2019 & 2032
- Table 44: South Africa Radiation Detection, Monitoring & Safety Industry Revenue (Million) Forecast, by Application 2019 & 2032
- Table 45: Rest of Middle East and Africa Radiation Detection, Monitoring & Safety Industry Revenue (Million) Forecast, by Application 2019 & 2032
- Table 46: Global Radiation Detection, Monitoring & Safety Industry Revenue Million Forecast, by Product Type 2019 & 2032
- Table 47: Global Radiation Detection, Monitoring & Safety Industry Revenue Million Forecast, by End-user Industry 2019 & 2032
- Table 48: Global Radiation Detection, Monitoring & Safety Industry Revenue Million Forecast, by Country 2019 & 2032
- Table 49: Global Radiation Detection, Monitoring & Safety Industry Revenue Million Forecast, by Product Type 2019 & 2032
- Table 50: Global Radiation Detection, Monitoring & Safety Industry Revenue Million Forecast, by End-user Industry 2019 & 2032
- Table 51: Global Radiation Detection, Monitoring & Safety Industry Revenue Million Forecast, by Country 2019 & 2032
- Table 52: Global Radiation Detection, Monitoring & Safety Industry Revenue Million Forecast, by Product Type 2019 & 2032
- Table 53: Global Radiation Detection, Monitoring & Safety Industry Revenue Million Forecast, by End-user Industry 2019 & 2032
- Table 54: Global Radiation Detection, Monitoring & Safety Industry Revenue Million Forecast, by Country 2019 & 2032
- Table 55: Global Radiation Detection, Monitoring & Safety Industry Revenue Million Forecast, by Product Type 2019 & 2032
- Table 56: Global Radiation Detection, Monitoring & Safety Industry Revenue Million Forecast, by End-user Industry 2019 & 2032
- Table 57: Global Radiation Detection, Monitoring & Safety Industry Revenue Million Forecast, by Country 2019 & 2032
- Table 58: Global Radiation Detection, Monitoring & Safety Industry Revenue Million Forecast, by Product Type 2019 & 2032
- Table 59: Global Radiation Detection, Monitoring & Safety Industry Revenue Million Forecast, by End-user Industry 2019 & 2032
- Table 60: Global Radiation Detection, Monitoring & Safety Industry Revenue Million Forecast, by Country 2019 & 2032
- Table 61: Global Radiation Detection, Monitoring & Safety Industry Revenue Million Forecast, by Product Type 2019 & 2032
- Table 62: Global Radiation Detection, Monitoring & Safety Industry Revenue Million Forecast, by End-user Industry 2019 & 2032
- Table 63: Global Radiation Detection, Monitoring & Safety Industry Revenue Million Forecast, by Country 2019 & 2032
Frequently Asked Questions
1. What is the projected Compound Annual Growth Rate (CAGR) of the Radiation Detection, Monitoring & Safety Industry?
The projected CAGR is approximately 5.20%.
2. Which companies are prominent players in the Radiation Detection, Monitoring & Safety Industry?
Key companies in the market include Landauer Inc (Fortive Corporation), Centronic Ltd, Arktis Radiation Detectors Ltd, Fuji Electric Co Ltd, Thermo Fisher Scientific Inc, Amray Group Limited, ORTEC (Ametek Inc ), Mirion Technologies Inc, Burlington Medical LLC, ATOMTEX SP, Radiation Detection Company, Teledyne FLIR Systems Inc, RAE Systems Inc (Honeywell International Inc ), Unfors RaySafe AB.
3. What are the main segments of the Radiation Detection, Monitoring & Safety Industry?
The market segments include Product Type, End-user Industry.
4. Can you provide details about the market size?
The market size is estimated to be USD 3.44 Million as of 2022.
5. What are some drivers contributing to market growth?
Increasing Incidence of Cancer and Other Chronic Diseases; Growing Use of Drones for Radiation Monitoring.
6. What are the notable trends driving market growth?
Medical and Healthcare Industry to be the Largest End User.
7. Are there any restraints impacting market growth?
Stringent Government Regulations; Lack of Skilled Radiation Professionals.
8. Can you provide examples of recent developments in the market?
January 2024: The US military made the decision to upgrade its radiation detection equipment by adopting the new "Radiological Detection System" produced by D-Tect Systems, a division of Ludlum based in Utah. This system is modular, allowing for customization with various external probes to meet specific detection needs, such as alpha or neutron detection. The outdated AN/PDR-77 and AN/VDR-2 radiation detectors, which had been in use for 35 years, were replaced with this new technology.
9. What pricing options are available for accessing the report?
Pricing options include single-user, multi-user, and enterprise licenses priced at USD 4750, USD 5250, and USD 8750 respectively.
10. Is the market size provided in terms of value or volume?
The market size is provided in terms of value, measured in Million.
11. Are there any specific market keywords associated with the report?
Yes, the market keyword associated with the report is "Radiation Detection, Monitoring & Safety Industry," which aids in identifying and referencing the specific market segment covered.
12. How do I determine which pricing option suits my needs best?
The pricing options vary based on user requirements and access needs. Individual users may opt for single-user licenses, while businesses requiring broader access may choose multi-user or enterprise licenses for cost-effective access to the report.
13. Are there any additional resources or data provided in the Radiation Detection, Monitoring & Safety Industry report?
While the report offers comprehensive insights, it's advisable to review the specific contents or supplementary materials provided to ascertain if additional resources or data are available.
14. How can I stay updated on further developments or reports in the Radiation Detection, Monitoring & Safety Industry?
To stay informed about further developments, trends, and reports in the Radiation Detection, Monitoring & Safety Industry, consider subscribing to industry newsletters, following relevant companies and organizations, or regularly checking reputable industry news sources and publications.
Methodology
Step 1 - Identification of Relevant Samples Size from Population Database


Step 2 - Approaches for Defining Global Market Size (Value, Volume* & Price*)

Note*: In applicable scenarios
Step 3 - Data Sources
Primary Research
- Web Analytics
- Survey Reports
- Research Institute
- Latest Research Reports
- Opinion Leaders
Secondary Research
- Annual Reports
- White Paper
- Latest Press Release
- Industry Association
- Paid Database
- Investor Presentations

Step 4 - Data Triangulation
Involves using different sources of information in order to increase the validity of a study
These sources are likely to be stakeholders in a program - participants, other researchers, program staff, other community members, and so on.
Then we put all data in single framework & apply various statistical tools to find out the dynamic on the market.
During the analysis stage, feedback from the stakeholder groups would be compared to determine areas of agreement as well as areas of divergence


