

Key Insights
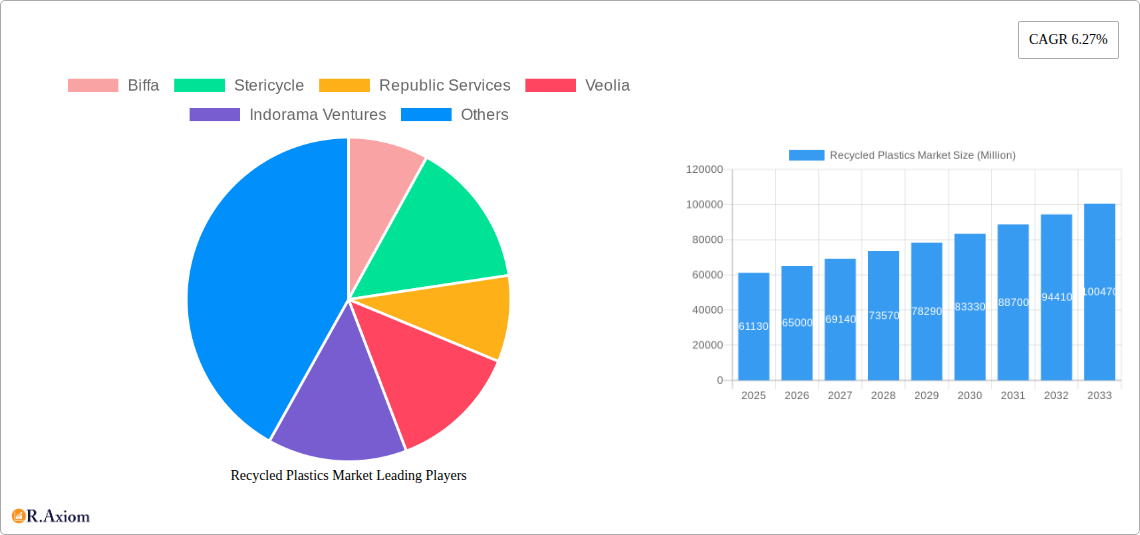
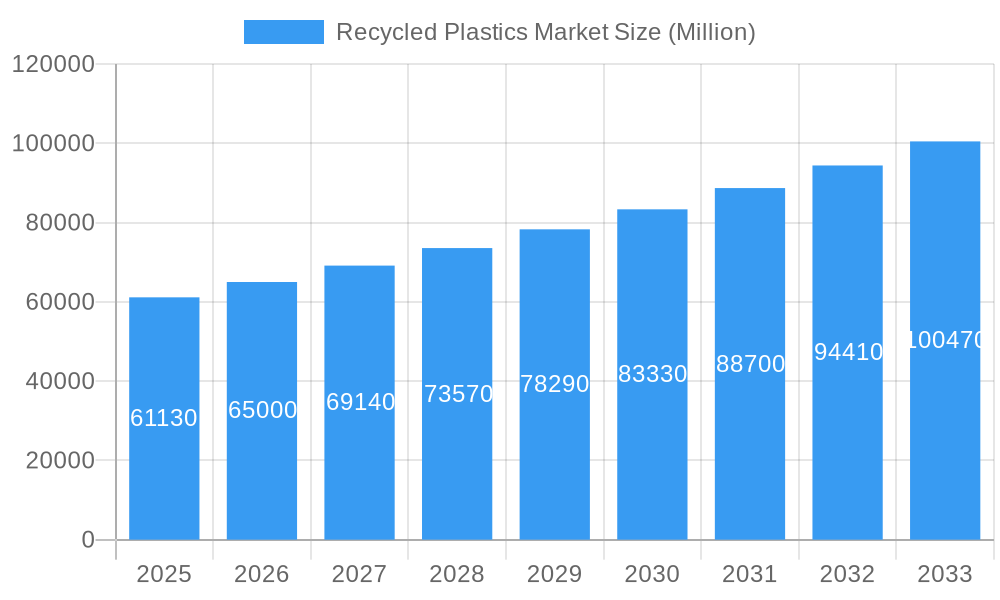
The global recycled plastics market, valued at $61.13 billion in 2025, is poised for significant growth, exhibiting a Compound Annual Growth Rate (CAGR) of 6.27% from 2025 to 2033. This robust expansion is driven by several key factors. Increasing environmental concerns and stringent government regulations aimed at reducing plastic waste are pushing manufacturers and consumers towards sustainable alternatives. The rising demand for recycled plastics in various applications, including packaging, construction, and automotive components, further fuels market growth. Technological advancements in recycling processes, particularly in chemical recycling, are enhancing the quality and usability of recycled plastics, making them more competitive with virgin materials. Furthermore, the growing adoption of circular economy principles and initiatives promoting sustainable consumption and production patterns contribute to the market's positive trajectory. Major players like Biffa, Stericycle, Republic Services, and Veolia are actively investing in recycling infrastructure and technologies, driving market expansion.
Recycled Plastics Market Market Size (In Billion)
However, the market faces certain challenges. Fluctuating prices of virgin plastics and the inconsistent quality of recycled materials remain hurdles. Limited availability of suitable recycling infrastructure, particularly in developing economies, also impedes widespread adoption. Overcoming these challenges requires collaborative efforts from governments, industries, and consumers to create a robust and efficient recycling ecosystem. This includes developing standardized recycling processes, incentivizing the use of recycled plastics, and investing in advanced recycling technologies to improve the quality and cost-effectiveness of recycled materials. The market is segmented by various factors including type of plastic (PET, HDPE, PP, etc.), application, and region. Though specific segment data isn't provided, the projected growth indicates a strong future for the industry across diverse application segments and geographies.
Recycled Plastics Market Company Market Share
This in-depth report provides a comprehensive analysis of the Recycled Plastics Market, covering the period from 2019 to 2033. It offers actionable insights into market trends, competitive dynamics, and future growth opportunities, enabling stakeholders to make informed strategic decisions. The report meticulously examines market segmentation, key players, technological advancements, and regulatory landscapes, providing a 360-degree view of this rapidly evolving industry. The base year for this analysis is 2025, with estimations for 2025 and forecasts spanning from 2025 to 2033.
Recycled Plastics Market Concentration & Innovation
This section analyzes the market concentration, highlighting the major players and their market share. We examine innovation drivers, including technological advancements in recycling processes and the development of new recycled plastic applications. Regulatory frameworks impacting the industry, such as extended producer responsibility (EPR) schemes and plastic waste reduction targets, are also assessed. The report further explores the influence of product substitutes and end-user trends on market growth. Finally, we delve into the impact of mergers and acquisitions (M&A) activities, analyzing deal values and their implications for market consolidation. The report incorporates data from the historical period (2019-2024) to provide a robust understanding of past trends and their influence on future market dynamics.
- Market Concentration: The market is moderately concentrated, with a few large players holding significant market share (xx%). However, the presence of numerous smaller companies indicates a dynamic and competitive landscape.
- Innovation Drivers: Advancements in chemical recycling technologies, development of higher-quality recycled plastics suitable for various applications (e.g., food packaging), and innovative product designs are driving market growth.
- Regulatory Frameworks: Stringent environmental regulations globally are pushing for increased plastic recycling and reducing reliance on virgin plastics. The impact of EPR schemes and carbon taxes are analyzed.
- Product Substitutes: Bioplastics and other sustainable alternatives pose a competitive threat, influencing market dynamics and prompting innovation.
- End-User Trends: Growing consumer demand for eco-friendly products and corporate sustainability initiatives are major drivers.
- M&A Activities: Several significant M&A deals have reshaped the market landscape in recent years, with estimated deal values totaling xx Million.
Recycled Plastics Market Industry Trends & Insights
This section provides a detailed overview of the Recycled Plastics Market's growth trajectory, analyzing key drivers, technological disruptions, consumer preferences, and competitive dynamics. The report offers insights into market size, CAGR, and market penetration rates, providing a comprehensive understanding of the industry's evolution. The analysis considers factors influencing market growth, including increasing environmental concerns, stringent government regulations, technological advancements, and the growing adoption of recycled plastics across various industries. We also explore the competitive landscape, identifying key players and their strategic moves.
- Market Growth Drivers: Rising environmental concerns, stringent government regulations, technological advancements, and increased consumer demand for sustainable products are key drivers.
- Technological Disruptions: Chemical recycling technologies are revolutionizing the industry, enabling the production of higher-quality recycled plastics suitable for demanding applications.
- Consumer Preferences: Growing consumer awareness of environmental issues is driving demand for products made from recycled materials.
- Competitive Dynamics: The market is witnessing increased competition, with companies focusing on innovation, cost reduction, and expansion into new markets. The projected CAGR for the forecast period (2025-2033) is xx%.
Dominant Markets & Segments in Recycled Plastics Market
This section identifies the leading regions, countries, and segments within the Recycled Plastics Market. The dominance of specific regions or segments is analyzed based on factors such as economic policies, infrastructure development, consumer behavior, and government regulations. We provide a detailed analysis of the market's geographic distribution, pinpointing key regions driving market growth.
- Key Drivers in Dominant Regions/Segments:
- Economic Policies: Government incentives and subsidies for recycling initiatives significantly influence market growth in certain regions.
- Infrastructure: The availability of efficient collection and processing infrastructure is crucial for successful recycling programs.
- Consumer Awareness: High consumer awareness and demand for sustainable products contribute to market dominance in specific regions.
- Regulatory Landscape: Stringent environmental regulations and policies promoting recycled content drive market growth.
- Dominance Analysis: (Paragraph explaining the dominance of specific regions/segments with supporting data and rationale)
Recycled Plastics Market Product Developments
The Recycled Plastics Market is experiencing significant product innovation, driven by the demand for higher-quality recycled materials suitable for diverse applications. New technologies, such as advanced chemical recycling processes, are enabling the production of recycled plastics with properties comparable to virgin plastics. This allows for expansion into new application areas, including food packaging, textiles, and automotive components. The competitive landscape is shaped by companies’ ability to offer innovative products, efficient processing technologies, and cost-effective solutions.
Report Scope & Segmentation Analysis
This report segments the Recycled Plastics Market based on several key parameters, offering a granular analysis of each segment's growth trajectory, market size, and competitive dynamics. The segments considered include: [insert specific segmentation categories here, e.g., by plastic type (PET, HDPE, PP, etc.), by application (packaging, construction, automotive, etc.), by recycling technology (mechanical, chemical, etc.)]. Growth projections for each segment are provided for the forecast period (2025-2033).
- [Segment 1]: [Description, Growth Projections, Market Size, Competitive Dynamics]
- [Segment 2]: [Description, Growth Projections, Market Size, Competitive Dynamics]
- [Segment 3]: [Description, Growth Projections, Market Size, Competitive Dynamics]
Key Drivers of Recycled Plastics Market Growth
Several key factors are driving the growth of the Recycled Plastics Market. These include technological advancements in recycling technologies, making it possible to produce higher-quality recycled plastics. Stringent government regulations aimed at reducing plastic waste and increasing the use of recycled materials are also a major driver. The increasing consumer awareness of environmental issues and the growing demand for sustainable products further contribute to market expansion. Economic incentives, such as tax breaks and subsidies, offered by governments to promote recycling also play a crucial role.
Challenges in the Recycled Plastics Market Sector
The Recycled Plastics Market faces several challenges, including inconsistencies in the quality of recycled plastics, which can limit their applicability in certain industries. Supply chain complexities, including the collection, sorting, and processing of waste plastics, present logistical and economic hurdles. The cost of recycling can be higher than producing virgin plastics, making recycled materials less competitive in some instances. Furthermore, competition from alternative materials and technological limitations in recycling certain types of plastics remain significant challenges.
Emerging Opportunities in Recycled Plastics Market
The Recycled Plastics Market presents several emerging opportunities. The development of advanced chemical recycling technologies allows for the processing of plastics previously considered unrecyclable. New applications for recycled plastics are constantly being explored and developed, expanding market potential. The growing demand for sustainable packaging solutions presents a significant opportunity for recycled plastic producers. Furthermore, the expansion of recycling infrastructure and collection systems in developing economies offers considerable growth potential.
Leading Players in the Recycled Plastics Market Market
Key Developments in Recycled Plastics Market Industry
- March 2024: PepsiCo launched premium snack packaging with 50% recycled plastic content, showcasing progress in food-grade recycled plastic applications. This marks a significant step toward increasing recycled plastic usage in the food and beverage industry.
- February 2023: SK Geo-Centric, Loop Industries, and SUEZ announced a joint venture to build a plant in France to produce virgin-quality PET plastic from 100% recycled materials. This signals a major investment in chemical recycling technology and its potential to revolutionize the industry.
Strategic Outlook for Recycled Plastics Market Market
The Recycled Plastics Market is poised for significant growth over the coming years, driven by increasing environmental awareness, stringent government regulations, and technological advancements. The development of advanced recycling technologies, coupled with growing consumer demand for sustainable products, will create significant opportunities for market players. Companies investing in innovative recycling processes and expanding their product portfolio to cater to diverse applications will be well-positioned to capture market share and drive future growth. The market's long-term prospects are exceptionally positive, with considerable potential for expansion across various industries and geographies.
Recycled Plastics Market Segmentation
-
1. Type
- 1.1. Polyethylene
- 1.2. Polyvinyl Chloride
- 1.3. Polyethylene Terephthalate
- 1.4. Polypropylene
- 1.5. Polystyrene
- 1.6. Other Types
-
2. Source
- 2.1. Foams
- 2.2. Films
- 2.3. Bottles
- 2.4. Fibers
- 2.5. Other Sources
-
3. End User
- 3.1. Building and Construction
- 3.2. Packaging
- 3.3. Electrical and Electronics
- 3.4. Automotive
- 3.5. Other End Users
Recycled Plastics Market Segmentation By Geography
-
1. North America
- 1.1. United States
- 1.2. Canada
- 1.3. Rest of North America
-
2. Europe
- 2.1. United Kingdom
- 2.2. Germany
- 2.3. France
- 2.4. Russia
- 2.5. Italy
- 2.6. Spain
- 2.7. Rest of Europe
-
3. Asia Pacific
- 3.1. India
- 3.2. China
- 3.3. Japan
- 3.4. Australia
- 3.5. Rest of Asia Pacific
-
4. South America
- 4.1. Brazil
- 4.2. Argentina
- 4.3. Rest of South America
-
5. Middle East and Africa
- 5.1. United Arab Emirates
- 5.2. South Africa
- 5.3. Rest of Middle East and Africa
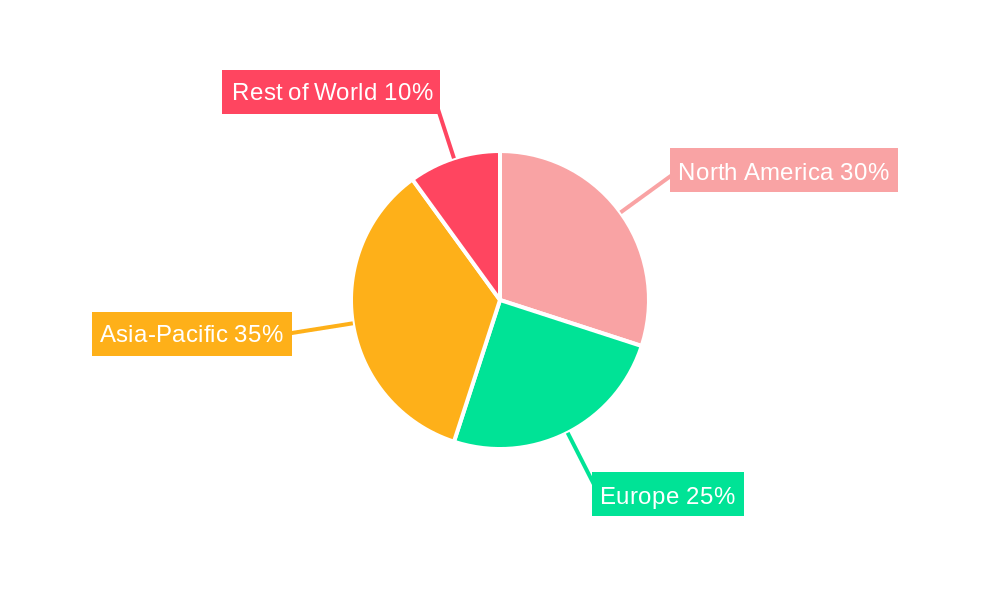
Recycled Plastics Market Regional Market Share
Geographic Coverage of Recycled Plastics Market
Recycled Plastics Market REPORT HIGHLIGHTS
| Aspects | Details |
|---|---|
| Study Period | 2020-2034 |
| Base Year | 2025 |
| Estimated Year | 2026 |
| Forecast Period | 2026-2034 |
| Historical Period | 2020-2025 |
| Growth Rate | CAGR of 6.27% from 2020-2034 |
| Segmentation |
|
Table of Contents
- 1. Introduction
- 1.1. Research Scope
- 1.2. Market Segmentation
- 1.3. Research Objective
- 1.4. Definitions and Assumptions
- 2. Executive Summary
- 2.1. Market Snapshot
- 3. Market Dynamics
- 3.1. Market Drivers
- 3.2. Market Restrains
- 3.3. Market Trends
- 3.4. Market Opportunities
- 4. Market Factor Analysis
- 4.1. Porters Five Forces
- 4.1.1. Bargaining Power of Suppliers
- 4.1.2. Bargaining Power of Buyers
- 4.1.3. Threat of New Entrants
- 4.1.4. Threat of Substitutes
- 4.1.5. Competitive Rivalry
- 4.2. PESTEL analysis
- 4.3. BCG Analysis
- 4.3.1. Stars (High Growth, High Market Share)
- 4.3.2. Cash Cows (Low Growth, High Market Share)
- 4.3.3. Question Mark (High Growth, Low Market Share)
- 4.3.4. Dogs (Low Growth, Low Market Share)
- 4.4. Ansoff Matrix Analysis
- 4.5. Supply Chain Analysis
- 4.6. Regulatory Landscape
- 4.7. Current Market Potential and Opportunity Assessment (TAM–SAM–SOM Framework)
- 4.8. RAX Analyst Note
- 4.1. Porters Five Forces
- 5. Market Analysis, Insights and Forecast 2021-2033
- 5.1. Market Analysis, Insights and Forecast - by Type
- 5.1.1. Polyethylene
- 5.1.2. Polyvinyl Chloride
- 5.1.3. Polyethylene Terephthalate
- 5.1.4. Polypropylene
- 5.1.5. Polystyrene
- 5.1.6. Other Types
- 5.2. Market Analysis, Insights and Forecast - by Source
- 5.2.1. Foams
- 5.2.2. Films
- 5.2.3. Bottles
- 5.2.4. Fibers
- 5.2.5. Other Sources
- 5.3. Market Analysis, Insights and Forecast - by End User
- 5.3.1. Building and Construction
- 5.3.2. Packaging
- 5.3.3. Electrical and Electronics
- 5.3.4. Automotive
- 5.3.5. Other End Users
- 5.4. Market Analysis, Insights and Forecast - by Region
- 5.4.1. North America
- 5.4.2. Europe
- 5.4.3. Asia Pacific
- 5.4.4. South America
- 5.4.5. Middle East and Africa
- 5.1. Market Analysis, Insights and Forecast - by Type
- 6. Global Recycled Plastics Market Analysis, Insights and Forecast, 2021-2033
- 6.1. Market Analysis, Insights and Forecast - by Type
- 6.1.1. Polyethylene
- 6.1.2. Polyvinyl Chloride
- 6.1.3. Polyethylene Terephthalate
- 6.1.4. Polypropylene
- 6.1.5. Polystyrene
- 6.1.6. Other Types
- 6.2. Market Analysis, Insights and Forecast - by Source
- 6.2.1. Foams
- 6.2.2. Films
- 6.2.3. Bottles
- 6.2.4. Fibers
- 6.2.5. Other Sources
- 6.3. Market Analysis, Insights and Forecast - by End User
- 6.3.1. Building and Construction
- 6.3.2. Packaging
- 6.3.3. Electrical and Electronics
- 6.3.4. Automotive
- 6.3.5. Other End Users
- 6.1. Market Analysis, Insights and Forecast - by Type
- 7. North America Recycled Plastics Market Analysis, Insights and Forecast, 2020-2032
- 7.1. Market Analysis, Insights and Forecast - by Type
- 7.1.1. Polyethylene
- 7.1.2. Polyvinyl Chloride
- 7.1.3. Polyethylene Terephthalate
- 7.1.4. Polypropylene
- 7.1.5. Polystyrene
- 7.1.6. Other Types
- 7.2. Market Analysis, Insights and Forecast - by Source
- 7.2.1. Foams
- 7.2.2. Films
- 7.2.3. Bottles
- 7.2.4. Fibers
- 7.2.5. Other Sources
- 7.3. Market Analysis, Insights and Forecast - by End User
- 7.3.1. Building and Construction
- 7.3.2. Packaging
- 7.3.3. Electrical and Electronics
- 7.3.4. Automotive
- 7.3.5. Other End Users
- 7.1. Market Analysis, Insights and Forecast - by Type
- 8. Europe Recycled Plastics Market Analysis, Insights and Forecast, 2020-2032
- 8.1. Market Analysis, Insights and Forecast - by Type
- 8.1.1. Polyethylene
- 8.1.2. Polyvinyl Chloride
- 8.1.3. Polyethylene Terephthalate
- 8.1.4. Polypropylene
- 8.1.5. Polystyrene
- 8.1.6. Other Types
- 8.2. Market Analysis, Insights and Forecast - by Source
- 8.2.1. Foams
- 8.2.2. Films
- 8.2.3. Bottles
- 8.2.4. Fibers
- 8.2.5. Other Sources
- 8.3. Market Analysis, Insights and Forecast - by End User
- 8.3.1. Building and Construction
- 8.3.2. Packaging
- 8.3.3. Electrical and Electronics
- 8.3.4. Automotive
- 8.3.5. Other End Users
- 8.1. Market Analysis, Insights and Forecast - by Type
- 9. Asia Pacific Recycled Plastics Market Analysis, Insights and Forecast, 2020-2032
- 9.1. Market Analysis, Insights and Forecast - by Type
- 9.1.1. Polyethylene
- 9.1.2. Polyvinyl Chloride
- 9.1.3. Polyethylene Terephthalate
- 9.1.4. Polypropylene
- 9.1.5. Polystyrene
- 9.1.6. Other Types
- 9.2. Market Analysis, Insights and Forecast - by Source
- 9.2.1. Foams
- 9.2.2. Films
- 9.2.3. Bottles
- 9.2.4. Fibers
- 9.2.5. Other Sources
- 9.3. Market Analysis, Insights and Forecast - by End User
- 9.3.1. Building and Construction
- 9.3.2. Packaging
- 9.3.3. Electrical and Electronics
- 9.3.4. Automotive
- 9.3.5. Other End Users
- 9.1. Market Analysis, Insights and Forecast - by Type
- 10. South America Recycled Plastics Market Analysis, Insights and Forecast, 2020-2032
- 10.1. Market Analysis, Insights and Forecast - by Type
- 10.1.1. Polyethylene
- 10.1.2. Polyvinyl Chloride
- 10.1.3. Polyethylene Terephthalate
- 10.1.4. Polypropylene
- 10.1.5. Polystyrene
- 10.1.6. Other Types
- 10.2. Market Analysis, Insights and Forecast - by Source
- 10.2.1. Foams
- 10.2.2. Films
- 10.2.3. Bottles
- 10.2.4. Fibers
- 10.2.5. Other Sources
- 10.3. Market Analysis, Insights and Forecast - by End User
- 10.3.1. Building and Construction
- 10.3.2. Packaging
- 10.3.3. Electrical and Electronics
- 10.3.4. Automotive
- 10.3.5. Other End Users
- 10.1. Market Analysis, Insights and Forecast - by Type
- 11. Middle East and Africa Recycled Plastics Market Analysis, Insights and Forecast, 2020-2032
- 11.1. Market Analysis, Insights and Forecast - by Type
- 11.1.1. Polyethylene
- 11.1.2. Polyvinyl Chloride
- 11.1.3. Polyethylene Terephthalate
- 11.1.4. Polypropylene
- 11.1.5. Polystyrene
- 11.1.6. Other Types
- 11.2. Market Analysis, Insights and Forecast - by Source
- 11.2.1. Foams
- 11.2.2. Films
- 11.2.3. Bottles
- 11.2.4. Fibers
- 11.2.5. Other Sources
- 11.3. Market Analysis, Insights and Forecast - by End User
- 11.3.1. Building and Construction
- 11.3.2. Packaging
- 11.3.3. Electrical and Electronics
- 11.3.4. Automotive
- 11.3.5. Other End Users
- 11.1. Market Analysis, Insights and Forecast - by Type
- 12. Competitive Analysis
- 12.1. Company Profiles
- 12.1.1 Biffa
- 12.1.1.1. Company Overview
- 12.1.1.2. Products
- 12.1.1.3. Company Financials
- 12.1.1.4. SWOT Analysis
- 12.1.2 Stericycle
- 12.1.2.1. Company Overview
- 12.1.2.2. Products
- 12.1.2.3. Company Financials
- 12.1.2.4. SWOT Analysis
- 12.1.3 Republic Services
- 12.1.3.1. Company Overview
- 12.1.3.2. Products
- 12.1.3.3. Company Financials
- 12.1.3.4. SWOT Analysis
- 12.1.4 Veolia
- 12.1.4.1. Company Overview
- 12.1.4.2. Products
- 12.1.4.3. Company Financials
- 12.1.4.4. SWOT Analysis
- 12.1.5 Indorama Ventures
- 12.1.5.1. Company Overview
- 12.1.5.2. Products
- 12.1.5.3. Company Financials
- 12.1.5.4. SWOT Analysis
- 12.1.6 Loop Industries
- 12.1.6.1. Company Overview
- 12.1.6.2. Products
- 12.1.6.3. Company Financials
- 12.1.6.4. SWOT Analysis
- 12.1.7 Plastipak Holdings
- 12.1.7.1. Company Overview
- 12.1.7.2. Products
- 12.1.7.3. Company Financials
- 12.1.7.4. SWOT Analysis
- 12.1.8 KW Plastics
- 12.1.8.1. Company Overview
- 12.1.8.2. Products
- 12.1.8.3. Company Financials
- 12.1.8.4. SWOT Analysis
- 12.1.9 B&B Plastics
- 12.1.9.1. Company Overview
- 12.1.9.2. Products
- 12.1.9.3. Company Financials
- 12.1.9.4. SWOT Analysis
- 12.1.10 Green Line Polymers**List Not Exhaustive
- 12.1.10.1. Company Overview
- 12.1.10.2. Products
- 12.1.10.3. Company Financials
- 12.1.10.4. SWOT Analysis
- 12.1.1 Biffa
- 12.2. Market Entropy
- 12.2.1 Company's Key Areas Served
- 12.2.2 Recent Developments
- 12.3. Company Market Share Analysis 2025
- 12.3.1 Top 5 Companies Market Share Analysis
- 12.3.2 Top 3 Companies Market Share Analysis
- 12.4. List of Potential Customers
- 13. Research Methodology
List of Figures
- Figure 1: Global Recycled Plastics Market Revenue Breakdown (Million, %) by Region 2025 & 2033
- Figure 2: Global Recycled Plastics Market Volume Breakdown (Billion, %) by Region 2025 & 2033
- Figure 3: North America Recycled Plastics Market Revenue (Million), by Type 2025 & 2033
- Figure 4: North America Recycled Plastics Market Volume (Billion), by Type 2025 & 2033
- Figure 5: North America Recycled Plastics Market Revenue Share (%), by Type 2025 & 2033
- Figure 6: North America Recycled Plastics Market Volume Share (%), by Type 2025 & 2033
- Figure 7: North America Recycled Plastics Market Revenue (Million), by Source 2025 & 2033
- Figure 8: North America Recycled Plastics Market Volume (Billion), by Source 2025 & 2033
- Figure 9: North America Recycled Plastics Market Revenue Share (%), by Source 2025 & 2033
- Figure 10: North America Recycled Plastics Market Volume Share (%), by Source 2025 & 2033
- Figure 11: North America Recycled Plastics Market Revenue (Million), by End User 2025 & 2033
- Figure 12: North America Recycled Plastics Market Volume (Billion), by End User 2025 & 2033
- Figure 13: North America Recycled Plastics Market Revenue Share (%), by End User 2025 & 2033
- Figure 14: North America Recycled Plastics Market Volume Share (%), by End User 2025 & 2033
- Figure 15: North America Recycled Plastics Market Revenue (Million), by Country 2025 & 2033
- Figure 16: North America Recycled Plastics Market Volume (Billion), by Country 2025 & 2033
- Figure 17: North America Recycled Plastics Market Revenue Share (%), by Country 2025 & 2033
- Figure 18: North America Recycled Plastics Market Volume Share (%), by Country 2025 & 2033
- Figure 19: Europe Recycled Plastics Market Revenue (Million), by Type 2025 & 2033
- Figure 20: Europe Recycled Plastics Market Volume (Billion), by Type 2025 & 2033
- Figure 21: Europe Recycled Plastics Market Revenue Share (%), by Type 2025 & 2033
- Figure 22: Europe Recycled Plastics Market Volume Share (%), by Type 2025 & 2033
- Figure 23: Europe Recycled Plastics Market Revenue (Million), by Source 2025 & 2033
- Figure 24: Europe Recycled Plastics Market Volume (Billion), by Source 2025 & 2033
- Figure 25: Europe Recycled Plastics Market Revenue Share (%), by Source 2025 & 2033
- Figure 26: Europe Recycled Plastics Market Volume Share (%), by Source 2025 & 2033
- Figure 27: Europe Recycled Plastics Market Revenue (Million), by End User 2025 & 2033
- Figure 28: Europe Recycled Plastics Market Volume (Billion), by End User 2025 & 2033
- Figure 29: Europe Recycled Plastics Market Revenue Share (%), by End User 2025 & 2033
- Figure 30: Europe Recycled Plastics Market Volume Share (%), by End User 2025 & 2033
- Figure 31: Europe Recycled Plastics Market Revenue (Million), by Country 2025 & 2033
- Figure 32: Europe Recycled Plastics Market Volume (Billion), by Country 2025 & 2033
- Figure 33: Europe Recycled Plastics Market Revenue Share (%), by Country 2025 & 2033
- Figure 34: Europe Recycled Plastics Market Volume Share (%), by Country 2025 & 2033
- Figure 35: Asia Pacific Recycled Plastics Market Revenue (Million), by Type 2025 & 2033
- Figure 36: Asia Pacific Recycled Plastics Market Volume (Billion), by Type 2025 & 2033
- Figure 37: Asia Pacific Recycled Plastics Market Revenue Share (%), by Type 2025 & 2033
- Figure 38: Asia Pacific Recycled Plastics Market Volume Share (%), by Type 2025 & 2033
- Figure 39: Asia Pacific Recycled Plastics Market Revenue (Million), by Source 2025 & 2033
- Figure 40: Asia Pacific Recycled Plastics Market Volume (Billion), by Source 2025 & 2033
- Figure 41: Asia Pacific Recycled Plastics Market Revenue Share (%), by Source 2025 & 2033
- Figure 42: Asia Pacific Recycled Plastics Market Volume Share (%), by Source 2025 & 2033
- Figure 43: Asia Pacific Recycled Plastics Market Revenue (Million), by End User 2025 & 2033
- Figure 44: Asia Pacific Recycled Plastics Market Volume (Billion), by End User 2025 & 2033
- Figure 45: Asia Pacific Recycled Plastics Market Revenue Share (%), by End User 2025 & 2033
- Figure 46: Asia Pacific Recycled Plastics Market Volume Share (%), by End User 2025 & 2033
- Figure 47: Asia Pacific Recycled Plastics Market Revenue (Million), by Country 2025 & 2033
- Figure 48: Asia Pacific Recycled Plastics Market Volume (Billion), by Country 2025 & 2033
- Figure 49: Asia Pacific Recycled Plastics Market Revenue Share (%), by Country 2025 & 2033
- Figure 50: Asia Pacific Recycled Plastics Market Volume Share (%), by Country 2025 & 2033
- Figure 51: South America Recycled Plastics Market Revenue (Million), by Type 2025 & 2033
- Figure 52: South America Recycled Plastics Market Volume (Billion), by Type 2025 & 2033
- Figure 53: South America Recycled Plastics Market Revenue Share (%), by Type 2025 & 2033
- Figure 54: South America Recycled Plastics Market Volume Share (%), by Type 2025 & 2033
- Figure 55: South America Recycled Plastics Market Revenue (Million), by Source 2025 & 2033
- Figure 56: South America Recycled Plastics Market Volume (Billion), by Source 2025 & 2033
- Figure 57: South America Recycled Plastics Market Revenue Share (%), by Source 2025 & 2033
- Figure 58: South America Recycled Plastics Market Volume Share (%), by Source 2025 & 2033
- Figure 59: South America Recycled Plastics Market Revenue (Million), by End User 2025 & 2033
- Figure 60: South America Recycled Plastics Market Volume (Billion), by End User 2025 & 2033
- Figure 61: South America Recycled Plastics Market Revenue Share (%), by End User 2025 & 2033
- Figure 62: South America Recycled Plastics Market Volume Share (%), by End User 2025 & 2033
- Figure 63: South America Recycled Plastics Market Revenue (Million), by Country 2025 & 2033
- Figure 64: South America Recycled Plastics Market Volume (Billion), by Country 2025 & 2033
- Figure 65: South America Recycled Plastics Market Revenue Share (%), by Country 2025 & 2033
- Figure 66: South America Recycled Plastics Market Volume Share (%), by Country 2025 & 2033
- Figure 67: Middle East and Africa Recycled Plastics Market Revenue (Million), by Type 2025 & 2033
- Figure 68: Middle East and Africa Recycled Plastics Market Volume (Billion), by Type 2025 & 2033
- Figure 69: Middle East and Africa Recycled Plastics Market Revenue Share (%), by Type 2025 & 2033
- Figure 70: Middle East and Africa Recycled Plastics Market Volume Share (%), by Type 2025 & 2033
- Figure 71: Middle East and Africa Recycled Plastics Market Revenue (Million), by Source 2025 & 2033
- Figure 72: Middle East and Africa Recycled Plastics Market Volume (Billion), by Source 2025 & 2033
- Figure 73: Middle East and Africa Recycled Plastics Market Revenue Share (%), by Source 2025 & 2033
- Figure 74: Middle East and Africa Recycled Plastics Market Volume Share (%), by Source 2025 & 2033
- Figure 75: Middle East and Africa Recycled Plastics Market Revenue (Million), by End User 2025 & 2033
- Figure 76: Middle East and Africa Recycled Plastics Market Volume (Billion), by End User 2025 & 2033
- Figure 77: Middle East and Africa Recycled Plastics Market Revenue Share (%), by End User 2025 & 2033
- Figure 78: Middle East and Africa Recycled Plastics Market Volume Share (%), by End User 2025 & 2033
- Figure 79: Middle East and Africa Recycled Plastics Market Revenue (Million), by Country 2025 & 2033
- Figure 80: Middle East and Africa Recycled Plastics Market Volume (Billion), by Country 2025 & 2033
- Figure 81: Middle East and Africa Recycled Plastics Market Revenue Share (%), by Country 2025 & 2033
- Figure 82: Middle East and Africa Recycled Plastics Market Volume Share (%), by Country 2025 & 2033
List of Tables
- Table 1: Global Recycled Plastics Market Revenue Million Forecast, by Type 2020 & 2033
- Table 2: Global Recycled Plastics Market Volume Billion Forecast, by Type 2020 & 2033
- Table 3: Global Recycled Plastics Market Revenue Million Forecast, by Source 2020 & 2033
- Table 4: Global Recycled Plastics Market Volume Billion Forecast, by Source 2020 & 2033
- Table 5: Global Recycled Plastics Market Revenue Million Forecast, by End User 2020 & 2033
- Table 6: Global Recycled Plastics Market Volume Billion Forecast, by End User 2020 & 2033
- Table 7: Global Recycled Plastics Market Revenue Million Forecast, by Region 2020 & 2033
- Table 8: Global Recycled Plastics Market Volume Billion Forecast, by Region 2020 & 2033
- Table 9: Global Recycled Plastics Market Revenue Million Forecast, by Type 2020 & 2033
- Table 10: Global Recycled Plastics Market Volume Billion Forecast, by Type 2020 & 2033
- Table 11: Global Recycled Plastics Market Revenue Million Forecast, by Source 2020 & 2033
- Table 12: Global Recycled Plastics Market Volume Billion Forecast, by Source 2020 & 2033
- Table 13: Global Recycled Plastics Market Revenue Million Forecast, by End User 2020 & 2033
- Table 14: Global Recycled Plastics Market Volume Billion Forecast, by End User 2020 & 2033
- Table 15: Global Recycled Plastics Market Revenue Million Forecast, by Country 2020 & 2033
- Table 16: Global Recycled Plastics Market Volume Billion Forecast, by Country 2020 & 2033
- Table 17: United States Recycled Plastics Market Revenue (Million) Forecast, by Application 2020 & 2033
- Table 18: United States Recycled Plastics Market Volume (Billion) Forecast, by Application 2020 & 2033
- Table 19: Canada Recycled Plastics Market Revenue (Million) Forecast, by Application 2020 & 2033
- Table 20: Canada Recycled Plastics Market Volume (Billion) Forecast, by Application 2020 & 2033
- Table 21: Rest of North America Recycled Plastics Market Revenue (Million) Forecast, by Application 2020 & 2033
- Table 22: Rest of North America Recycled Plastics Market Volume (Billion) Forecast, by Application 2020 & 2033
- Table 23: Global Recycled Plastics Market Revenue Million Forecast, by Type 2020 & 2033
- Table 24: Global Recycled Plastics Market Volume Billion Forecast, by Type 2020 & 2033
- Table 25: Global Recycled Plastics Market Revenue Million Forecast, by Source 2020 & 2033
- Table 26: Global Recycled Plastics Market Volume Billion Forecast, by Source 2020 & 2033
- Table 27: Global Recycled Plastics Market Revenue Million Forecast, by End User 2020 & 2033
- Table 28: Global Recycled Plastics Market Volume Billion Forecast, by End User 2020 & 2033
- Table 29: Global Recycled Plastics Market Revenue Million Forecast, by Country 2020 & 2033
- Table 30: Global Recycled Plastics Market Volume Billion Forecast, by Country 2020 & 2033
- Table 31: United Kingdom Recycled Plastics Market Revenue (Million) Forecast, by Application 2020 & 2033
- Table 32: United Kingdom Recycled Plastics Market Volume (Billion) Forecast, by Application 2020 & 2033
- Table 33: Germany Recycled Plastics Market Revenue (Million) Forecast, by Application 2020 & 2033
- Table 34: Germany Recycled Plastics Market Volume (Billion) Forecast, by Application 2020 & 2033
- Table 35: France Recycled Plastics Market Revenue (Million) Forecast, by Application 2020 & 2033
- Table 36: France Recycled Plastics Market Volume (Billion) Forecast, by Application 2020 & 2033
- Table 37: Russia Recycled Plastics Market Revenue (Million) Forecast, by Application 2020 & 2033
- Table 38: Russia Recycled Plastics Market Volume (Billion) Forecast, by Application 2020 & 2033
- Table 39: Italy Recycled Plastics Market Revenue (Million) Forecast, by Application 2020 & 2033
- Table 40: Italy Recycled Plastics Market Volume (Billion) Forecast, by Application 2020 & 2033
- Table 41: Spain Recycled Plastics Market Revenue (Million) Forecast, by Application 2020 & 2033
- Table 42: Spain Recycled Plastics Market Volume (Billion) Forecast, by Application 2020 & 2033
- Table 43: Rest of Europe Recycled Plastics Market Revenue (Million) Forecast, by Application 2020 & 2033
- Table 44: Rest of Europe Recycled Plastics Market Volume (Billion) Forecast, by Application 2020 & 2033
- Table 45: Global Recycled Plastics Market Revenue Million Forecast, by Type 2020 & 2033
- Table 46: Global Recycled Plastics Market Volume Billion Forecast, by Type 2020 & 2033
- Table 47: Global Recycled Plastics Market Revenue Million Forecast, by Source 2020 & 2033
- Table 48: Global Recycled Plastics Market Volume Billion Forecast, by Source 2020 & 2033
- Table 49: Global Recycled Plastics Market Revenue Million Forecast, by End User 2020 & 2033
- Table 50: Global Recycled Plastics Market Volume Billion Forecast, by End User 2020 & 2033
- Table 51: Global Recycled Plastics Market Revenue Million Forecast, by Country 2020 & 2033
- Table 52: Global Recycled Plastics Market Volume Billion Forecast, by Country 2020 & 2033
- Table 53: India Recycled Plastics Market Revenue (Million) Forecast, by Application 2020 & 2033
- Table 54: India Recycled Plastics Market Volume (Billion) Forecast, by Application 2020 & 2033
- Table 55: China Recycled Plastics Market Revenue (Million) Forecast, by Application 2020 & 2033
- Table 56: China Recycled Plastics Market Volume (Billion) Forecast, by Application 2020 & 2033
- Table 57: Japan Recycled Plastics Market Revenue (Million) Forecast, by Application 2020 & 2033
- Table 58: Japan Recycled Plastics Market Volume (Billion) Forecast, by Application 2020 & 2033
- Table 59: Australia Recycled Plastics Market Revenue (Million) Forecast, by Application 2020 & 2033
- Table 60: Australia Recycled Plastics Market Volume (Billion) Forecast, by Application 2020 & 2033
- Table 61: Rest of Asia Pacific Recycled Plastics Market Revenue (Million) Forecast, by Application 2020 & 2033
- Table 62: Rest of Asia Pacific Recycled Plastics Market Volume (Billion) Forecast, by Application 2020 & 2033
- Table 63: Global Recycled Plastics Market Revenue Million Forecast, by Type 2020 & 2033
- Table 64: Global Recycled Plastics Market Volume Billion Forecast, by Type 2020 & 2033
- Table 65: Global Recycled Plastics Market Revenue Million Forecast, by Source 2020 & 2033
- Table 66: Global Recycled Plastics Market Volume Billion Forecast, by Source 2020 & 2033
- Table 67: Global Recycled Plastics Market Revenue Million Forecast, by End User 2020 & 2033
- Table 68: Global Recycled Plastics Market Volume Billion Forecast, by End User 2020 & 2033
- Table 69: Global Recycled Plastics Market Revenue Million Forecast, by Country 2020 & 2033
- Table 70: Global Recycled Plastics Market Volume Billion Forecast, by Country 2020 & 2033
- Table 71: Brazil Recycled Plastics Market Revenue (Million) Forecast, by Application 2020 & 2033
- Table 72: Brazil Recycled Plastics Market Volume (Billion) Forecast, by Application 2020 & 2033
- Table 73: Argentina Recycled Plastics Market Revenue (Million) Forecast, by Application 2020 & 2033
- Table 74: Argentina Recycled Plastics Market Volume (Billion) Forecast, by Application 2020 & 2033
- Table 75: Rest of South America Recycled Plastics Market Revenue (Million) Forecast, by Application 2020 & 2033
- Table 76: Rest of South America Recycled Plastics Market Volume (Billion) Forecast, by Application 2020 & 2033
- Table 77: Global Recycled Plastics Market Revenue Million Forecast, by Type 2020 & 2033
- Table 78: Global Recycled Plastics Market Volume Billion Forecast, by Type 2020 & 2033
- Table 79: Global Recycled Plastics Market Revenue Million Forecast, by Source 2020 & 2033
- Table 80: Global Recycled Plastics Market Volume Billion Forecast, by Source 2020 & 2033
- Table 81: Global Recycled Plastics Market Revenue Million Forecast, by End User 2020 & 2033
- Table 82: Global Recycled Plastics Market Volume Billion Forecast, by End User 2020 & 2033
- Table 83: Global Recycled Plastics Market Revenue Million Forecast, by Country 2020 & 2033
- Table 84: Global Recycled Plastics Market Volume Billion Forecast, by Country 2020 & 2033
- Table 85: United Arab Emirates Recycled Plastics Market Revenue (Million) Forecast, by Application 2020 & 2033
- Table 86: United Arab Emirates Recycled Plastics Market Volume (Billion) Forecast, by Application 2020 & 2033
- Table 87: South Africa Recycled Plastics Market Revenue (Million) Forecast, by Application 2020 & 2033
- Table 88: South Africa Recycled Plastics Market Volume (Billion) Forecast, by Application 2020 & 2033
- Table 89: Rest of Middle East and Africa Recycled Plastics Market Revenue (Million) Forecast, by Application 2020 & 2033
- Table 90: Rest of Middle East and Africa Recycled Plastics Market Volume (Billion) Forecast, by Application 2020 & 2033
Frequently Asked Questions
1. What is the projected Compound Annual Growth Rate (CAGR) of the Recycled Plastics Market?
The projected CAGR is approximately 6.27%.
2. Which companies are prominent players in the Recycled Plastics Market?
Key companies in the market include Biffa, Stericycle, Republic Services, Veolia, Indorama Ventures, Loop Industries, Plastipak Holdings, KW Plastics, B&B Plastics, Green Line Polymers**List Not Exhaustive.
3. What are the main segments of the Recycled Plastics Market?
The market segments include Type, Source, End User.
4. Can you provide details about the market size?
The market size is estimated to be USD 61.13 Million as of 2022.
5. What are some drivers contributing to market growth?
Increasing Awareness Regarding Sustainable Plastic Waste Management; Implementation of Restrictions on Landfills.
6. What are the notable trends driving market growth?
Increasing Adoption of Recycled Plastic in Packaging Industries.
7. Are there any restraints impacting market growth?
Increasing Awareness Regarding Sustainable Plastic Waste Management; Implementation of Restrictions on Landfills.
8. Can you provide examples of recent developments in the market?
March 2024: PepsiCo, in collaboration with its partners in the flexible food packaging supply chain, unveiled a line of premium snack packaging boasting a significant 50% recycled plastic content. This innovative packaging, meeting rigorous food-contact standards, debuted with PepsiCo's Sunbites brand, initially hitting the shelves in the United Kingdom and Ireland.February 2023: SK Geo-Centric, Loop Industries, and SUEZ announced their selection of the Grand Est region in France to manufacture virgin-quality PET plastic exclusively from 100% recycled materials. The trio plans to commence construction in early 2025, targeting a plant commissioning by 2027.
9. What pricing options are available for accessing the report?
Pricing options include single-user, multi-user, and enterprise licenses priced at USD 4750, USD 5250, and USD 8750 respectively.
10. Is the market size provided in terms of value or volume?
The market size is provided in terms of value, measured in Million and volume, measured in Billion.
11. Are there any specific market keywords associated with the report?
Yes, the market keyword associated with the report is "Recycled Plastics Market," which aids in identifying and referencing the specific market segment covered.
12. How do I determine which pricing option suits my needs best?
The pricing options vary based on user requirements and access needs. Individual users may opt for single-user licenses, while businesses requiring broader access may choose multi-user or enterprise licenses for cost-effective access to the report.
13. Are there any additional resources or data provided in the Recycled Plastics Market report?
While the report offers comprehensive insights, it's advisable to review the specific contents or supplementary materials provided to ascertain if additional resources or data are available.
14. How can I stay updated on further developments or reports in the Recycled Plastics Market?
To stay informed about further developments, trends, and reports in the Recycled Plastics Market, consider subscribing to industry newsletters, following relevant companies and organizations, or regularly checking reputable industry news sources and publications.
Methodology
Step 1 - Identification of Relevant Samples Size from Population Database


Step 2 - Approaches for Defining Global Market Size (Value, Volume* & Price*)

Note*: In applicable scenarios
Step 3 - Data Sources
Primary Research
- Web Analytics
- Survey Reports
- Research Institute
- Latest Research Reports
- Opinion Leaders
Secondary Research
- Annual Reports
- White Paper
- Latest Press Release
- Industry Association
- Paid Database
- Investor Presentations

Step 4 - Data Triangulation
Involves using different sources of information in order to increase the validity of a study
These sources are likely to be stakeholders in a program - participants, other researchers, program staff, other community members, and so on.
Then we put all data in single framework & apply various statistical tools to find out the dynamic on the market.
During the analysis stage, feedback from the stakeholder groups would be compared to determine areas of agreement as well as areas of divergence