

Key Insights
The global refuse compactor market is poised for significant expansion, propelled by escalating urbanization, stringent waste management mandates, and a heightened emphasis on environmental sustainability. The market is projected to reach $280 million by 2024, with a projected Compound Annual Growth Rate (CAGR) of 3.4% from 2024. This robust growth is primarily driven by the increasing demand for efficient waste disposal solutions across residential, commercial, and industrial sectors. Key factors contributing to this demand include the need for space optimization in densely populated urban environments and the imperative to minimize landfill waste. Innovations in compactor technology, such as automated features and enhanced compaction efficiency, are further bolstering market attractiveness. Major market segments are expected to encompass industrial, commercial, and residential compactors, each exhibiting distinct growth trajectories influenced by specific application needs and adoption rates. The competitive environment is characterized by a moderate fragmentation, featuring established industry leaders alongside specialized niche players. Future market expansion will be shaped by governmental initiatives supporting recycling and waste reduction, the integration of smart waste management technologies, and the widespread adoption of sustainable practices across diverse industries.
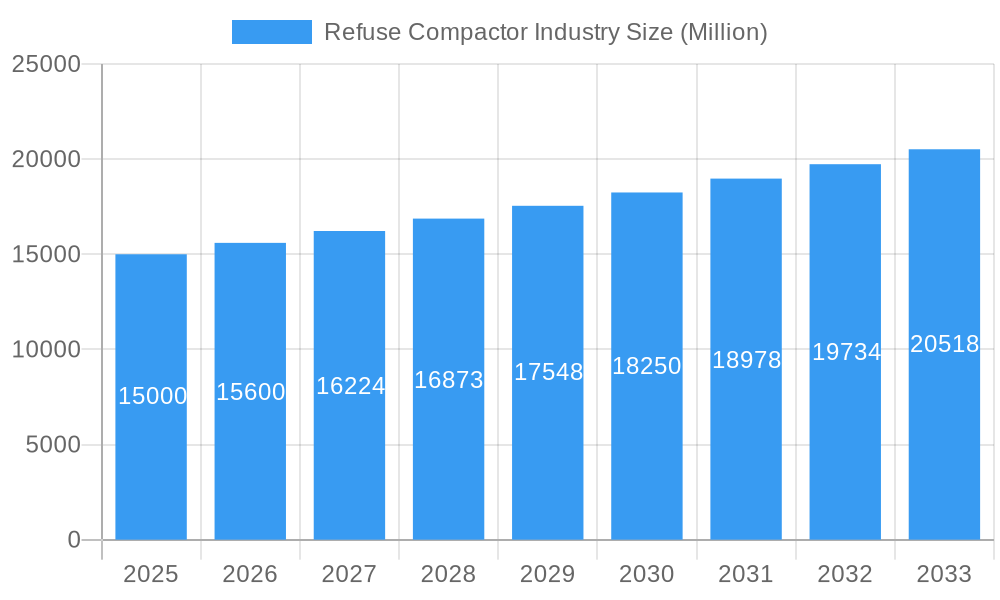
Refuse Compactor Industry Market Size (In Million)
The forecast period (2025-2033) indicates sustained market development, with the CAGR potentially adjusting in response to economic fluctuations and technological breakthroughs. However, considering the enduring market drivers, a conservative growth projection remains above 3%. A detailed market segmentation analysis will illuminate the fastest-growing compactor types, such as horizontal, vertical, and self-contained units. Geographic segmentation will highlight regional variations in market maturity and penetration, with developed economies demonstrating established markets and developing regions offering substantial growth opportunities. Comprehensive market research reports offer in-depth insights into regional market shares and future outlooks. A thorough examination of individual company performance, emerging technologies, and evolving regulatory frameworks is essential for a holistic understanding of this dynamic market.
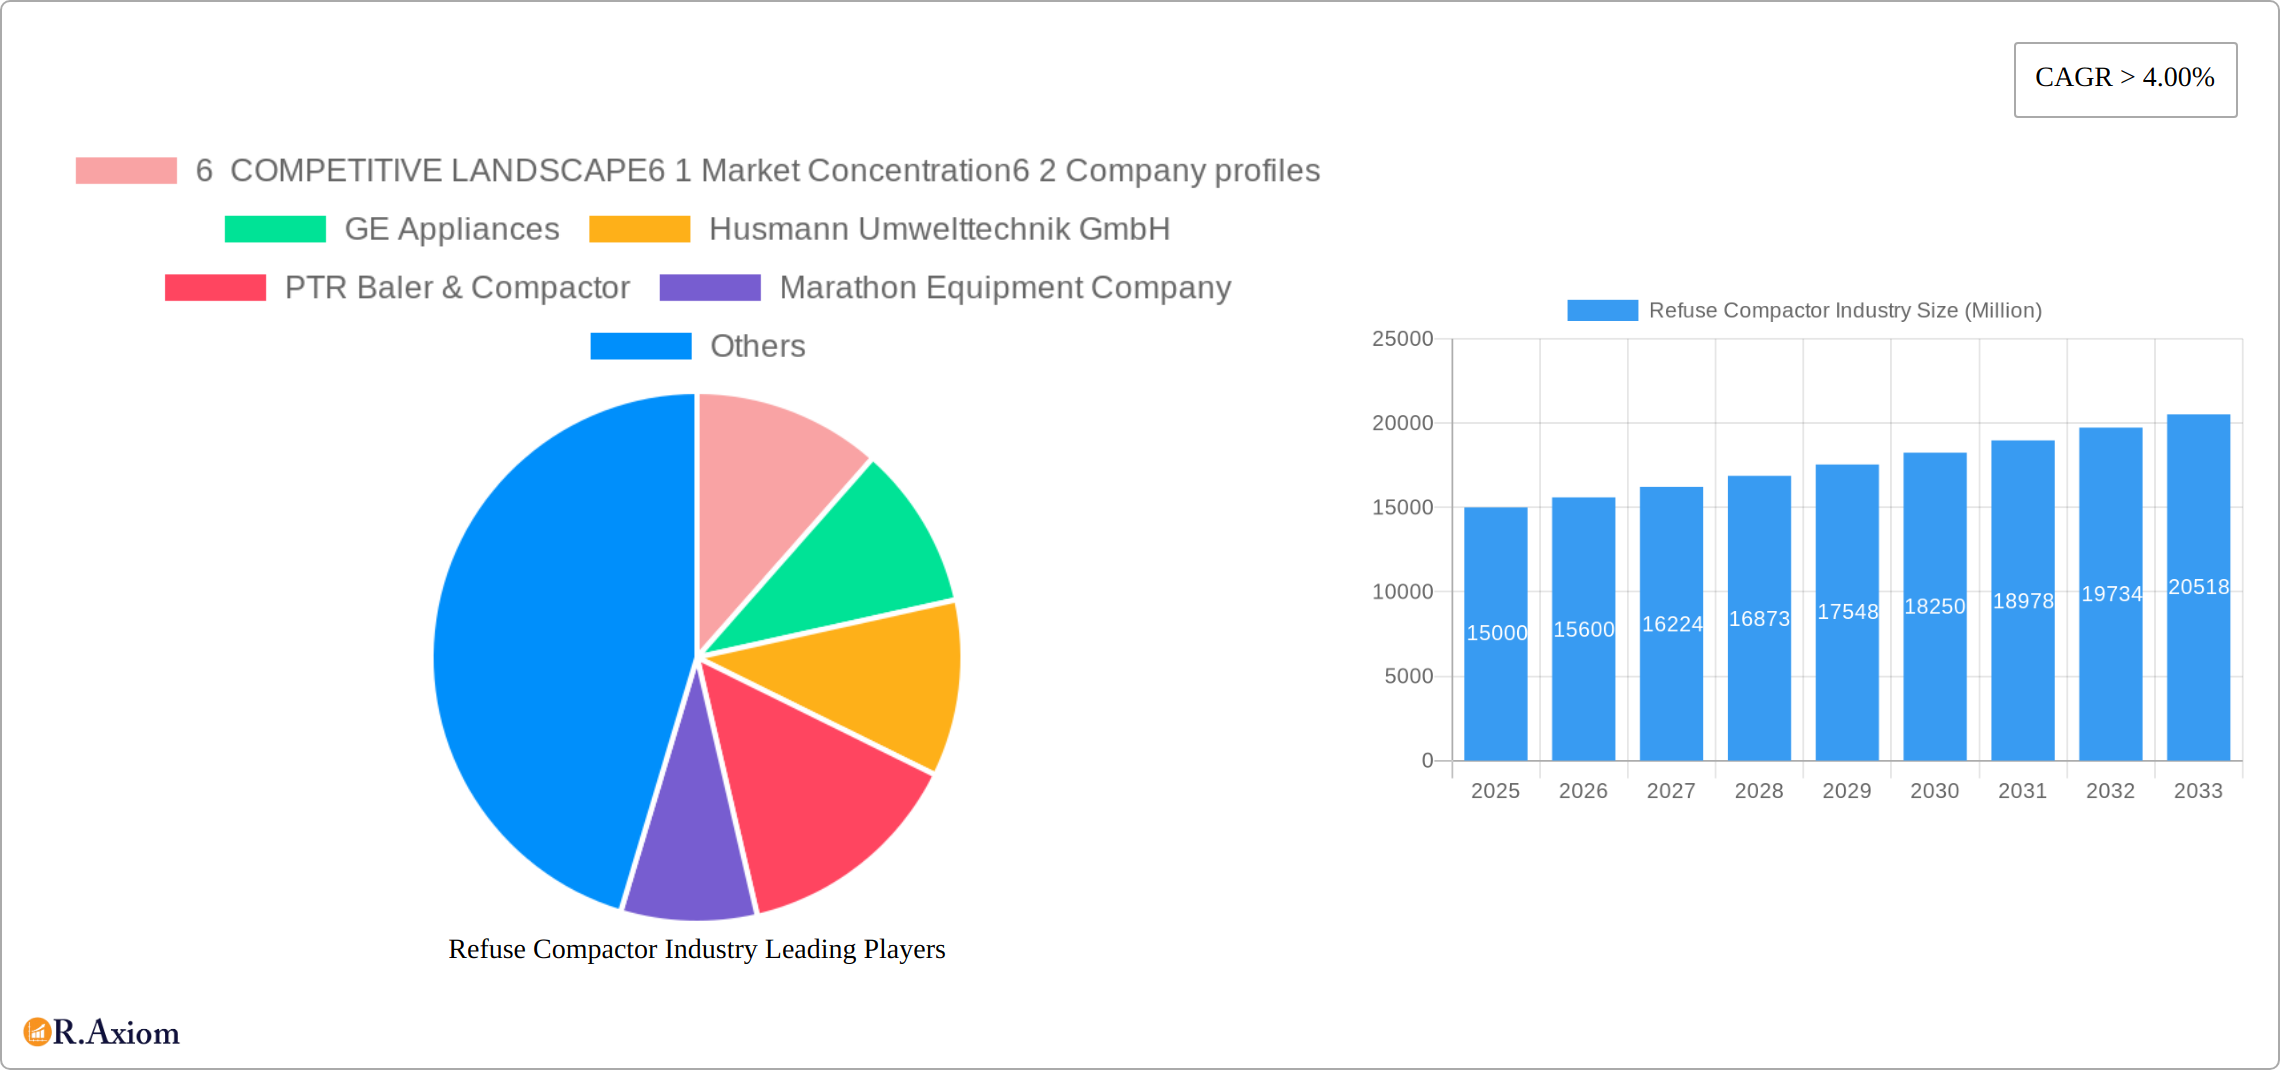
Refuse Compactor Industry Company Market Share
Refuse Compactor Industry Market Report: 2019-2033
This comprehensive report provides a detailed analysis of the global refuse compactor industry, covering market size, segmentation, competitive landscape, key drivers, challenges, and future outlook. The study period spans 2019-2033, with 2025 serving as the base and estimated year. The report offers actionable insights for industry stakeholders, investors, and businesses seeking to navigate this dynamic market. The global market size is projected to reach xx Million by 2033.
Refuse Compactor Industry Market Concentration & Innovation
The refuse compactor industry is characterized by a moderately concentrated market structure, with a handful of prominent players dominating a significant portion of the market share. Projections for 2025 indicate that the top five companies collectively hold approximately **[Insert Market Share Percentage]**% of the global market. A discernible trend towards market consolidation is evident, driven by strategic mergers and acquisitions (M&A). Innovation within the sector is propelled by a confluence of critical factors:
- Stringent Environmental Regulations: Escalating global environmental mandates are compelling the adoption of highly efficient and ecologically responsible waste compaction solutions.
- Technological Advancements: Breakthroughs in automation, sophisticated sensor technology, and integrated smart waste management systems are revolutionizing the industry, leading to substantial improvements in operational efficiency and a reduction in associated costs.
- Urbanization and Waste Generation Growth: The relentless pace of global urbanization and burgeoning populations are directly contributing to an exponential rise in waste generation, thereby intensifying the demand for advanced refuse compactors with superior capacities and performance.
- Competitive Landscape and Product Substitution: While alternative waste management methodologies present a competitive challenge, refuse compactors continue to assert their dominance due to their inherent cost-effectiveness and proven efficiency across a wide spectrum of applications.
- Evolving End-User Preferences: Businesses and municipal authorities are increasingly prioritizing compactors equipped with cutting-edge features, including real-time remote monitoring capabilities, advanced data analytics for performance optimization, and demonstrably lower energy consumption profiles.
M&A activity within the refuse compactor sector has been consistently active in recent years. While precise financial valuations for all transactions remain proprietary, notable consolidations have occurred as companies strategically aim to broaden their geographical footprints and diversify their product portfolios. As an illustrative example, a significant acquisition in 2024, estimated at **[Insert Acquisition Value]** Million dollars, successfully integrated two key entities within the North American market, underscoring the ongoing consolidation efforts.
Refuse Compactor Industry Industry Trends & Insights
The global refuse compactor market is experiencing robust growth, driven by several factors. The Compound Annual Growth Rate (CAGR) for the forecast period (2025-2033) is estimated at xx%. Market penetration is highest in developed regions, but significant growth is expected from emerging economies due to rapid urbanization and infrastructure development.
Key trends shaping the industry include:
- Increased adoption of smart compactors: Integration of IoT technologies is allowing for real-time monitoring of compactor status, optimizing collection routes and predicting maintenance needs.
- Growing demand for customized solutions: Companies are increasingly offering tailored solutions to meet the specific waste management needs of diverse end-users.
- Focus on sustainable practices: Manufacturers are prioritizing the use of eco-friendly materials and designs, reducing the environmental footprint of their products.
- Intensifying competition: Increased market participation leads to competitive pricing and the introduction of innovative features to attract customers.
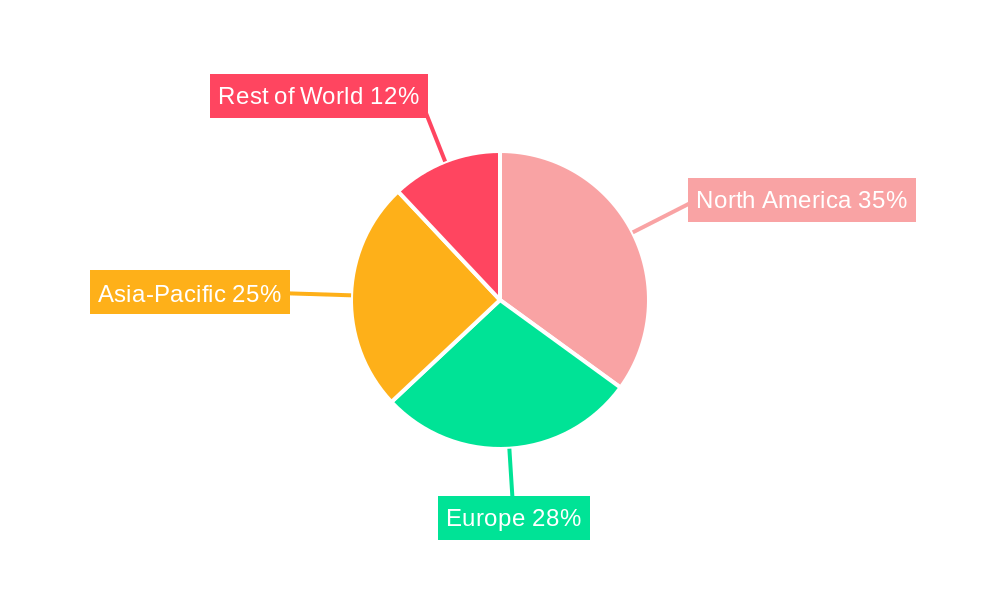
Dominant Markets & Segments in Refuse Compactor Industry
The North American market currently dominates the global refuse compactor industry, driven by stringent waste management regulations and well-developed infrastructure. However, Asia-Pacific is expected to show the fastest growth rate during the forecast period.
Key Drivers for North American Dominance:
- Stronger environmental regulations and proactive waste management policies.
- Mature waste management infrastructure.
- Higher adoption rates of advanced compaction technologies.
- High disposable incomes leading to increased spending on efficient waste management solutions.
Key Drivers for Asia-Pacific Growth:
- Rapid urbanization and increasing population density.
- Significant investments in infrastructure development.
- Growing awareness of environmental concerns.
- Government initiatives promoting sustainable waste management practices.
Other significant markets include Europe and the rest of the world, each with its unique market dynamics. Detailed regional analysis is included in the full report.
Refuse Compactor Industry Product Developments
Recent product innovations focus on enhancing efficiency, sustainability, and operational ease. Manufacturers are introducing compactors with larger capacities, improved compression ratios, and advanced control systems. The integration of IoT and data analytics provides valuable insights into waste generation patterns and allows for proactive maintenance, optimizing the overall waste management process. New compactors are designed to minimize noise pollution and energy consumption, aligning with global sustainability goals.
Report Scope & Segmentation Analysis
This comprehensive report meticulously segments the global refuse compactor market across several critical dimensions to provide granular insights:
By Product Type: The market is categorized into diverse compactor classifications, including self-contained units, stationary compactors, and mobile compactors. Each sub-segment is analyzed for its distinct market size, growth trajectory, and competitive dynamics, which are primarily influenced by technological innovation and strategic pricing.
By Application: The market segmentation extends to application-specific sectors, encompassing residential, commercial, industrial, and municipal waste management. Each of these segments presents unique demand drivers, growth patterns, and is shaped by local regulatory landscapes and specific waste generation characteristics.
By Region: A detailed regional analysis is provided, featuring in-depth examinations of North America, Europe, Asia-Pacific, and the Rest of the World. This regional breakdown considers crucial factors such as economic development levels, prevailing regulatory frameworks, and varying rates of technological adoption.
Key Drivers of Refuse Compactor Industry Growth
Several factors are driving the growth of the refuse compactor industry:
- Stricter environmental regulations: Governments are implementing stringent rules regarding waste management, pushing for more efficient compaction technologies.
- Rising urbanization and waste generation: Growing populations in urban areas lead to increased waste generation, demanding better waste management solutions.
- Technological advancements: Innovations in automation, smart technologies, and data analytics optimize waste management processes and reduce operational costs.
- Growing awareness of environmental sustainability: Increased awareness of the environmental impacts of improper waste disposal drives adoption of sustainable compaction solutions.
Challenges in the Refuse Compactor Industry Sector
The refuse compactor industry faces several challenges:
- High initial investment costs: The procurement of advanced compactors can be expensive, posing a barrier for smaller businesses and municipalities.
- Fluctuating raw material prices: The cost of manufacturing components can be volatile, affecting production costs and pricing strategies.
- Stringent safety regulations: Compliance with complex safety regulations adds to the cost and complexity of manufacturing and operation.
- Intense competition: A competitive market landscape necessitates continuous innovation and efficient operations to maintain market share.
Emerging Opportunities in Refuse Compactor Industry
The refuse compactor industry is ripe with compelling emerging opportunities for growth and innovation:
- Expansion into Emerging Markets: The rapid pace of urbanization and industrialization in developing economies presents a substantial and growing demand for sophisticated and efficient waste management solutions, including advanced refuse compactors.
- Development of Sustainable Compaction Technologies: A global imperative towards environmental sustainability is fueling significant demand for compactors constructed from eco-friendly materials, designed with reduced environmental impact, and incorporating energy-efficient operational mechanisms.
- Integration of Smart Technologies: The pervasive adoption of the Internet of Things (IoT) and Artificial Intelligence (AI) offers transformative opportunities for optimizing compactor performance, enabling predictive maintenance, and facilitating comprehensive remote monitoring and management of compaction operations.
- Providing Customized Solutions: A growing need for tailored waste management strategies across diverse industries and municipalities creates significant market openings for manufacturers capable of developing and delivering specialized, high-performance compactor solutions designed to meet unique operational requirements.
Leading Players in the Refuse Compactor Industry Market
- GE Appliances
- Husmann Umwelttechnik GmbH
- PTR Baler & Compactor
- Marathon Equipment Company
- Capital Compactors Ltd
- Compactor Management Company
- Genesis Waste Handling Private Limited
- Precision Machinery Systems
- ACE Equipment Company
- Wastequip LLC
(This list represents key market participants and is not exhaustive.)
Key Developments in Refuse Compactor Industry
- September 2021: Wastequip unveiled Wasteware, an innovative cloud-based technology platform designed to enhance operational efficiency and data analytics within the waste and recycling sectors.
- February 2022: The New Town Kolkata Development Authority announced plans for the establishment of 15 new compactor stations, signaling substantial infrastructure investment in waste management within emerging economic regions and highlighting the growing importance of efficient waste handling.
Strategic Outlook for Refuse Compactor Industry Market
The refuse compactor industry is poised for continued growth, driven by increasing urbanization, stringent environmental regulations, and technological advancements. Opportunities lie in developing sustainable, smart, and customized solutions to cater to the diverse needs of various sectors. Companies that can adapt to these trends and leverage technological innovations will be well-positioned for success in this dynamic market.
Refuse Compactor Industry Segmentation
-
1. Product Type
- 1.1. Portable
- 1.2. Stationary
-
2. Waste Type
- 2.1. Dry Waste
- 2.2. Wet Waste
-
3. Application
- 3.1. Residential
- 3.2. Agricultural
- 3.3. Municipal
- 3.4. Commercial
- 3.5. Industrial
Refuse Compactor Industry Segmentation By Geography
- 1. North America
- 2. Latin America
- 3. Asia Pacific
- 4. Middle East and Africa
- 5. Europe
- 6. Rest of the World
Refuse Compactor Industry Regional Market Share
Geographic Coverage of Refuse Compactor Industry
Refuse Compactor Industry REPORT HIGHLIGHTS
| Aspects | Details |
|---|---|
| Study Period | 2020-2034 |
| Base Year | 2025 |
| Estimated Year | 2026 |
| Forecast Period | 2026-2034 |
| Historical Period | 2020-2025 |
| Growth Rate | CAGR of 3.4% from 2020-2034 |
| Segmentation |
|
Table of Contents
- 1. Introduction
- 1.1. Research Scope
- 1.2. Market Segmentation
- 1.3. Research Objective
- 1.4. Definitions and Assumptions
- 2. Executive Summary
- 2.1. Market Snapshot
- 3. Market Dynamics
- 3.1. Market Drivers
- 3.2. Market Restrains
- 3.3. Market Trends
- 3.4. Market Opportunities
- 4. Market Factor Analysis
- 4.1. Porters Five Forces
- 4.1.1. Bargaining Power of Suppliers
- 4.1.2. Bargaining Power of Buyers
- 4.1.3. Threat of New Entrants
- 4.1.4. Threat of Substitutes
- 4.1.5. Competitive Rivalry
- 4.2. PESTEL analysis
- 4.3. BCG Analysis
- 4.3.1. Stars (High Growth, High Market Share)
- 4.3.2. Cash Cows (Low Growth, High Market Share)
- 4.3.3. Question Mark (High Growth, Low Market Share)
- 4.3.4. Dogs (Low Growth, Low Market Share)
- 4.4. Ansoff Matrix Analysis
- 4.5. Supply Chain Analysis
- 4.6. Regulatory Landscape
- 4.7. Current Market Potential and Opportunity Assessment (TAM–SAM–SOM Framework)
- 4.8. RAX Analyst Note
- 4.1. Porters Five Forces
- 5. Market Analysis, Insights and Forecast 2021-2033
- 5.1. Market Analysis, Insights and Forecast - by Product Type
- 5.1.1. Portable
- 5.1.2. Stationary
- 5.2. Market Analysis, Insights and Forecast - by Waste Type
- 5.2.1. Dry Waste
- 5.2.2. Wet Waste
- 5.3. Market Analysis, Insights and Forecast - by Application
- 5.3.1. Residential
- 5.3.2. Agricultural
- 5.3.3. Municipal
- 5.3.4. Commercial
- 5.3.5. Industrial
- 5.4. Market Analysis, Insights and Forecast - by Region
- 5.4.1. North America
- 5.4.2. Latin America
- 5.4.3. Asia Pacific
- 5.4.4. Middle East and Africa
- 5.4.5. Europe
- 5.4.6. Rest of the World
- 5.1. Market Analysis, Insights and Forecast - by Product Type
- 6. Global Refuse Compactor Industry Analysis, Insights and Forecast, 2021-2033
- 6.1. Market Analysis, Insights and Forecast - by Product Type
- 6.1.1. Portable
- 6.1.2. Stationary
- 6.2. Market Analysis, Insights and Forecast - by Waste Type
- 6.2.1. Dry Waste
- 6.2.2. Wet Waste
- 6.3. Market Analysis, Insights and Forecast - by Application
- 6.3.1. Residential
- 6.3.2. Agricultural
- 6.3.3. Municipal
- 6.3.4. Commercial
- 6.3.5. Industrial
- 6.1. Market Analysis, Insights and Forecast - by Product Type
- 7. North America Refuse Compactor Industry Analysis, Insights and Forecast, 2020-2032
- 7.1. Market Analysis, Insights and Forecast - by Product Type
- 7.1.1. Portable
- 7.1.2. Stationary
- 7.2. Market Analysis, Insights and Forecast - by Waste Type
- 7.2.1. Dry Waste
- 7.2.2. Wet Waste
- 7.3. Market Analysis, Insights and Forecast - by Application
- 7.3.1. Residential
- 7.3.2. Agricultural
- 7.3.3. Municipal
- 7.3.4. Commercial
- 7.3.5. Industrial
- 7.1. Market Analysis, Insights and Forecast - by Product Type
- 8. Latin America Refuse Compactor Industry Analysis, Insights and Forecast, 2020-2032
- 8.1. Market Analysis, Insights and Forecast - by Product Type
- 8.1.1. Portable
- 8.1.2. Stationary
- 8.2. Market Analysis, Insights and Forecast - by Waste Type
- 8.2.1. Dry Waste
- 8.2.2. Wet Waste
- 8.3. Market Analysis, Insights and Forecast - by Application
- 8.3.1. Residential
- 8.3.2. Agricultural
- 8.3.3. Municipal
- 8.3.4. Commercial
- 8.3.5. Industrial
- 8.1. Market Analysis, Insights and Forecast - by Product Type
- 9. Asia Pacific Refuse Compactor Industry Analysis, Insights and Forecast, 2020-2032
- 9.1. Market Analysis, Insights and Forecast - by Product Type
- 9.1.1. Portable
- 9.1.2. Stationary
- 9.2. Market Analysis, Insights and Forecast - by Waste Type
- 9.2.1. Dry Waste
- 9.2.2. Wet Waste
- 9.3. Market Analysis, Insights and Forecast - by Application
- 9.3.1. Residential
- 9.3.2. Agricultural
- 9.3.3. Municipal
- 9.3.4. Commercial
- 9.3.5. Industrial
- 9.1. Market Analysis, Insights and Forecast - by Product Type
- 10. Middle East and Africa Refuse Compactor Industry Analysis, Insights and Forecast, 2020-2032
- 10.1. Market Analysis, Insights and Forecast - by Product Type
- 10.1.1. Portable
- 10.1.2. Stationary
- 10.2. Market Analysis, Insights and Forecast - by Waste Type
- 10.2.1. Dry Waste
- 10.2.2. Wet Waste
- 10.3. Market Analysis, Insights and Forecast - by Application
- 10.3.1. Residential
- 10.3.2. Agricultural
- 10.3.3. Municipal
- 10.3.4. Commercial
- 10.3.5. Industrial
- 10.1. Market Analysis, Insights and Forecast - by Product Type
- 11. Europe Refuse Compactor Industry Analysis, Insights and Forecast, 2020-2032
- 11.1. Market Analysis, Insights and Forecast - by Product Type
- 11.1.1. Portable
- 11.1.2. Stationary
- 11.2. Market Analysis, Insights and Forecast - by Waste Type
- 11.2.1. Dry Waste
- 11.2.2. Wet Waste
- 11.3. Market Analysis, Insights and Forecast - by Application
- 11.3.1. Residential
- 11.3.2. Agricultural
- 11.3.3. Municipal
- 11.3.4. Commercial
- 11.3.5. Industrial
- 11.1. Market Analysis, Insights and Forecast - by Product Type
- 12. Rest of the World Refuse Compactor Industry Analysis, Insights and Forecast, 2020-2032
- 12.1. Market Analysis, Insights and Forecast - by Product Type
- 12.1.1. Portable
- 12.1.2. Stationary
- 12.2. Market Analysis, Insights and Forecast - by Waste Type
- 12.2.1. Dry Waste
- 12.2.2. Wet Waste
- 12.3. Market Analysis, Insights and Forecast - by Application
- 12.3.1. Residential
- 12.3.2. Agricultural
- 12.3.3. Municipal
- 12.3.4. Commercial
- 12.3.5. Industrial
- 12.1. Market Analysis, Insights and Forecast - by Product Type
- 13. Competitive Analysis
- 13.1. Company Profiles
- 13.1.1 6 COMPETITIVE LANDSCAPE6 1 Market Concentration6 2 Company profiles
- 13.1.1.1. Company Overview
- 13.1.1.2. Products
- 13.1.1.3. Company Financials
- 13.1.1.4. SWOT Analysis
- 13.1.2 GE Appliances
- 13.1.2.1. Company Overview
- 13.1.2.2. Products
- 13.1.2.3. Company Financials
- 13.1.2.4. SWOT Analysis
- 13.1.3 Husmann Umwelttechnik GmbH
- 13.1.3.1. Company Overview
- 13.1.3.2. Products
- 13.1.3.3. Company Financials
- 13.1.3.4. SWOT Analysis
- 13.1.4 PTR Baler & Compactor
- 13.1.4.1. Company Overview
- 13.1.4.2. Products
- 13.1.4.3. Company Financials
- 13.1.4.4. SWOT Analysis
- 13.1.5 Marathon Equipment Company
- 13.1.5.1. Company Overview
- 13.1.5.2. Products
- 13.1.5.3. Company Financials
- 13.1.5.4. SWOT Analysis
- 13.1.6 Capital Compactors Ltd
- 13.1.6.1. Company Overview
- 13.1.6.2. Products
- 13.1.6.3. Company Financials
- 13.1.6.4. SWOT Analysis
- 13.1.7 Compactor Management Company
- 13.1.7.1. Company Overview
- 13.1.7.2. Products
- 13.1.7.3. Company Financials
- 13.1.7.4. SWOT Analysis
- 13.1.8 Genesis Waste Handling Private Limited
- 13.1.8.1. Company Overview
- 13.1.8.2. Products
- 13.1.8.3. Company Financials
- 13.1.8.4. SWOT Analysis
- 13.1.9 Precision Machinery Systems
- 13.1.9.1. Company Overview
- 13.1.9.2. Products
- 13.1.9.3. Company Financials
- 13.1.9.4. SWOT Analysis
- 13.1.10 ACE Equipment Company
- 13.1.10.1. Company Overview
- 13.1.10.2. Products
- 13.1.10.3. Company Financials
- 13.1.10.4. SWOT Analysis
- 13.1.11 Wastequip LLC **List Not Exhaustive
- 13.1.11.1. Company Overview
- 13.1.11.2. Products
- 13.1.11.3. Company Financials
- 13.1.11.4. SWOT Analysis
- 13.1.1 6 COMPETITIVE LANDSCAPE6 1 Market Concentration6 2 Company profiles
- 13.2. Market Entropy
- 13.2.1 Company's Key Areas Served
- 13.2.2 Recent Developments
- 13.3. Company Market Share Analysis 2025
- 13.3.1 Top 5 Companies Market Share Analysis
- 13.3.2 Top 3 Companies Market Share Analysis
- 13.4. List of Potential Customers
- 14. Research Methodology
List of Figures
- Figure 1: Global Refuse Compactor Industry Revenue Breakdown (million, %) by Region 2025 & 2033
- Figure 2: North America Refuse Compactor Industry Revenue (million), by Product Type 2025 & 2033
- Figure 3: North America Refuse Compactor Industry Revenue Share (%), by Product Type 2025 & 2033
- Figure 4: North America Refuse Compactor Industry Revenue (million), by Waste Type 2025 & 2033
- Figure 5: North America Refuse Compactor Industry Revenue Share (%), by Waste Type 2025 & 2033
- Figure 6: North America Refuse Compactor Industry Revenue (million), by Application 2025 & 2033
- Figure 7: North America Refuse Compactor Industry Revenue Share (%), by Application 2025 & 2033
- Figure 8: North America Refuse Compactor Industry Revenue (million), by Country 2025 & 2033
- Figure 9: North America Refuse Compactor Industry Revenue Share (%), by Country 2025 & 2033
- Figure 10: Latin America Refuse Compactor Industry Revenue (million), by Product Type 2025 & 2033
- Figure 11: Latin America Refuse Compactor Industry Revenue Share (%), by Product Type 2025 & 2033
- Figure 12: Latin America Refuse Compactor Industry Revenue (million), by Waste Type 2025 & 2033
- Figure 13: Latin America Refuse Compactor Industry Revenue Share (%), by Waste Type 2025 & 2033
- Figure 14: Latin America Refuse Compactor Industry Revenue (million), by Application 2025 & 2033
- Figure 15: Latin America Refuse Compactor Industry Revenue Share (%), by Application 2025 & 2033
- Figure 16: Latin America Refuse Compactor Industry Revenue (million), by Country 2025 & 2033
- Figure 17: Latin America Refuse Compactor Industry Revenue Share (%), by Country 2025 & 2033
- Figure 18: Asia Pacific Refuse Compactor Industry Revenue (million), by Product Type 2025 & 2033
- Figure 19: Asia Pacific Refuse Compactor Industry Revenue Share (%), by Product Type 2025 & 2033
- Figure 20: Asia Pacific Refuse Compactor Industry Revenue (million), by Waste Type 2025 & 2033
- Figure 21: Asia Pacific Refuse Compactor Industry Revenue Share (%), by Waste Type 2025 & 2033
- Figure 22: Asia Pacific Refuse Compactor Industry Revenue (million), by Application 2025 & 2033
- Figure 23: Asia Pacific Refuse Compactor Industry Revenue Share (%), by Application 2025 & 2033
- Figure 24: Asia Pacific Refuse Compactor Industry Revenue (million), by Country 2025 & 2033
- Figure 25: Asia Pacific Refuse Compactor Industry Revenue Share (%), by Country 2025 & 2033
- Figure 26: Middle East and Africa Refuse Compactor Industry Revenue (million), by Product Type 2025 & 2033
- Figure 27: Middle East and Africa Refuse Compactor Industry Revenue Share (%), by Product Type 2025 & 2033
- Figure 28: Middle East and Africa Refuse Compactor Industry Revenue (million), by Waste Type 2025 & 2033
- Figure 29: Middle East and Africa Refuse Compactor Industry Revenue Share (%), by Waste Type 2025 & 2033
- Figure 30: Middle East and Africa Refuse Compactor Industry Revenue (million), by Application 2025 & 2033
- Figure 31: Middle East and Africa Refuse Compactor Industry Revenue Share (%), by Application 2025 & 2033
- Figure 32: Middle East and Africa Refuse Compactor Industry Revenue (million), by Country 2025 & 2033
- Figure 33: Middle East and Africa Refuse Compactor Industry Revenue Share (%), by Country 2025 & 2033
- Figure 34: Europe Refuse Compactor Industry Revenue (million), by Product Type 2025 & 2033
- Figure 35: Europe Refuse Compactor Industry Revenue Share (%), by Product Type 2025 & 2033
- Figure 36: Europe Refuse Compactor Industry Revenue (million), by Waste Type 2025 & 2033
- Figure 37: Europe Refuse Compactor Industry Revenue Share (%), by Waste Type 2025 & 2033
- Figure 38: Europe Refuse Compactor Industry Revenue (million), by Application 2025 & 2033
- Figure 39: Europe Refuse Compactor Industry Revenue Share (%), by Application 2025 & 2033
- Figure 40: Europe Refuse Compactor Industry Revenue (million), by Country 2025 & 2033
- Figure 41: Europe Refuse Compactor Industry Revenue Share (%), by Country 2025 & 2033
- Figure 42: Rest of the World Refuse Compactor Industry Revenue (million), by Product Type 2025 & 2033
- Figure 43: Rest of the World Refuse Compactor Industry Revenue Share (%), by Product Type 2025 & 2033
- Figure 44: Rest of the World Refuse Compactor Industry Revenue (million), by Waste Type 2025 & 2033
- Figure 45: Rest of the World Refuse Compactor Industry Revenue Share (%), by Waste Type 2025 & 2033
- Figure 46: Rest of the World Refuse Compactor Industry Revenue (million), by Application 2025 & 2033
- Figure 47: Rest of the World Refuse Compactor Industry Revenue Share (%), by Application 2025 & 2033
- Figure 48: Rest of the World Refuse Compactor Industry Revenue (million), by Country 2025 & 2033
- Figure 49: Rest of the World Refuse Compactor Industry Revenue Share (%), by Country 2025 & 2033
List of Tables
- Table 1: Global Refuse Compactor Industry Revenue million Forecast, by Product Type 2020 & 2033
- Table 2: Global Refuse Compactor Industry Revenue million Forecast, by Waste Type 2020 & 2033
- Table 3: Global Refuse Compactor Industry Revenue million Forecast, by Application 2020 & 2033
- Table 4: Global Refuse Compactor Industry Revenue million Forecast, by Region 2020 & 2033
- Table 5: Global Refuse Compactor Industry Revenue million Forecast, by Product Type 2020 & 2033
- Table 6: Global Refuse Compactor Industry Revenue million Forecast, by Waste Type 2020 & 2033
- Table 7: Global Refuse Compactor Industry Revenue million Forecast, by Application 2020 & 2033
- Table 8: Global Refuse Compactor Industry Revenue million Forecast, by Country 2020 & 2033
- Table 9: Global Refuse Compactor Industry Revenue million Forecast, by Product Type 2020 & 2033
- Table 10: Global Refuse Compactor Industry Revenue million Forecast, by Waste Type 2020 & 2033
- Table 11: Global Refuse Compactor Industry Revenue million Forecast, by Application 2020 & 2033
- Table 12: Global Refuse Compactor Industry Revenue million Forecast, by Country 2020 & 2033
- Table 13: Global Refuse Compactor Industry Revenue million Forecast, by Product Type 2020 & 2033
- Table 14: Global Refuse Compactor Industry Revenue million Forecast, by Waste Type 2020 & 2033
- Table 15: Global Refuse Compactor Industry Revenue million Forecast, by Application 2020 & 2033
- Table 16: Global Refuse Compactor Industry Revenue million Forecast, by Country 2020 & 2033
- Table 17: Global Refuse Compactor Industry Revenue million Forecast, by Product Type 2020 & 2033
- Table 18: Global Refuse Compactor Industry Revenue million Forecast, by Waste Type 2020 & 2033
- Table 19: Global Refuse Compactor Industry Revenue million Forecast, by Application 2020 & 2033
- Table 20: Global Refuse Compactor Industry Revenue million Forecast, by Country 2020 & 2033
- Table 21: Global Refuse Compactor Industry Revenue million Forecast, by Product Type 2020 & 2033
- Table 22: Global Refuse Compactor Industry Revenue million Forecast, by Waste Type 2020 & 2033
- Table 23: Global Refuse Compactor Industry Revenue million Forecast, by Application 2020 & 2033
- Table 24: Global Refuse Compactor Industry Revenue million Forecast, by Country 2020 & 2033
- Table 25: Global Refuse Compactor Industry Revenue million Forecast, by Product Type 2020 & 2033
- Table 26: Global Refuse Compactor Industry Revenue million Forecast, by Waste Type 2020 & 2033
- Table 27: Global Refuse Compactor Industry Revenue million Forecast, by Application 2020 & 2033
- Table 28: Global Refuse Compactor Industry Revenue million Forecast, by Country 2020 & 2033
Frequently Asked Questions
1. What is the projected Compound Annual Growth Rate (CAGR) of the Refuse Compactor Industry?
The projected CAGR is approximately 3.4%.
2. Which companies are prominent players in the Refuse Compactor Industry?
Key companies in the market include 6 COMPETITIVE LANDSCAPE6 1 Market Concentration6 2 Company profiles, GE Appliances, Husmann Umwelttechnik GmbH, PTR Baler & Compactor, Marathon Equipment Company, Capital Compactors Ltd, Compactor Management Company, Genesis Waste Handling Private Limited, Precision Machinery Systems, ACE Equipment Company, Wastequip LLC **List Not Exhaustive.
3. What are the main segments of the Refuse Compactor Industry?
The market segments include Product Type, Waste Type, Application.
4. Can you provide details about the market size?
The market size is estimated to be USD 280 million as of 2022.
5. What are some drivers contributing to market growth?
N/A
6. What are the notable trends driving market growth?
Asia-Pacific to Dominate the Market.
7. Are there any restraints impacting market growth?
N/A
8. Can you provide examples of recent developments in the market?
February 2022: The New Town Kolkata Development Authority has planned to set up 15 compactor stations in different locations across New Town to facilitate a daily waste collection and disposal system. The compactor stations will be constructed at an estimated cost of about Rs 4.1 crore.
9. What pricing options are available for accessing the report?
Pricing options include single-user, multi-user, and enterprise licenses priced at USD 4750, USD 5250, and USD 8750 respectively.
10. Is the market size provided in terms of value or volume?
The market size is provided in terms of value, measured in million.
11. Are there any specific market keywords associated with the report?
Yes, the market keyword associated with the report is "Refuse Compactor Industry," which aids in identifying and referencing the specific market segment covered.
12. How do I determine which pricing option suits my needs best?
The pricing options vary based on user requirements and access needs. Individual users may opt for single-user licenses, while businesses requiring broader access may choose multi-user or enterprise licenses for cost-effective access to the report.
13. Are there any additional resources or data provided in the Refuse Compactor Industry report?
While the report offers comprehensive insights, it's advisable to review the specific contents or supplementary materials provided to ascertain if additional resources or data are available.
14. How can I stay updated on further developments or reports in the Refuse Compactor Industry?
To stay informed about further developments, trends, and reports in the Refuse Compactor Industry, consider subscribing to industry newsletters, following relevant companies and organizations, or regularly checking reputable industry news sources and publications.
Methodology
Step 1 - Identification of Relevant Samples Size from Population Database


Step 2 - Approaches for Defining Global Market Size (Value, Volume* & Price*)

Note*: In applicable scenarios
Step 3 - Data Sources
Primary Research
- Web Analytics
- Survey Reports
- Research Institute
- Latest Research Reports
- Opinion Leaders
Secondary Research
- Annual Reports
- White Paper
- Latest Press Release
- Industry Association
- Paid Database
- Investor Presentations

Step 4 - Data Triangulation
Involves using different sources of information in order to increase the validity of a study
These sources are likely to be stakeholders in a program - participants, other researchers, program staff, other community members, and so on.
Then we put all data in single framework & apply various statistical tools to find out the dynamic on the market.
During the analysis stage, feedback from the stakeholder groups would be compared to determine areas of agreement as well as areas of divergence